Subscribers questions (IFL, EHL, CIE, STA, CSL, CRN, CSCO US, PPE, Z1P, CWY, BIN, RIO, MIN, VOC, BPT, GMA)
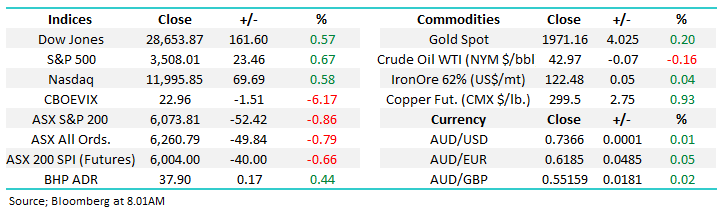
The ASX200 looks destined to start the week off on the back foot ignoring a strong night on Wall Street plus a positive performance from the resources in the US – the SPI futures are calling the local index to open down around 40-points. When I watched the local futures struggle on Friday night my initial feeling was here comes a cap raise and on cue Saturday morning I read that IOOF (IFL) plan to raise around $1bn to buy MLC Wealth from National Australia Bank (NAB). Rumours initially had the price of the huge raise around $3.50 a major 24% discount to its close on Friday given the size of the raise for IFL. This appears to be a good deal for both companies, it allows NAB to focus on what it does best and IFL to expand through a business which it often finds itself in competition.
The timing of this announcement is almost “spooky” after our Weekend Report where we identified the following as the next market sector that could “pop” higher:
“1 – The Financials with the fund managers coming to mind, equities are roaring, especially in the US, there should be flow on effect in performance fees and / or by increased funds under management if just from higher equities alone.”
The sector selling that’s likely to unfold as fund managers look to fund all / part of their IFL allocation through the sale of “like for like” stocks should present some opportunities in the sector and potentially present the ideal risk / reward for MM to step up on the buy side.
MM is very interested in IFL below $4.
NB The SPI futures would have been under pressure on Friday night as the underwriters of the deal hedged part of their market risk.
IOOF Holdings (IFL) Chart
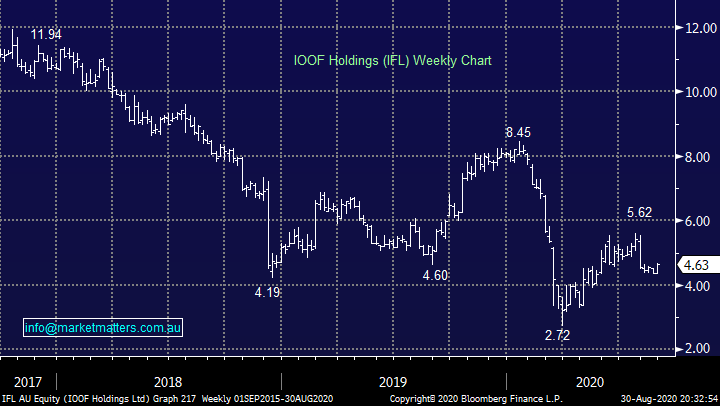
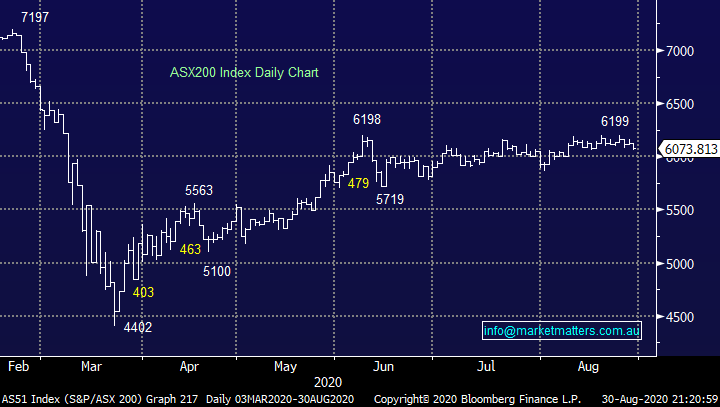
Elsewhere the news was pretty thin over the weekend as the number of cases of COVID-19 across the world surpassed 25 million but that’s passé news from a market perspective and if anything it keeps investors confident / complacent that monetary & fiscal stimulus has much further to run. The property market might feel fragile to some but when apartments / homes in Sydney are still changing hands close to the peak of 2017 It doesn’t look too bad to me, if this stability can be maintained post JobKeeper there are a number of bearish wagers that will require covering, including many towards our Banking Sector.
MM remains bullish Australian stocks medium-term.
ASX200 Index Chart
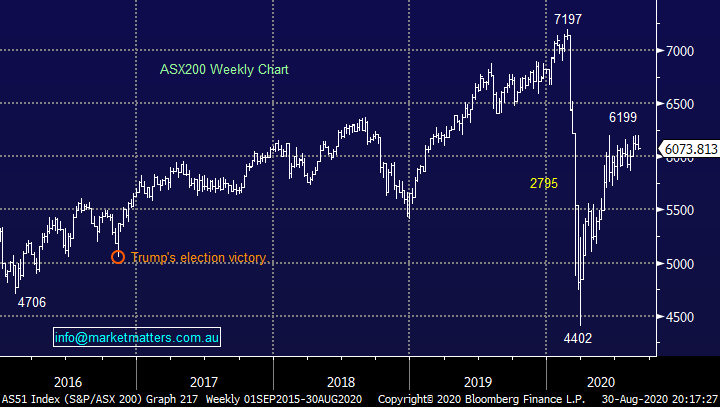
The US S&P500 started to rally to fresh all-time highs this month as the longer dated chart below illustrates perfectly. The worlds evolving at a rapid rate and while we might be overdue for a correction this arguably remains a market in the early throws of its evolution – MM is a buyer of pullbacks in selected pockets of US stocks until further notice i.e. Buy pullbacks is the “plat du jour” until further notice.
MM remains bullish US stocks.
US S&P500 Index Chart
Thanks again for a good cross section of questions this week.
Question 1
“Hi James & The Team. Firstly, well done and thank you for the excellent insights and thoughts. My question relates to leverage, I’ve been investing for about 2 years, initially I leveraged high and chased the rabbit up the hill on stocks like A2 Milk. However, once confidence kicks in the market turns and I’ve found myself selling at the worst possible time. Covid hurt enormously as I pushed any cash back into the portfolio to try and hold out, which finally got me in the end. What annoys me is, the stocks I was holding have had exceptional upside which I’ve now missed. So my question:
1 – What are your general thoughts on approaches to leverage.
2 – What Portfolio LVR buffer should I maintain in the current climate.
3- Given your comments around quality stocks, should I completely avoid 0% LVR’s at the moment.
4 – Ideal # of stocks to hold.
5 – Do MM have a leverage portfolio model or list
I appreciate it’s a difficult and large topic, but any views would be appreciated. Once again, well done and thank you for all the views and obvious hard work the team put in every day.” – Thanks Bruce C.
Morning Bruce,
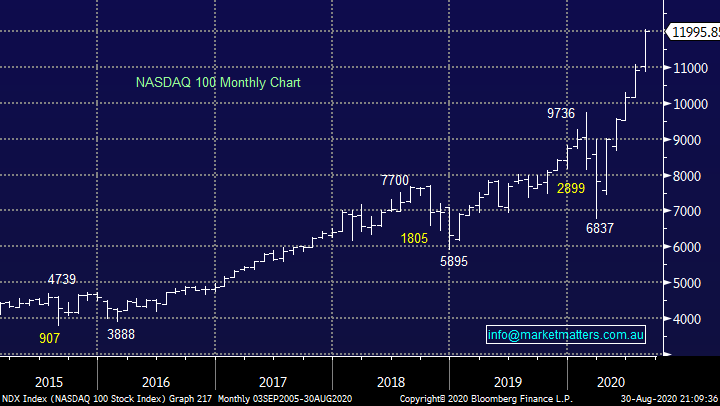
Thanks for the words of appreciation, always well received and indeed a very encapsulating and interesting question. Interestingly Warren Buffett once called derivatives “financial weapons of mass destruction” which is a fairly aggressive way of saying that investors should be very careful using leverage. The mathematics need to be looked at very carefully e.g. On average US stocks correct 10% every year and 20% every 7 years. If an investor is considering taking out a degree of leverage where moves of this degree would cause issues they should think again because by definition its just a matter of time. The period we’ve just been through where the index declined by ~40% is obviously an extreme scenario which happens less frequently; however it does happen.
Using leverage is a very individual thing and depends on a wide suite of considerations. MM provides general commentary only so we would suggest seeking some independent advice around this topic, there are strategies that can be employed to manage the risks associated with using leverage.
If we look at a couple of large cap examples, over the past 10-years, BHP has corrected 70% and CBA 40% in 5-years and of course these are big “blue chips”. Leverage looks great when applied to the likes of Afterpay (APT) but many stocks fall as well as those that rise.
MM believes caution should be adopted to leverage and a professional advisor consulted.
US NASDAQ Index Chart.
Question 2
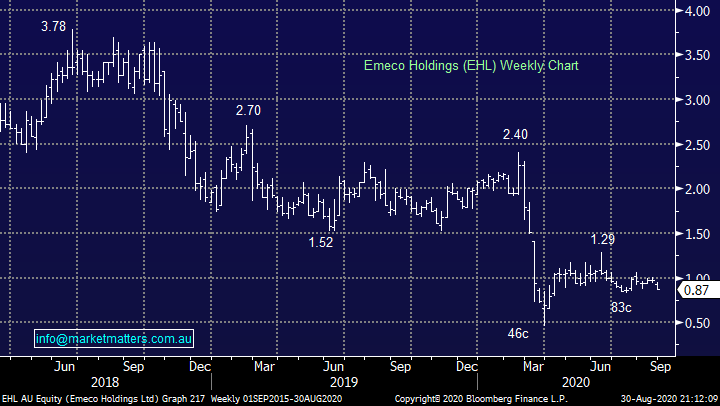
“Hi James, can you cover the Emeco (EHL) equity raise announced on 24 August? The ex-date is Wednesday 26th, but there’s a while before the offer closes. From my reading they are issuing an extra 180M shares, which is an increase of 50% total number of shares currently on issue (360M if I’m reading the tables right). Thus, although the price is at around 20% discount to the current trading price, it dilutes the shares by 30%. Nevertheless, it does address the issue of debt and hopefully put them in a strong position to continue their growth trajectory. What are your thoughts?” - Alan P.
Morning Alan,
Emeco Holdings (EHL) are raising as you outline above and we believe it’s a very logical move but as you say dilutive raise. The 85c issue price looked ok a few days ago but at 87c its clearly not as enticing. At this stage we are giving the mining plant and equipment provider the benefit of the doubt especially as we are fans of the sector and the direction of the business but like all positions its under constant review.
MM is going to take up our EHL entitlement.
Emeco Holdings (EHL) Chart
Question 3
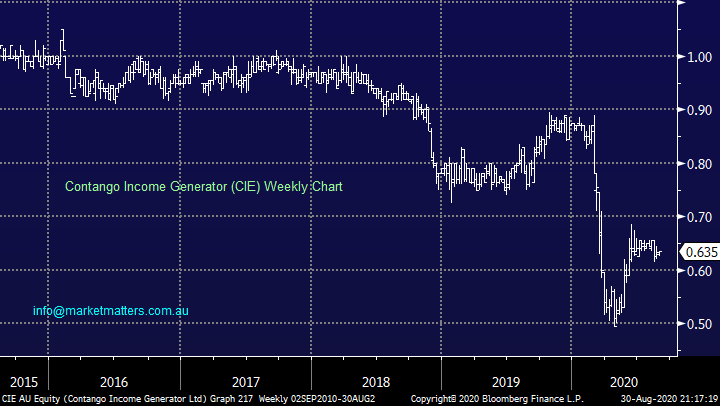
“Hi James and the team, I bought ASX:CIE in March 2018 for $0.98, before I joined MM, with the idea of a regular and good dividend. The dividend has been fine but the share value has decreased to around $0.63. They say the NTA is $0.74 per share. Now there is a SPP happening and a change in the investment strategy, to "a global long short investment strategy managed by WCM investment management." I'm wondering if you have any thoughts on these developments. I really do enjoy your work.” - Thank you, Cameron P.
Morning Cameron,
Contango Income Generator (CIE) has certainly struggled over the years which is no surprise when we look at their holdings which includes almost 10% in regional banks i.e.in hindsight it’s been a classic yield trap. The fund (white line) is benchmarked against the ASX 300 (orange line) and chart below looks at relative performance (excluding dividends in both the index and the fund). This shows very starkly why there is a likely change in manager coming.
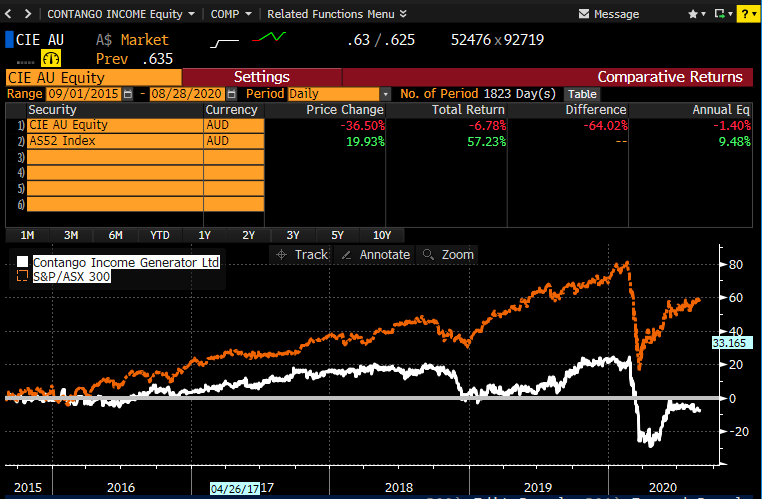
In terms of the next step for CIE I would simply question if the monies you had allocated for yield are now suitable for a more aggressive "global long short investment strategy managed by WCM investment management", obviously only you know the answer to that question but they are very different product offerings.
Contango Income Generator (CIE) Chart
Question 4
“Hi James. Enjoy your commentary on stock-specific as well as macro events. You made the comment in the Sunday newsletter: "On the index level we remain bullish targeting an eventual “pop” above the 6200 area by the ASX200 although the 6000 “magnetic pull” continues, in our opinion the higher the US Indices rally without local participation the greater the possibility that such a rally towards 6300-6500 will become a false breakout, at least short-term. MM has remained fairly aggressively positioned well up the “risk-curve” since March’ s virus led savage sell-off but we reiterate our intention to migrate slightly away from risk if / when such a rally unfolds." Could you elaborate on this a little more. I see US indices hitting record highs yet as you say we are stuck in the 6000 range. However if US continues to march higher, and we continue to stay at the "magnetic 6000", wouldn't our XJO "pop" and gap right up to 6400/6600 range? (and stay there). Or is it simply a case of the 4 x banks anchoring us like a couple of old Ukrainian Submarines? Until the banks move, the "index level" is going to remain stagnant, even though plenty of specific companies are doing really well in this environment. Indeed it has reinforced how quickly tech-businesses can adapt and be nimble to new environments whilst traditional businesses are casualties. Also, when is your new "emerging companies" portfolio being released?” – Thanks, Peace out, Paul M.
Morning Paul,
I love your Ukrainian submarine analogy, how apt when applied to our banks! My comments were relaying thoughts that the higher US stocks rally the more likely they are to experience another 10% correction, all very common and healthy in a bull market. However, if we’ve just managed to “pop” up towards say 6300-6500 and the US market does indeed fall 10% I doubt we will be able to maintain the gains. However, with most of the action unfolding under the hood what happens on the index level is not as interesting as during many previous periods.
MM is bullish the ASX medium-term.
ASX200 Index Chart
Question 5
“Hi James, You are probably aware of negative commentary in the MSM on the subject of capital raisings since the rash of these started a few months ago. The main theme here being the way they typically disadvantage retail shareholders to the benefit of institutions in placements/SPP. One particularly scathing article was by The Australian’s business columnist Terry McCrann on May 29 titled “SPP structures and their fig leaf of fake fairness”. Allowing for Terry’s tendency to hyperbole he does nonetheless seem to raise some valid objections. A seemingly even more egregious example is that of pure placements where existing shareholders are completely excluded from a process which dilutes their holdings, such as the current placement by Strandline Resources (STA). I haven’t seen any writers in the press defending these practices. Is there a flip side to the story?” - Many thanks, Rob M.
Morning Rob,
I agree with the sentiments here and think there is a lot more to do in terms of creating a fairer playing field. In my view, existing shareholders should get first dibs to increase their holding on a pro-rata basis, whether they are retail or institutional, followed by a placement for any stock that is not taken up, not the other way around.
The only real flip side to the argument is that when a company elects to raise money, they want to do it with a high level of certainty and in a quick period of time. Certainty comes from the underwriters guaranteeing the funds will be raised (for a fee) and what typically happens is the underwriters would get some strong indication from larger institutions that the raise will be supported. For providing that, the institutions are ‘looking for’ a decent allocation and so the cogs continue to turn.
Without banging the drum for corporates as I completely support your view Rob, what I have noticed during this recent raising period is a slight change in allocation policy, and I can vouch for the fact this has actually been applied as stated. Using the Perpetual (PPT) raise as an example, the communication we got (and I’ve never seem seen this in years gone by) around the book was:
Important Points
1. PPT is focussing on existing holders, who are sophisticated and professional and hold between 5,000 – 100,000 shares for participation in the institutional placement
2. It is intended that shareholders who bid for up to their ‘pro rata’ will receive a pro rata allocation on a best endeavours basis
3. Other existing shareholders are encouraged to participate in the SPP
4. You may submit bids on behalf of sophisticated and professional clients that are non-shareholders and shareholders however there is no guarantee you will receive an allocation
The outcome of this was that clients I bid for in the institutional placement, received their po-rata allocation. I also bid for non-holders who got nothing.
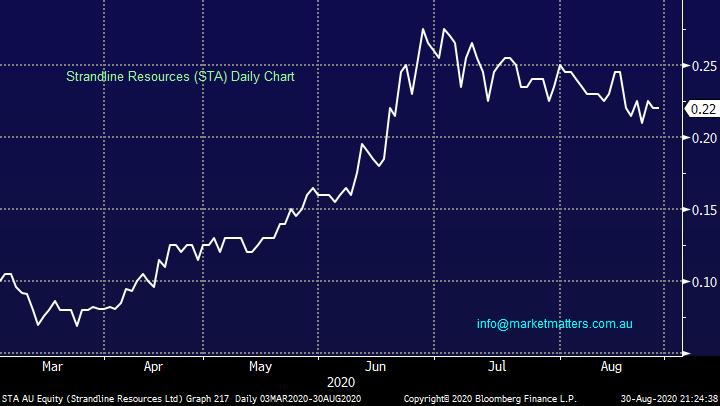
In terms of STA, you make a very valid point. A placement with no SPP for existing shareholders, which personally I completely disagree with. Shaw and Partners was the Lead Manager of this offer...
Investing is like any game we might play on the weekend, it has a set of rules which in these free thinking times we don’t always agree with but its hard to change rules and usually not worth the angst, efforts are best deployed at remaining on the correct side of the ledger.
Strandline Resources (STA) Chart
Question 6
“Hi MM team, In relation to your comment from Wednesday's PM report. "Yesterday’s weakness continued today despite a seemingly strong lead from the US overnight which made fresh all-time highs on the S&P. The local weakness topped 120pts in around 26 hours following yesterday’s lunge at 6200 to the midday low today before equities staged a mild recovery into the afternoon. Still the Aussie market underperformed Asian indices throughout the session which traded broadly flat on the day." What do you think is driving the difference in behaviour between our markets and the US? Especially seeing as our reports are generally on the positive side, or at least less bad then expected?” - Thanks Scott S.
Morning Scott,
A couple of major factors are weighing on our index depending on who you compare us to:
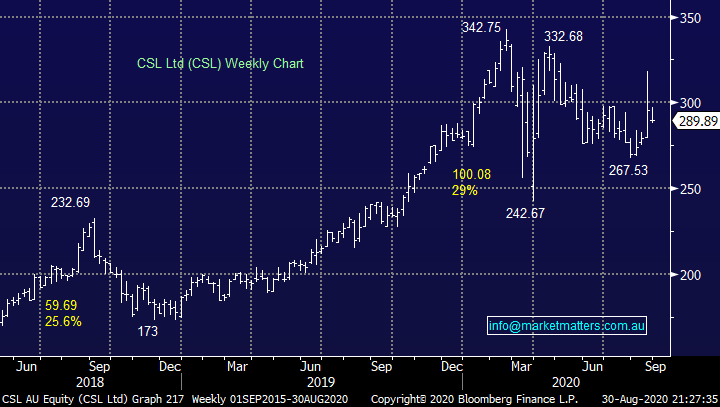
1 – The local index is struggling because the heavyweight banks and CSL are currently major underperformers and that’s approaching 30% of the ASX.
2 – US stocks are soaring because of the FANG’s with just 3 stocks, Apple, Microsoft and Amazon, make up a whopping 17% of the entire major US index and they’re all rallying strongly.
3 – However the ASX is walking in the shadow of Europe, it’s only the US that’s making us look pedestrian.
MM remains neutral CSL.
CSL Ltd (CSL) Chart
Question 7
“CRN Corranando Global Do you think taking up the Retail Participation Offer in the Cash Raise is worthwhile? @ 2 for 11 shares Held @ $0.60? I Bought @ $1.11 only to watch the continuing Share Price decline. The Stock was Market Capped @ $2B plus when I bought, now $800M What is your view on CRN and coal commodity prices for the Medium term? You provide a great insight to the markets.” - Thank You Richard O.
Hi Richard,
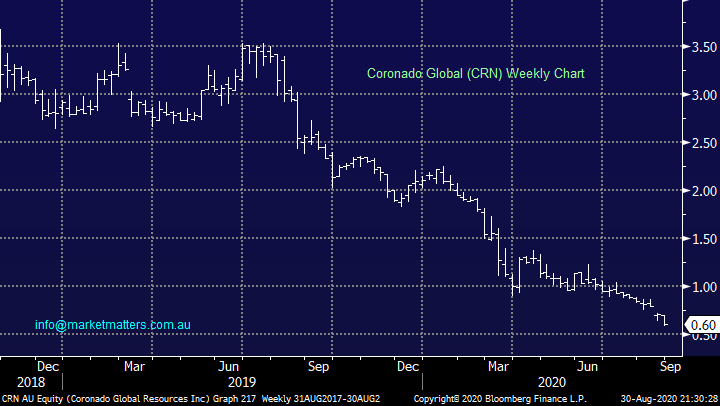
Coal has been a vehicle of wealth destruction over recent times, whether its CRN or Whitehaven Coal (WHC), with the huge tide of change towards ethical investing taking fossil fuels off the menu for massive pool of funds these stocks / sectors can easily get much cheaper. We have looked at WHC a few times this year because its so cheap but have avoided pressing the trigger for this underlying supply / demand reason. (i.e. the demand from investors is diminishing rapidly).
MM believes coal is in the too hard basket.
Coronado Global (CRN) Chart
Question 8
“Hi Market Matters Team Keep up the great work team - fantastic service and equity insights. Hoping you an assist with two stocks that I am considering 1) Cisco Systems and 2) People Infrastructure (PPE) I am interested in your view from a structural and stock specific perspective. Separately; I am treating 10% of my portfolio as higher risk opportunities and am interested in your top picks for potential '10 baggers'. Totally understand the associated risk and thus believe allocating 10% of my overall portfolio to a book of 6-8 stocks would be a worthwhile punt. Any assistance would be appreciated.” - Thanks again Gabriel C.
Hi Gabriel,
Please excuse the brevity with our answer in today’s long report:
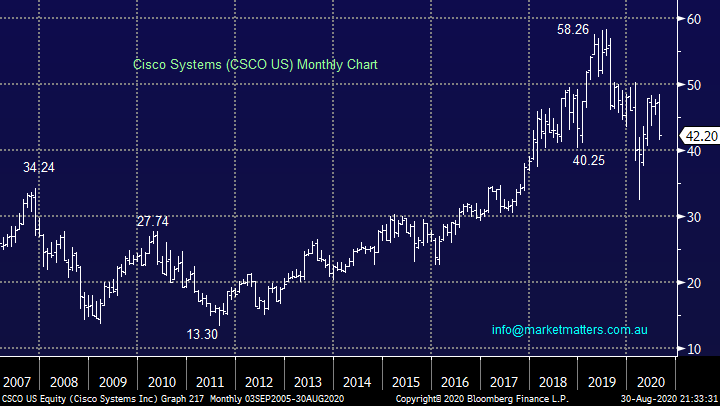
1 – Cisco Systems has struggled to transition its offering as the cloud computing boom has unfolded with its legacy business a clear drag on its latest 4th quarter earnings. This is currently not an exciting IT stock and time will tell if it can evolve as required.
MM is neutral / negative CSCO.
Cisco Systems (CSCO US) Chart
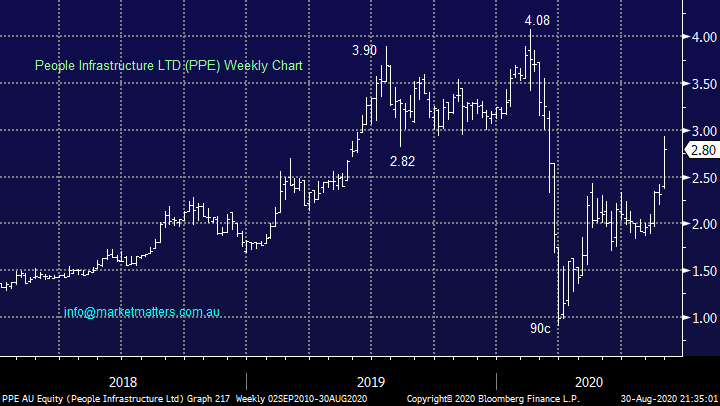
2 -People Infrastructure (PPE) provides a workforce management service, basically it’s a very successful $US250m staffing and human resource outsourcing business. Todays every changing workforce is playing nicely into the companies’ hands.
MM likes PPE which looks set to test $4 moving forward.
People Infrastructure (PPE) Chart
Lastly your question on “10 baggers” I like the 10% allocation towards more “aggressive stocks / positions” but I prefer the concept of being active and looking for a stocks that can rally 20-30% fairly quickly while being prepared to rotate as required. Stocks that rally by over 10x are few and far between but if I was to suggest a place to look it would be impossible to move past the mining & IT sectors, even after their stellar gains in 2020.
Question 9
“Hi James I see you are still bullish with ZIP what stops would you suggest at this point. What is your feelings on Cleanaway v's Bing” - Regards Kevin H.
Hi Kevin,
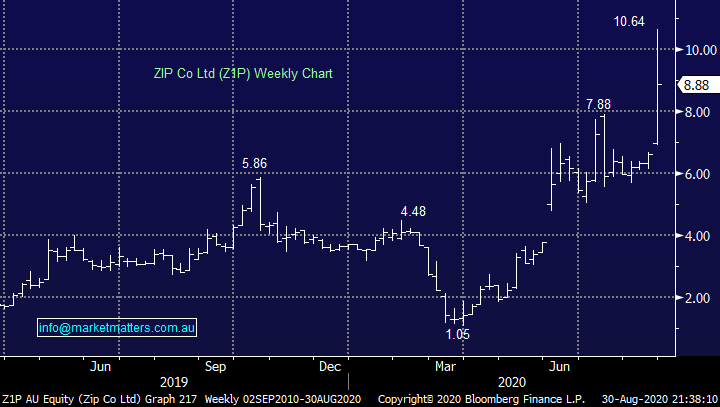
ZIP Co Ltd (Z1P) has surged but its clearly a volatile beast! Technical stops would need to be under $7.50 which is a significant ~25% below last week’s high but it’s the nature of these stocks. Ideally, we will now see a few weeks consolidation above ~$8.00 after its latest positive news before regaining its upside momentum. There is unlikely to be any further news flow out of this sector in the next month following Openpays (OPY) results this morning.
MM remains long and bullish Z1P.
ZIP Co Ltd (Z1P) Chart
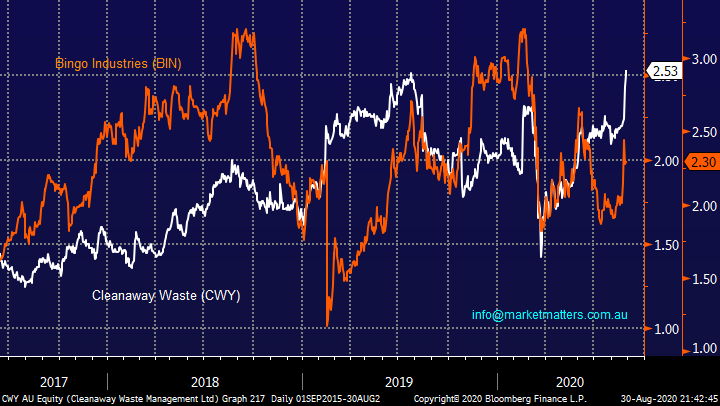
Cleanaway (CWY) v Bingo (BIN) is relationship we’ve looked at a few times and in hindsight MM should have been more active rotating between the two stocks. CWY is now breaking out to impressive fresh highs but we like the latest news from BIN and prefer them on a relative basis hence our exposure in the MM Growth Portfolio will remain with BIN.
MM is bullish both CWY and BIN.
Cleanaway (CWY) v Bingo (BIN) Chart
Question 10
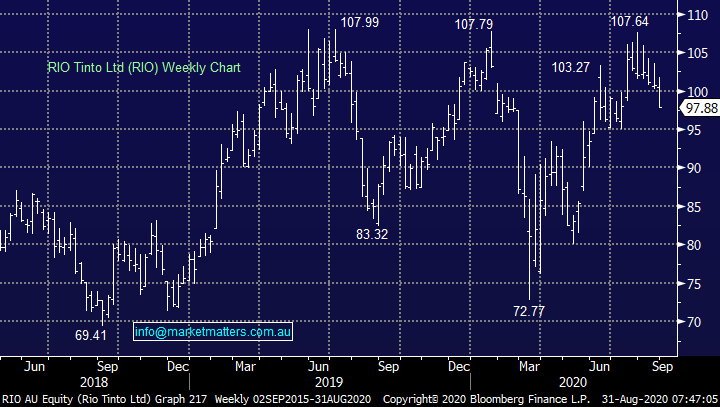
“Hi, Diversification can be good for a company’s economic viability. However, as China & other big economies are expected to grow significantly as the world comes out of COVID-19 with a knock-on effect to the demand for iron ore, would BHP & RIO be better value moving forward if their economic base was totally/almost totally iron ore?” – Peter P.
Hi Peter,
When we look at the respective rally from Fortescue (FMG) compared to BHP / RIO the answer is definitely so far in 2020 but markets are cyclical and arguably nothing more so than commodities. Over the years both Nickel and Aluminium for example have been particularly hot but today its iron ore, I prefer these goliaths being diversified due to the cyclical nature of resources, although RIO is more skewed to iron ore than BHP.
MM is bullish the reflation trade / resources.
RIO Tinto (RIO) Chart
Question 11
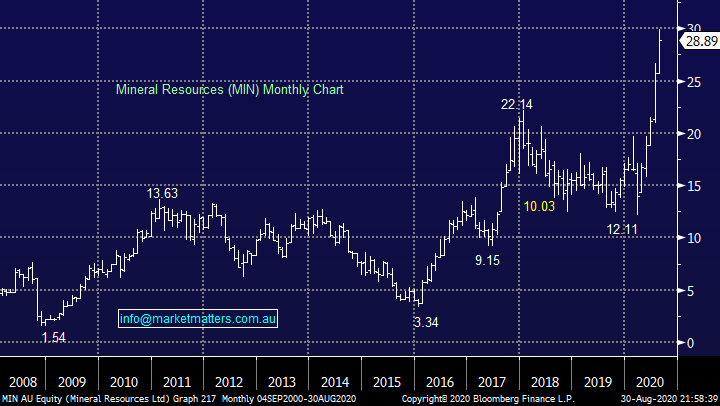
“A question for Mondays report. I hold MIN which has doubled since purchase & WHC which is down 75%. How do you, as a professional investor/adviser, decide when to take a profit/loss in situations such as this. In the past I have probably tended to take profits to early & hold the loss making stocks for too long in the hope they recover. Also what are your thoughts on these stocks at current levels (MIN around $30, WHC sub $1).” - Thanks Ian C.
Hi Ian,
A few parts of the holy grail to investing – “run your profits and cut your losses” will dominate successful investors manuals for years to come. We look to combine this with “why did we enter the position in the first place”, if the reason has gone, we shouldn’t be holding the stock. In the case of MIN and WHC they will undoubtedly experience a period of mean reversion but at this stage we believe its time to stick with the trends.
MM is bullish MIN & neutral/negative WHC.
Mineral Resources (MIN) Chart
Question 12
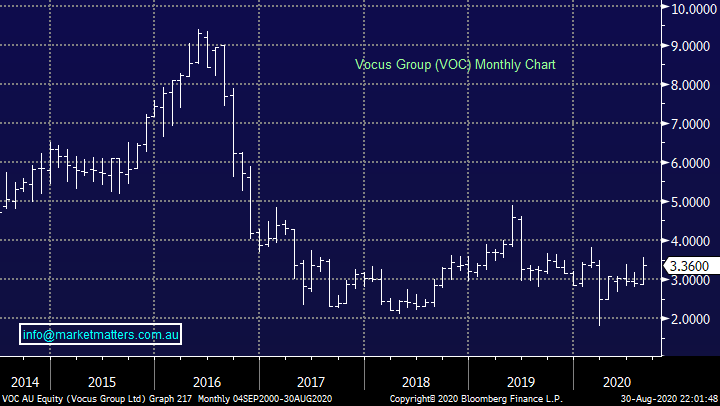
“Team, Many of your calls are at RSI PE 70 levels; e.g. VOCUS. Can you confirm what technical indicators you use to make recommendations? Do you follow BUY LOW stocks below intrinsic values?” - Let me know Tushar B.
Hi Tushar,
I’m not keen on Technical Indictors which you can “buy off the shelf” we use a number of varying subjective technical analysis methods combined with simple statistics e.g. the Distribution Theory. In the case of RSI’s it depends on the timeframe adopted, on a monthly basis VOC has only just started to rally, also be careful buying stocks below their intrinsic value, they’re usually there for a reason and often stay that way for a long time until the news eventually breaks that explains why they’re cheap.
MM is bullish VOC but will apply stops if needed.
Vocus Group (VOC) Chart
Question 13
“Hi James and team. With the recent speech from the Fed chair allowing inflation in the US to run a little hotter than before, does this have any direct impact on the 3 month swap rates that our Aust bank hybrid interest payments are tied to? I can see that the US 10 year yields seemed to have kicked up as a result, but not as obvious whether this will have any impact on Aussie short term rates.” - Many thanks Craig D.
Hi Craig,
Potentially down the track but the short answer is it hasn’t yet as the chart of the 90 day bank bill rate suggests. Remember, the RBA is currently involved in bond markets.
Australian 90 Day Bank Bills
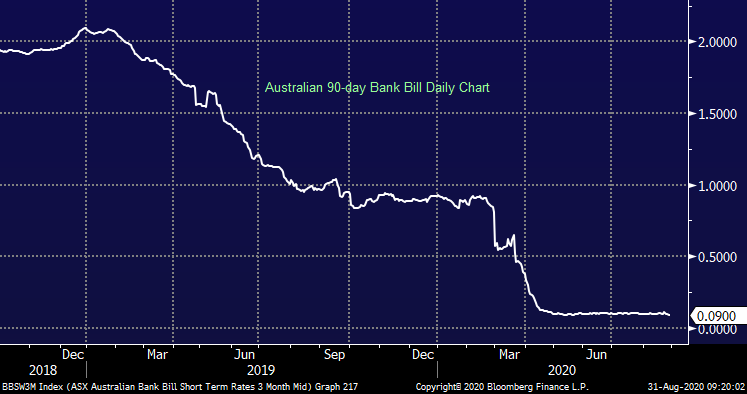
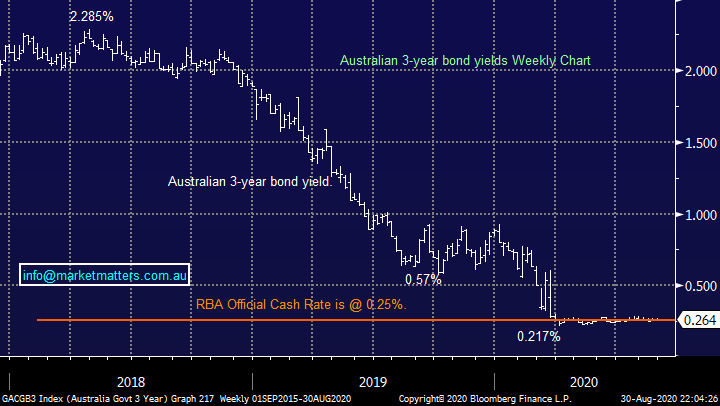
At some point in the future it should impact local short-term rates but as we can see below the important 3-year bonds are sending a clear message “lower for longer” with regard to interest rates / bond yields.
Australian 3-year Bond Yields Chart
Question 14
“Hi James, Wondering what your thoughts are behind your call that BPT will outperform WPL over the next 12-months or so? It’s contrary to the GS recommendation, but obviously you’ve got your reasons. Keen to understand your thinking if you don’t mind.” – Cheers Alan P.
Hi Alan,
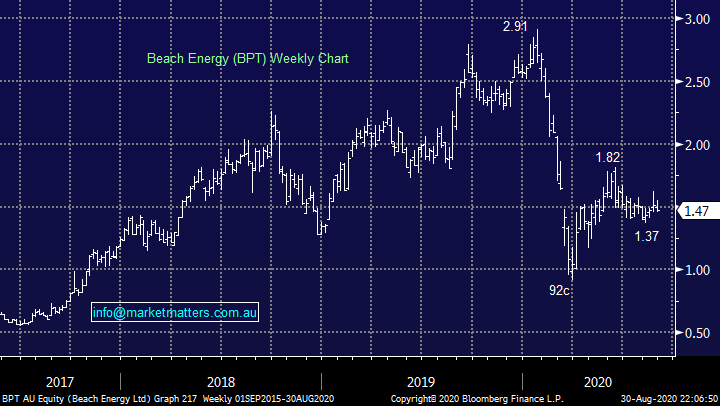
Beach Petroleum (BPT) is the cheaper of the two in our opinion while being more leveraged to an increase in oil and natural gas prices - reflation. Over the last 1 and 3-months BPT has outperformed WPL so we’re at least with the short-term trend compared to Goldman’s. In terms of ratings, I can’t see the GS analysts rating on Bloomberg for BPT, however they are one of the weaker analysts on WPL.
MM is bullish BPT.
Beach Petroleum (BPT) Chart
Question 15
“Hi MM team, I would appreciate your advice on - Genworth Mortgage GMA, I am currently sitting on a substantial 60% loss and am wondering if it’s a hold or sell ?. I also bought Western Areas WSA when MM added it and am down 16%. What are your updated thoughts on this stock?. You mentioned during the week that Appen APX could be a good buy under $35, Is this still the case?” - Regards Burge.
Hi Burge,
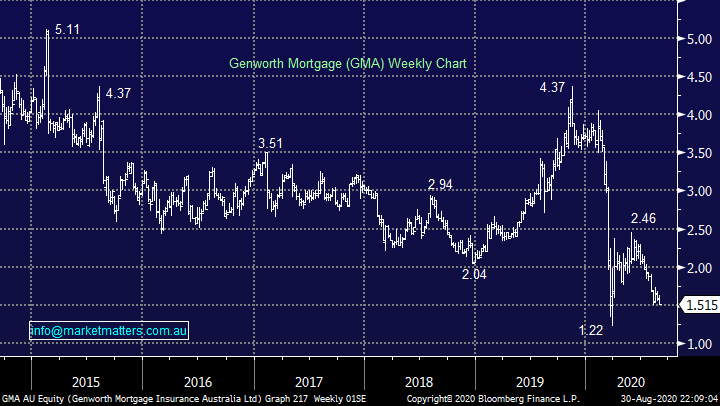
We’ve owned mortgage insurer GMA in the past, fortunately selling it at the end of January this year at $3.69 from the income portfolio, we know it well and also know how volatile it can be. We are interested in GMA at current levels especially as a lot of bad news is built into the share price re-housing however this is one where we like to use technicals as it drifts back towards its 2020 low, at this stage we are neutral and it actually looks 50-50 whether it finally breaks its $1.22 low.
MM is watching GMA.
Genworth Mortgage (GMA) Chart
Also, we still like WSA and the reflation trade but we’re holding back on APX because of its assumptions around FX.
Question 16
“Hi James and Team. Thanks for a very informative and relevant service. Where do you believe the best equity investing opportunities will be over the next 6 to 18 months, domestically or internationally? Put another way, is the Australian market more likely to outperform the S&P500?” - Thanks, Jan P.
Morning Jan,
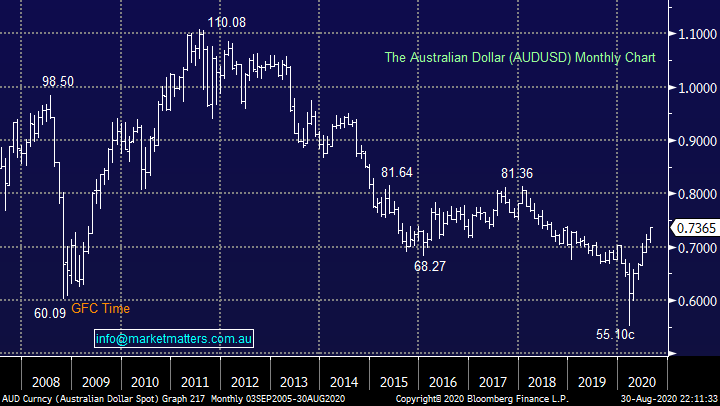
The key might be the $A which MM believes will rally at least another 10% hence if you buy unhedged US stocks this will become a clear headwind to relative performance – assuming we’re correct of course! If you’re talking pure index the next big issue is when will our banks regain their mojo and when will the US tech stocks take a breather, both trends are extended but there’s no sign’s they won’t continue at least for a while.
I would prefer to look at the global market as one big opportunity as opposed to separate groups hence a portfolio mix of US tech and Australian resources feels ideal until the financials wake up.
MM is bullish global equities into 2021.
Australian Dollar ($A) Chart
Have a great day & week!
James & the Market Matters Team
Disclosure
Market Matters may hold stocks mentioned in this report. Subscribers can view a full list of holdings on the website by clicking here. Positions are updated each Friday, or after the session when positions are traded.
Disclaimer
All figures contained from sources believed to be accurate. All prices stated are based on the last close price at the time of writing unless otherwise noted. Market Matters does not make any representation of warranty as to the accuracy of the figures or prices and disclaims any liability resulting from any inaccuracy.
Reports and other documents published on this website and email (‘Reports’) are authored by Market Matters and the reports represent the views of Market Matters. The Market Matters Report is based on technical analysis of companies, commodities and the market in general. Technical analysis focuses on interpreting charts and other data to determine what the market sentiment about a particular financial product is, or will be. Unlike fundamental analysis, it does not involve a detailed review of the company’s financial position.
The Reports contain general, as opposed to personal, advice. That means they are prepared for multiple distributions without consideration of your investment objectives, financial situation and needs (‘Personal Circumstances’). Accordingly, any advice given is not a recommendation that a particular course of action is suitable for you and the advice is therefore not to be acted on as investment advice. You must assess whether or not any advice is appropriate for your Personal Circumstances before making any investment decisions. You can either make this assessment yourself, or if you require a personal recommendation, you can seek the assistance of a financial advisor. Market Matters or its author(s) accepts no responsibility for any losses or damages resulting from decisions made from or because of information within this publication. Investing and trading in financial products are always risky, so you should do your own research before buying or selling a financial product.
The Reports are published by Market Matters in good faith based on the facts known to it at the time of their preparation and do not purport to contain all relevant information with respect to the financial products to which they relate. Although the Reports are based on information obtained from sources believed to be reliable, Market Matters does not make any representation or warranty that they are accurate, complete or up to date and Market Matters accepts no obligation to correct or update the information or opinions in the Reports. Market Matters may publish content sourced from external content providers.
If you rely on a Report, you do so at your own risk. Past performance is not an indication of future performance. Any projections are estimates only and may not be realised in the future. Except to the extent that liability under any law cannot be excluded, Market Matters disclaims liability for all loss or damage arising as a result of any opinion, advice, recommendation, representation or information expressly or impliedly published in or in relation to this report notwithstanding any error or omission including negligence.


