Subscribers questions (HVN, WOW, A2M, CGF, PDN, AOG)
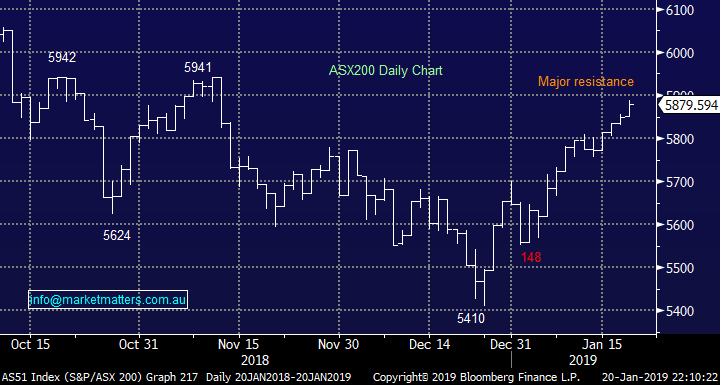
The ASX200 enjoyed yet another strong week and we’ve rapidly found ourselves well above December's high, and even close to challenging Novembers 5941 high – what a difference a few weeks makes! Following a strong Friday night on Wall Street as a US – China trade war resolution appears increasingly likely the SPI futures are targeting the local market to open around 5920, up around +0.8%, helped by BHP which is likely to open up ~40c.
The major story that caught my eye on the weekend was in the Financial Review where Morgan Stanley are predicting property falls could double original expectations. Markets are now marking a 50% chance of a rate cut by December, so much for all the concerns of interest rate hikes a year ago – another demonstration of how fluid / fickle markets have become.
MM remains in “ sell mode” but with a cash weighting now at 20% in our Growth Portfolio we are becoming fussy.
Thanks for the great questions as we already approach the end of January, while the kids are still on holiday 2019 is already in full swing.
ASX200 Chart
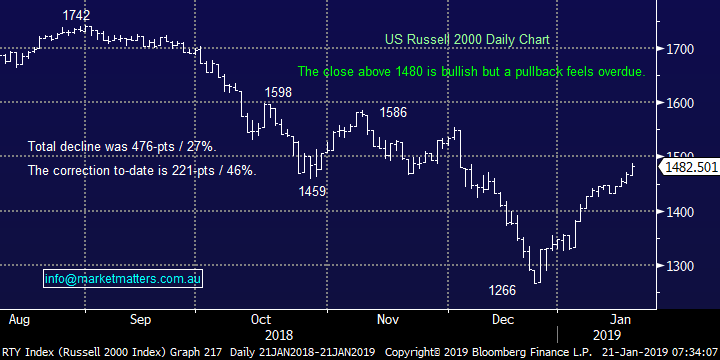
The small cap Russell 2000 has led both the 2018 decline in stocks and the subsequent rebound hence one index we are watching very closely. Takeout’s at this stage:
1 – Medium-term we see the current bounce reaching the 1575 area, or over 5% higher.
2 – Short-term we anticipate a correction to the strong rally since late December.
US Russell 2000 Index Chart
Question 1
“Hi James, thanks for your continued analyses which are a great tool for avoiding traps as well as identifying opportunities. You now seem very cautious re Retailers which I understand, but there is another potential “support” for some shares including HVN and that is the accumulated franking credits. If the opposition devalues these then companies like HVN may offer an attractive mechanism to release the value to investors before 1 July this year. Is that enough to be a reason to buy?” - Kind Regards, Peter H.
Hi Peter, Thanks for the kind words.
I certainly agree with you RE Harvey Norman and we’ve discussed this topic before in a couple of notes, one specifically on Harvey Norman back in August at the time of their result (click here) and more broadly around franking balances in an income report recently (click here). In the latter note, we talked about The Reject Shop (ASX:TRS) having the biggest franking balance however they also had a stretched balance sheet which made it hard for them to do anything. They’re now under takeover, presumably because of their large franking balance, however the takeover came after a big profit warning.
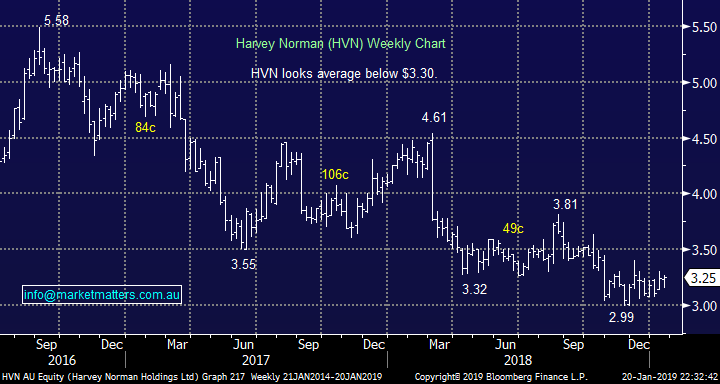
In terms of HVN, data from September 2018 showed they had A$509.5m in franking, or about 14% of their market cap. Gerry Harvey is highly unlikely to want to see that lose some of its value under Labor. At the time of their last result, HVN did a capital raising to pay down debt – or so they said. Their balance sheet was fine at the time so it seems to me (and others) that they raised the cash to potentially increase the dividend and pass on some additional franking credits. If you recall a while back, they used this same strategy, but more blatantly and it raised the eye of the ATO.
The theory certainly stacks up here however the business still needs to hold up and the share price stay well behaved for shareholders to really benefit. Retailers are scaring many due to current consumer debt levels in Australia and the downturn in housing but the Est P/E for 2019 of 10.45x is certainly building in a negative outlook, the obvious question being is it enough?
Technically we would be more bullish on HVN on one final foray below $3 which is easy to visualise in today’s environment where retailers are regarded as a no go zone to many – often an opportunity!
Harvey Norman (ASX: HVN) Chart
Question 2
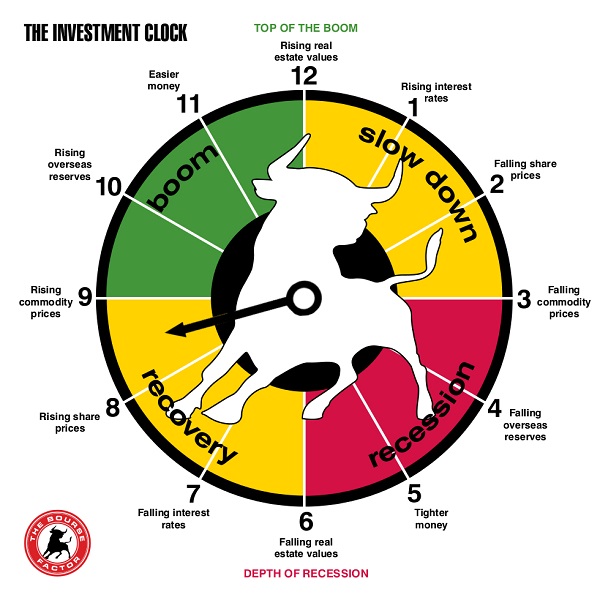
“Hi, I'm 88 and over my years, I 've worked on the time clock theory while investing the stock market and I believe this theory is relevant today. Top of boom 1 o'clock Rising Interest rates 2 Failing share prices 3. Falling commodity prices 4. Falling overseas reserves 5. Tighter money 6. Falling property values ARE WE HERE NOW with some suggesting Interest Rates will fall which brings us in the cycle to 8 o'clock. Rising Share prices then Rising Commodity Prices and Rising Overseas Reserves and so on until we get Easier Money and Rising Property Values at 12 o'clock. Maybe the Stock Market is telling us forget the Bears and dabble selectively which seems to be your thoughts for now” - Cheers Clive B.
Hi Clive,
Experience is an extremely powerful asset and you certainly have that box ticked, your ongoing enthusiasm for markets at 88 gives huge inspiration to myself and hopefully to many subscribers.
I have shown a visual example of the investment clock you discussed and I agree 100% if / when we can identify where we are on the clock investing is so much easier.
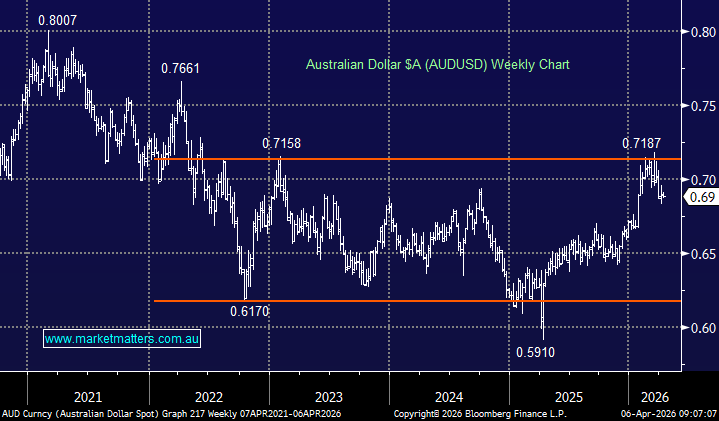
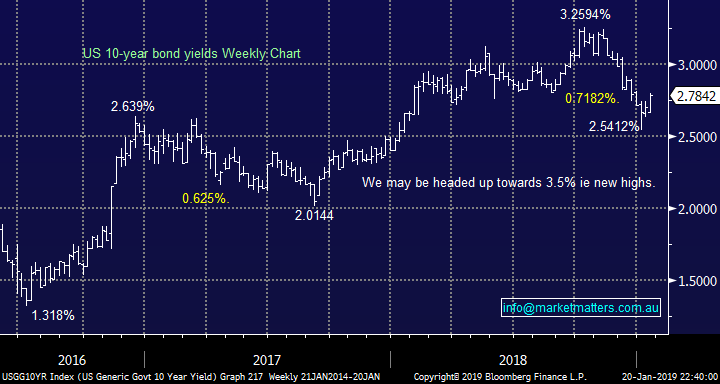
My dichotomy is the second chart below of US 10-year bond yields, they still look well positioned to rally, albeit at a slower pace than many expected this time last year. Conversely in Australia we efinitely face the possibility of interest rates falling although in our opinion for this to occur we would need to be moving into recession with housing looking the standout potential catalyst for this to unfold.
At this stage I feel jumping to 8 o’clock is premature, we have experienced no recession just a few weeks of heightened concern, hence I would plump for 2.30 o’clock but as we often say that’s what makes a market! This view is reinforced I believe when we consider the greater than 10-years it took for markets to recover from the GFC I don’t believe a few months pullback is it done and dusted.
The investment clock Chart
US 10-year bond yields Chart
Question 3
“HI MM team, I would just like to get your Technical Analysis on Woolworths (WOW) and A2 Milk (A2M). Also Challenger (CGF), on a monthly chart in regard to Elliott Wave, any thoughts much appreciated.” – Thanks Tim C.
Hi Tim,
See a quick summary of the 3 stocks below from a technical perspective.
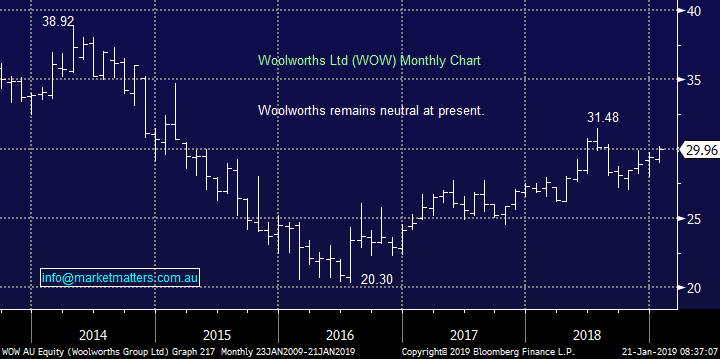
1 Woolworths (WOW) $29.96
Overall we are neutral WOW but my best guess is we see a test of $32 in 2019 which would represent a good selling area.
This ties in with our overall view on the ASX200 for a choppy recovery in Q1/Q2 prior to another downturn.
Woolworths (ASX: WOW) Chart
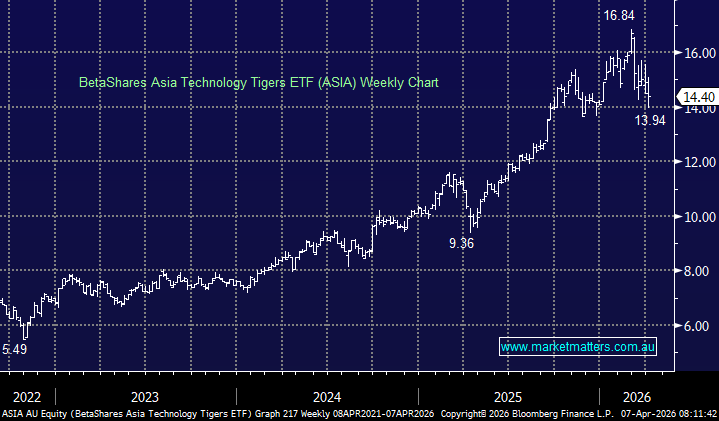
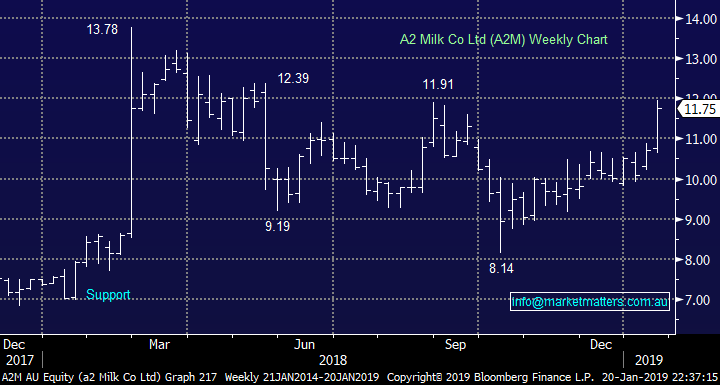
2 A2M Milk (A2M) $11.75
A2M has recovered strongly from its Q4 pullback and has now arrived at the strong $12 resistance.
On balance we are now bullish technically targeting over $14 but would use definitive stops below $10.40.
We note the P/E of A2M is now at 34x for 2019 earnings and if / when we see the next wave of anti-high valuation /growth A2M is unlikely to go unscathed hence it’s important to watch carefully in our opinion.
A2 Milk (ASX: A2M) Chart
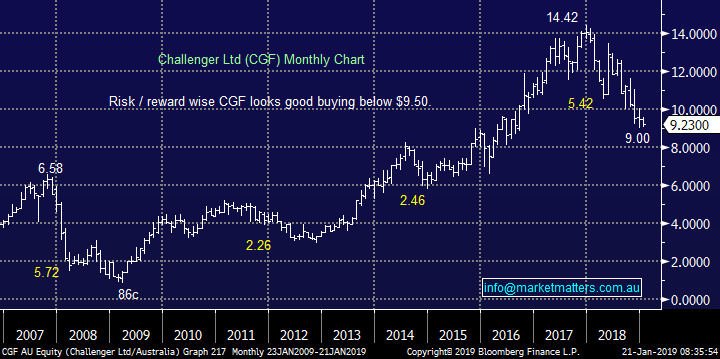
3 Challenger (CGF) $9.23
We hold CGF in our Growth Portfolio having bought the recent weakness but its unfortunately not been exciting of late, probably not being helped by the overall huge underperformance from the diversified financials, 8 of whom are down by more than 30% over the last 12-months.
We like the monthly pattern but now a dip back below $9 would not surprise, it’s not a position we are considering increasing at this stage.
Challenger Ltd (ASX: CGF) Chart
Question 4
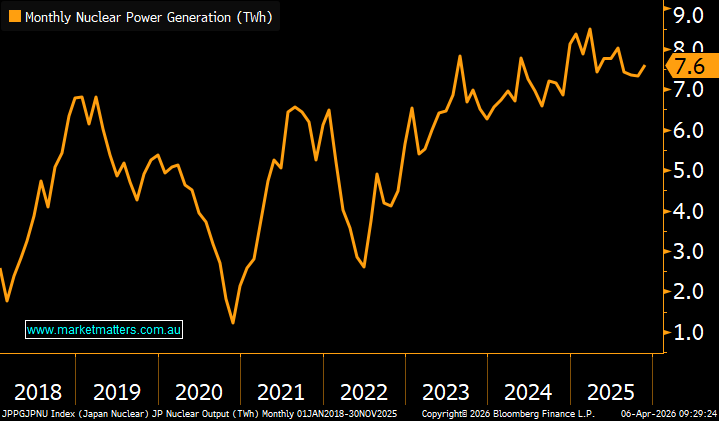
“Hi James, great note. Enjoyable read every Sunday. Question please for Mondays note, wondering if going into 2019, Market Matters has any view on Uranium & related ASX stocks? Uranium was the best performing Commodity in 2018 +42% (still 80% from peak) & Utilities need to enter the market in 2019, in what is a 40% net deficit market. Some funds like Maso Capital, Value Partners, and Paradice are long. Thoughts please?” – Rodney F.
Hi Rodney,
Thanks for the question and previous insight in to the sector. With China set to potentially install up to 400 nuclear reactors the demand for uranium could clearly be huge but when will this translate into profits for uranium stocks is the key question.
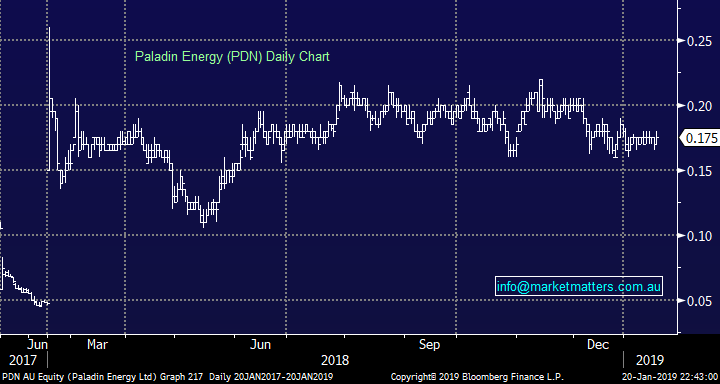
PDN was at $5 when the Fukushima disaster occurred in 2011 and a lot of money has been lost trying to pick the bottom of the uranium sector / PDN.
We can undoubtedly see some good risk / reward from PDN but we believe it’s one to invest / trade primarily using technical at this early stage.
We could be accumulators between 15 and 18c using a break of 14c as stop, alternatively jumping on board the next impulsive advance may be the best course of action for the nimble e.g. buy 24c (the breakout) with stops below 20c, it’s all about risk / reward at this more “speccy” end of town.
Paladin Energy (ASX: PDN) Chart
Question 5
“Hello James, can I please have your opinion on AVEO Code AOG? The stock is down -41.88% 1 yr return, dividend yield currently 5.70% unfranked.
“They are currently defending a class action in the Federal Court over allegations it has ripped off its residents. Since then they have brought in Bank of America Merrill Lynch to manage a process for potential capital partners for Aveo,
Either as a whole or in partnership. A data room was opened in November. Indicative bids are due late this month “ (Source AFR 16/01/2019)
All the bad news is in the current price? If successful, could add value to the current share price? The impending Royal Commission into aged care should not impact AOG as they do not provide care, just the real estate? Look forward to your comments on Monday 21 Jan 2019” - Thank you, Chris T.
Hi Chris,
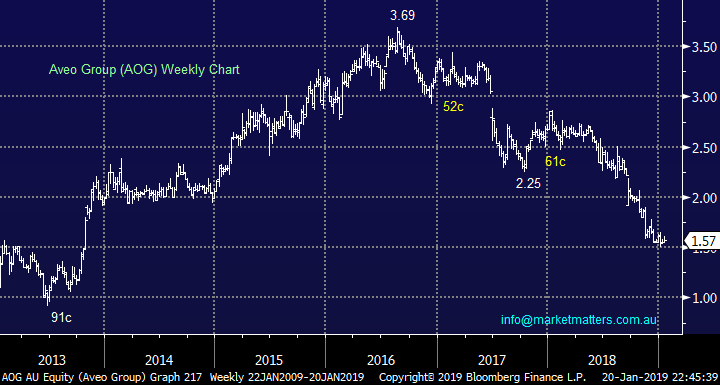
The stock is currently well and truly in the “naughty corner” with exposure to property development and retirement villages and as we often say don’t underestimate how far the pessimism elastic band can stretch. The market seems to have lost faith in management given it seems like management don’t have a handle on what earnings could/ will be in FYT19 – if they don’t, what chance do we have?
My “Gut Feel” at this stage is AOG will test $1 in 2019 / 2020 where value will likely present itself. The supporting yield could easily evaporate if the dividend was cut back to 2014 levels as trading conditions toughen as many expect.
Sorry but on balance I remain negative AOG.
Aveo Group (ASX: AOG) Chart
Overnight Market Matters Wrap
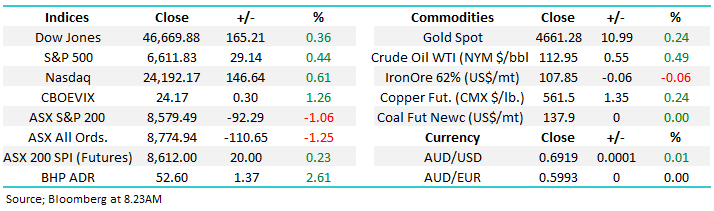
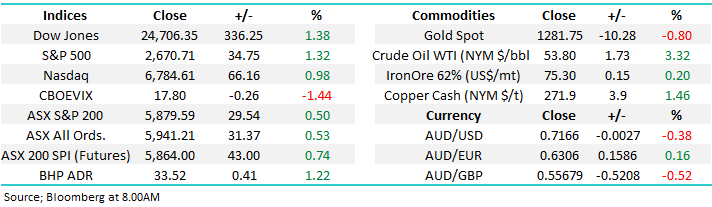
· The global markets all rallied soundly last Friday, following positive reports on the progress of US-China trade negotiations.
· All three key US indices powered higher on the unconfirmed reports that China had offered the US a six year deal in imports, which would wipe out the US-China trade imbalance by 2024. The Dow led the charge, adding 336 points (+1.38%), led by export stocks like Caterpillar and Boeing, with all three key indices closing out the 4th week in a row of gains, having now recovered about half their losses since the end of September.
· European markets also jumped strongly on the news, shaking off any concerns on Brexit talks as the UK exit deadline looms, with the German market leading the way, jumping 2.6%. Commodity markets likewise benefitted, with the Crude oil price rallying 3.32% to US$53.80/bbl, and Iron Ore +1.5% at US$75.7/tonne and copper likewise jumping 1.46% to US$271.9/t. Gold fell 0.8% to US$1282/oz., while the A$ is also slightly weaker this morning at US71.7c.
· All eyes on China today, with the release of 4th quarter GDP, which is expected to close out the year at an annualised rate of around 6.4%.
· The US markets are closed tonight for the Martin Luther King day.
· The March SPI Futures is indicating the ASX 200 to open 42 points higher, towards the 5920 level this morning.
Have a great day!
James & the Market Matters Team
Disclosure
Market Matters may hold stocks mentioned in this report. Subscribers can view a full list of holdings on the website by clicking here. Positions are updated each Friday, or after the session when positions are traded.
Disclaimer
All figures contained from sources believed to be accurate. Market Matters does not make any representation of warranty as to the accuracy of the figures and disclaims any liability resulting from any inaccuracy. Prices as at 21/01/2019
Reports and other documents published on this website and email (‘Reports’) are authored by Market Matters and the reports represent the views of Market Matters. The MarketMatters Report is based on technical analysis of companies, commodities and the market in general. Technical analysis focuses on interpreting charts and other data to determine what the market sentiment about a particular financial product is, or will be. Unlike fundamental analysis, it does not involve a detailed review of the company’s financial position.
The Reports contain general, as opposed to personal, advice. That means they are prepared for multiple distributions without consideration of your investment objectives, financial situation and needs (‘Personal Circumstances’). Accordingly, any advice given is not a recommendation that a particular course of action is suitable for you and the advice is therefore not to be acted on as investment advice. You must assess whether or not any advice is appropriate for your Personal Circumstances before making any investment decisions. You can either make this assessment yourself, or if you require a personal recommendation, you can seek the assistance of a financial advisor. Market Matters or its author(s) accepts no responsibility for any losses or damages resulting from decisions made from or because of information within this publication. Investing and trading in financial products are always risky, so you should do your own research before buying or selling a financial product.
The Reports are published by Market Matters in good faith based on the facts known to it at the time of their preparation and do not purport to contain all relevant information with respect to the financial products to which they relate. Although the Reports are based on information obtained from sources believed to be reliable, Market Matters does not make any representation or warranty that they are accurate, complete or up to date and Market Matters accepts no obligation to correct or update the information or opinions in the Reports. Market Matters may publish content sourced from external content providers.
If you rely on a Report, you do so at your own risk. Past performance is not an indication of future performance. Any projections are estimates only and may not be realised in the future. Except to the extent that liability under any law cannot be excluded, Market Matters disclaims liability for all loss or damage arising as a result of any opinion, advice, recommendation, representation or information expressly or impliedly published in or in relation to this report notwithstanding any error or omission including negligence.