Subscribers questions (HT8, GMV, CSL, PPT, MNRS, SPT, AGL, AMP)
LOCAL REPORTING CALENDAR: CLICK HERE **Please note, data sourced from Bloomberg, not all ASX companies are on this list and dates can vary**
Another big day or results, however I notice a number on the attached calendar are wrong / have been changed. In terms of our stocks, Z1P is listed to report today and they don’t, ditto for BVS while NWH reported last week.
FMG looks good, ditto for SUL and SSG this morning. NHF & SBM look a miss – no recording this AM, will include one this afternoon.
The ASX200 looks likely to dance a reporting season melody this week with over 50 companies reporting including major outperformers Fortescue Metals (FMG) and Afterpay (APT) who are up 68% & 169% respectively year to-date. Investors are looking for good news from both of these stars and its highly likely to get it with the question being will it be good enough? For MM’s Growth Portfolio it starts on Tuesday with Alumina (AWC) and Bingo (BIN) both reporting their earnings through the virus pandemic, Bravura Solution (BVS) & Reece (REH) are due out Wednesday & Costa Group (CGC) on Friday.
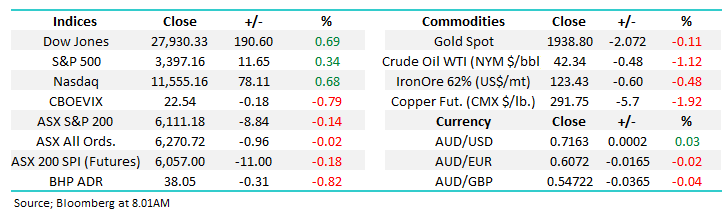
The SPI futures are pointing to a subdued start today with the IT sector likely to be firm while the resources are likely to take a backward step following strength on Friday night by the $US. On the COVID-19 front the news is fairly consistent:
1 – Victoria’s COVID-19 numbers continue to decline slowly but surely while NSW remains reassuringly contained but as we’re witnessing in a number places it just takes one careless mistake – South Korea is currently struggling badly with almost 400 cases reported on Sunday.
2 – The world has in excess of 23 million confirmed cases and over 800,000 deaths but equities continue to focus on stimulus and the future as opposed to the economic turmoil that is brewing.
3 – Germanys Angela Merkel is urging Europe not to close its borders as the 2nd wave picks up steam across the region, it feels like this time around the economy is going to be front and centre.
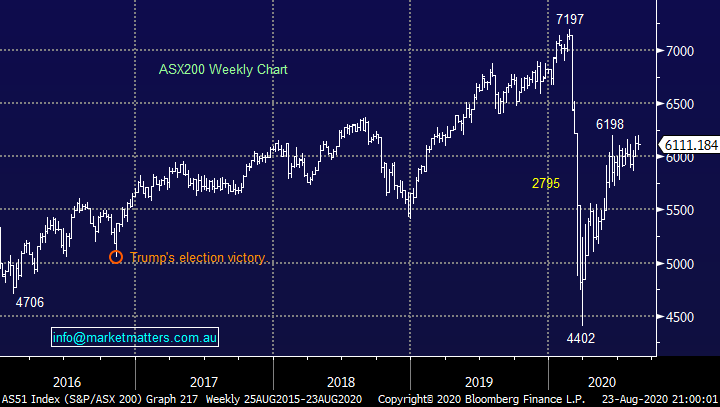
MM remains bullish Australian stocks medium-term.
ASX200 Index Chart
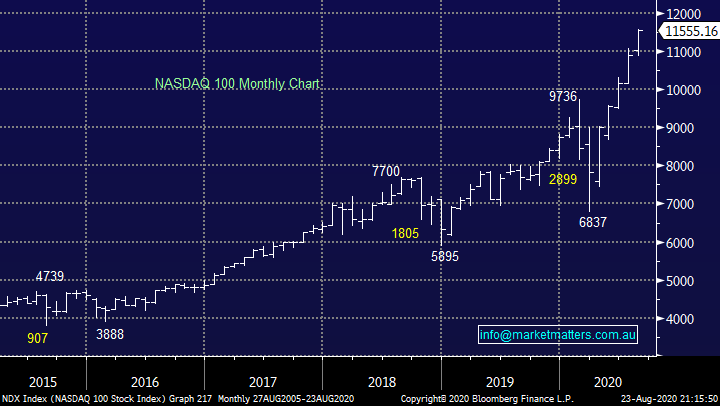
The tech-based US NASDAQ continues to charge ahead as the longer dated chart below illustrates perfectly. The worlds evolving at a rapid rate and while we might be overdue for a 10% correction this arguably remains a market in the early throws of its evolution – MM is a buyer of pullbacks in selected pockets of the tech stocks until further notice. In our opinion the next significant opportunity will most likely unfold when investors become concerned bond yields are set to rise.
MM remains bullish the Global tech Sector.
NASDAQ 100 Index Chart
Thanks again for a range of questions, as the volume increases, I might have to reconsider the time of my alarm clock – from our perspective an engaged subscriber base is one of our primary goals.
Question 1
“I am a recently joined member, so I am not sure if this is the right forum to raise bonds. With high yield corporate bonds now available to mum and dad investors, would this be an appropriate investment to directly hold in one's portfolio? If you can hold bonds earning 5% to maturity is this not a good alternative to holding shares that like present are not paying any or low dividends?” – Sandy B.
Welcome on board Sandy!
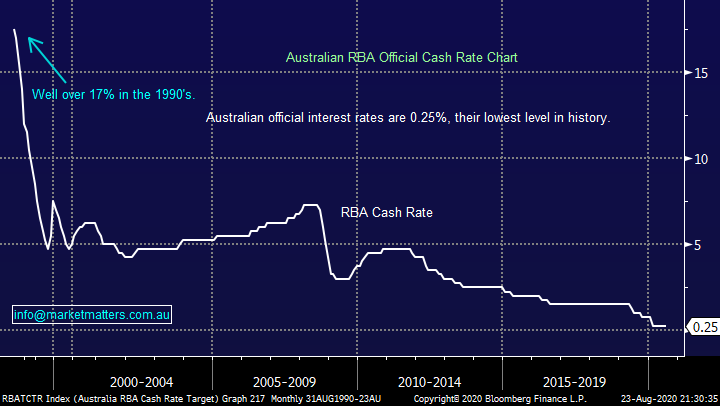
The search for yield becomes tougher by the day as official interest rates look likely to be lower for longer, not great news for term deposits. Hence “high yield corporate bonds” are becoming more readily available to retail investors but we must caution with a higher potential return comes increased risk. A corporate bond in todays environment offering 5% is at the higher risk end of the spectrum. We have holdings in Hybrids and some bond funds in the MM Income Portfolio – click here. Hybrids are not bonds; however they do have fixed income characteristics, with bank hybrids offering a grossed up yield around 4%. As a guide, below is a list of the highest yielding notes on the ASX. We hold in the AMPPB in our Income Portfolio.
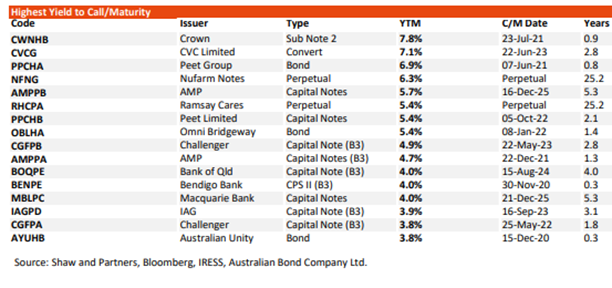
We are happy to consider such vehicles as part of an Income Portfolio, amongst say hybrids and traditional equities, but we would definitely be looking to spread the risk and each individual investment should be assessed on its own merits paying particular attention to the balance sheet of the underlying company and where that specific debt instrument sits in the capital structure.
MM is open-minded to high yield corporate bonds.
The Australian RBA Official Cash Rate Chart.
Question 2
“Hi guys, thanks for all your work I was just wondering what your views on HT8 are? They have had a stellar performance since their announcement in July about their involvement with Amazon Australia, increasing over 1000% in the past 6 months. Additionally, morning star gave them a rating of fairly value at 13c. They recently announced a SPP at 8c to existing shareholders with a minimum buy in of 5k. What are your views on this? Do you see a bright future for this company? and do you have any concerns with this company?” - Cheers Nick S.
Morning Nick,
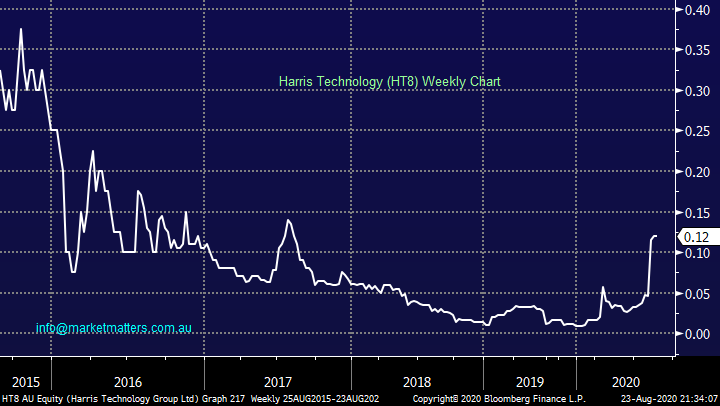
For those unfamiliar with Victorian based HT8 it operates as an online seller of technology goods – I actually use them to buy tech gadgets. Its small, with a current market cap. of $28m, however it’s very much in the right area at the right time. Growth recently has been strong, with revenue jumping to $9.9m in the 6 months to June 20 versus $4.1m for the full year ending Dec 19 i.e. big step up in top line sales. In July they were ranked as a top marketplace on Amazon Australia by an independent US research firm and this put a rocket under the share price. Because of this growth in sales, they are raising capital to increase inventories with the raise price of 8c, obviously an attractive entry v Fridays close of 12c.
This is an interesting ‘speccy’ that looks well positioned towards the WFH thematic, our concern is that the increase in revenue is a short term thing rather than something more sustained, however if they can maintain anywhere near these current growth rates, a capitalisation of 28m which prove way too cheap.
This is not one for us but if you can buy stock at a 30% discount to todays price the risk / reward is certainly skewed in your favour, at least short-term.
MM is neutral HT8.
Harris Technology Group Ltd (HT8) Chart
Question 3
“Good morning James and Team. A question for Monday perhaps. It has always baffled me why we see such spreads between buyers and sellers in some stocks prior to the open, with some sell and buy orders well above or below the last traded price. It seems that these orders then get pulled prior to the market opening as they do not appear to be traded and reflected in the daily high or low of the day? The attached is an extract of Newcrest market depth 19 August at 8.44am, highlighting this exact issue, closing price of NCM on 18 August was $34.71. It does not make sense to me that sellers would be placing orders to sell well below the last traded price and visa vera buyers well above last traded price - or this just what makes a market?” - Thanks Grant L.
Morning Grant,
An interesting question that I can imagine has crossed many investors’ minds over the years. You’re referring to the match which comprises of a number of different orders some of which do indeed move into the open, 4 examples of which are listed below:
1 – Bids / offers at a specific price, market on open and of course best endeavours – these should not move significantly.
2 – Bids / offers that are a derivative of where the SPI futures are trading which can lead to arbitrage in both directions, these move with the SPI which commences trading at 9.50am.
3 - Bids / offers that are a derivative of where bids and offers have been placed in the options market before it indeed opens, these will by indicated by market makers, again these move as the orders do in the options market.
4 - Bids / offers that are a derivative of where influential markets are trading, in the case of Newcrest (NCM) obviously gold e.g. if the precious metals is falling fast traders will become sellers at decreasing levels.
My strong advice would be focus on what your trying to achieve which is likely to be in category number 1 above and don’t worry about the numerous erroneous looking bids / offers.
Question 4
“Hi James and Team, I have been caught up in the G Medical Innovations GMV ASX delisting and Nasdaq listing proposal. This has caused a significant sell down but the directors believe this will be beneficial to shareholders when the change takes place. They are telling shareholders that there has to be a period of delisting before this takes place but what they are not saying is how our shareholdings will translate into shares on the new listing. Can you give me your thoughts on this proposal? I am not particularly keen to hold shares on a foreign exchange.” - Thank you, John H.
Morning John,
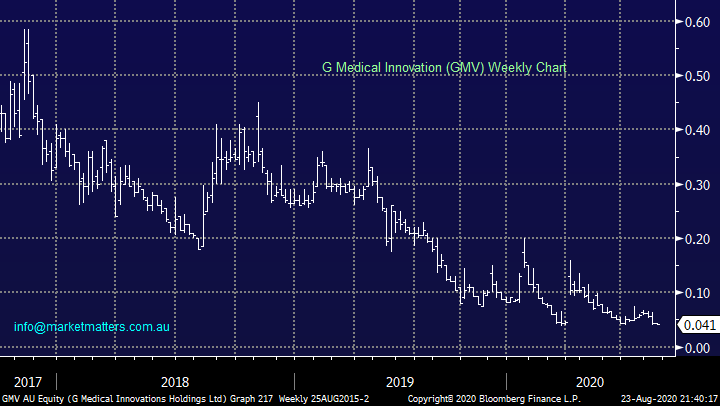
I can understand your frustration as your investment goal-posts have been moved. In my experience, most stocks that are moved from the ASX to an overseas exchange end up costing shareholders money – Linc Energy springs to mind.
While I am not familiar with this mobile health technology business which uses smartphones to become a medical monitoring device, they talk about a period of the stock being unlisted during the transition, my concern would be that it never makes it onto the US exchange. The shares have endured a shocking few year and at this stage I see no reason to buy them either here, or in the US - all too hard.
MM has no interest in GMV.
G Medical Innovation (GMV) Chart
Question 5
“A short while ago you wrote a note on all the 4 major banks listing preferences. I have searched recent reports but cannot find it, even using your search function. Maybe it was a throwaway line, but I am interested in your comment. I note you have all 4 except ANZ in the growth. I have all four plus MGQ which I'm happy to hold long term. I am not happy to be so loaded with the big 4 and can’t see much medium term relief so looking to unload somewhat over the short term. If you can’t remember, no problem.” - Thanks, Ian B.
Morning Ian,
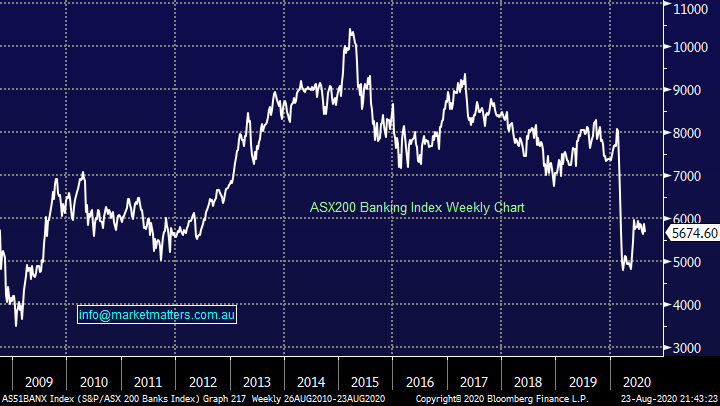
The banks have been tough of late as interest rates fall and bad debts threaten to increase, obviously a bad combination. It sounds like you have a similar holding to ourselves, our order of preference for the “Big Four Banks” is: Commonwealth Bank (CBA), National Australia Bank (NAB), Westpac (WBC) and lastly ANZ Bank (ANZ).
MM likes the banks medium-term.
ASX200 Banking Index Chart
Question 6
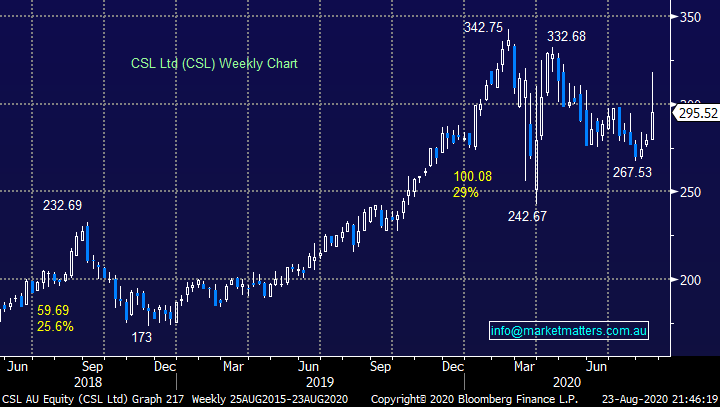
“Hi James, with the following dividend dates for CSL, Ex-Date Thursday, September 10, 2020 and Record Date Friday, September 11, 2020: 1) when is the last date I can sell the shares & still receive the dividend? 2) Is the cum dividend date one day before the ex-dividend date?” - Thanks, Sidney H.
Morning Sidney,
CSL trades ex-dividend $US1.07 unfranked on the 10th of September, with regard to your 2 specific questions:
1 – The last date you must be holding the stock to receive the dividend is indeed the ex-date, in the case of CSL the 10th of next month. You can sell on that day and still receive the dividend.
2 – A stock is cum-dividend after an official payout and date has been declared by the company but its hasn’t yet been paid e.g. today! By definition the day before a stock trades ex-dividend it is indeed cum-dividend.
MM remains neutral CSL.
CSL Ltd (CSL) Chart
Question 7
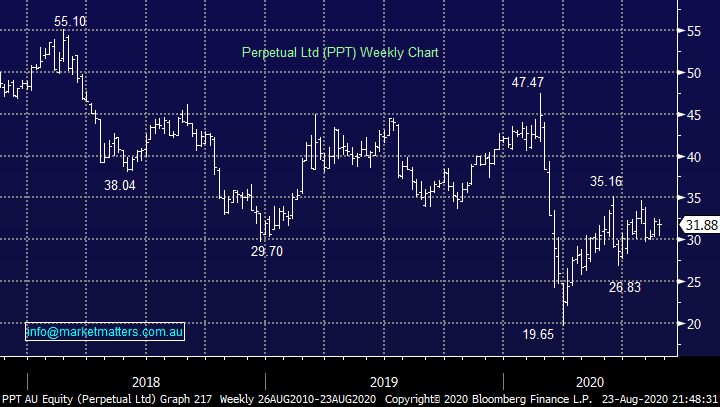
“Hi James & Team. Good evening. PPT has just launched the SPP and is closing mid next week. I am currently holding PPT shares. Please provide your views on the SPP if worth consideration.” -Thanks and regards, Manjit S.
Hi Manjit,
PPT is raising capital to buy a 75% stake in US asset manager Barrow Hanley for $US465. The share purchase plan (SPP) allows investors in PPT to apply for $30,000 of shares at $30.30 or a 2% discount to VWAP up until the 26th of this month. In other words, the entitlement is ~5% discount to today’s price. MM likes the offer and will indeed be taking it up with our position in our Income Portfolio.
The SPP closes on the 26th August.
MM likes Perpetuals (PPT) share purchase plan (SPP).
Perpetual Ltd (PPT) Chart
Question 8
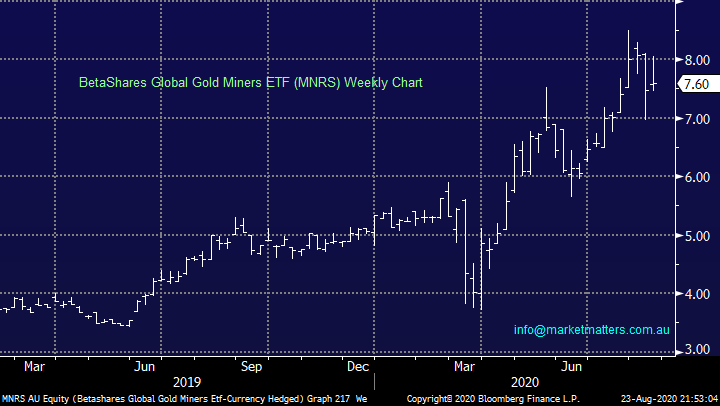
“Hi MM, I’m finding your advice invaluable thank you. What do you think of CXO and LKE as “speccy” plays? Also I’m finding MNRS much more resilient than NCM. Should I get out of NCM and put the funds into more MNRS?” - Cheers, Jill C.
Hi Jill,
Thanks for the great feedback!
1 Core Lithium Ltd (CXO) 4.4c: a very aggressive play in this already volatile space, if we were to punt we would use a 10% stop but not for us.
2 – Lake Resources (LKE) 3.5c: another very aggressive play in the volatile lithium space, if we were to punt we would use a 15% stop on this one but not for us.
The BetaShares MNRS ETF has outperformed Newcrest Mining (NCM) for 2 primary reasons:
1 – Newcrest (NCM) delivered a slightly disappointing result this month, dare I say yet again!
2 – The MNRS gold miners ETF tracks the gold miners traded on the NASDAQ ex-Australia stocks, its currency hedged hence it’s not facing the headwind of an appreciating rising $A.
Moving forward we like both vehicles and if / when we increase our gold exposure its unlikely to be via more NCM, hence MNRS is on the menu.
MM remains bullish the gold sector.
BetaShares Global Gold Miners ETF (MNRS) Chart
Question 9
“Thanks James, I’ve been an investor for many years but have found since my attitude has changed since retiring like many people have before me. It’s relying on ones now finite level of investment capital that focuses the mind on not making costly mistakes. Yes, we have had a very volatile year with markets drops and surges. The drop in March shook me and I did think bugger not again and wondered if I would live long enough to see the losses recouped. I do find it great how you are so highly convicted in your stock buys that you keep holding even when they are well underwater (and it’s a long list). Can you explain how to become so convicted in a stock and what makes you decide enough is enough and it’s time to sell it. It’s all very well to turn down the noise but it’s not easy to do. I guess it comes back to that initial commitment thesis before one buys. So I guess I’m saying I’m a bit paralysed at present but fortune favours the bold. Normally I would roll the dice and go all in and be buggered but the cost of being wrong in the present market is very high. Just asking for your thoughts on getting an investment thesis that will do the job for the long term. Is it possible?” - Cheers Marvin C
Hi Marvin,
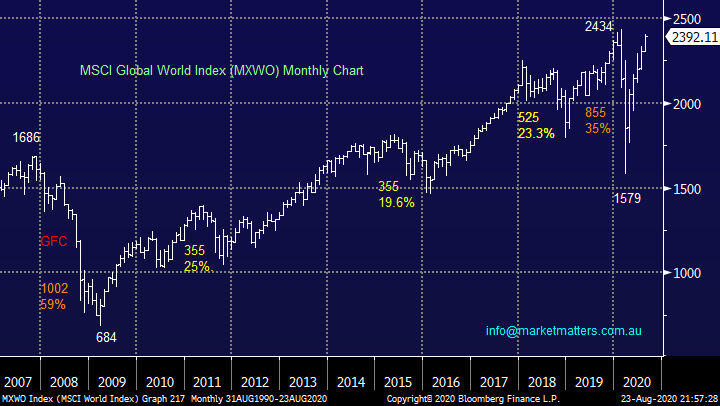
Some very understandable emotions / feelings in a period that’s arguably only been challenged by the ’87 crash in terms of immediate pain to investors both in their pocket and psychologically, the GFC actually took more than a year to unfold making it a very different style of decline albeit it clearly savage. The question we ask ourselves is does our underlying thesis / reason for our position or investment remain in play, if this is so relax and stay put, remember you are invested in the best vehicle long term assuming of course you can handle the short-term financial and psychological swings.
In our case we believe this liquidity driven rally will continue in global equities with the cream rising to the top as it always does. However when we see the Fed & Co start to take their foot off the stimulus peddle don’t be surprised to see us move rapidly to a substantial cash holding but that still feels many months / years away at this stage.
MM remains bullish equities over the next 12-18 months.
MSCI Global World Index Chart
Question 10
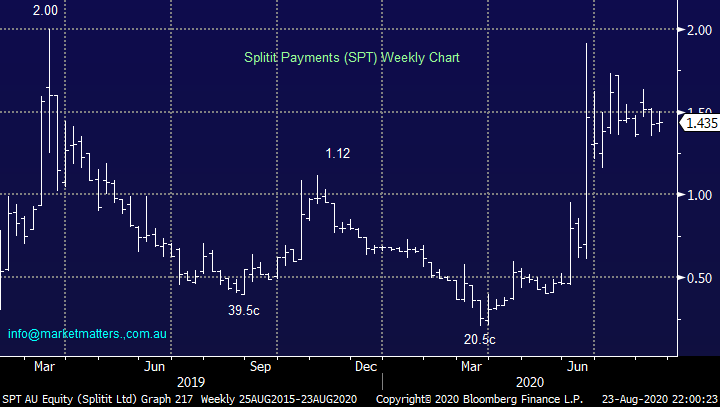
“Hi James, Splitit Payments (SPT) is raising money via the issue of new shares at $1.30. Do you have a view on whether investors should take part in this?” - Regards Bernie M.
Hi Bernie,
The BNPL (buy now pay later) space is undoubtedly both hot and volatile at present but we believe it has further legs, although our current adage of “sell strength and buy weakness” is feeling ever more appropriate. Hence, we like the opportunity to buy SPT ~9.5% below the market although investors need to cognisant that Afterpays result later in the week is likely to increase volatility still further in the whole space.
MM likes SPT at $1.30.
Splitit Payments (SPT) Chart
Question 11
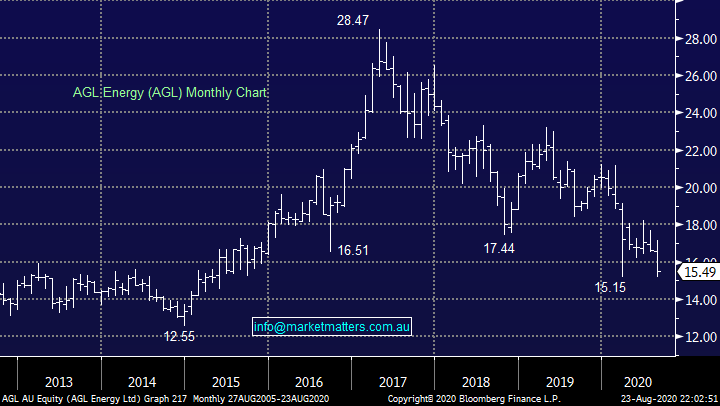
“Hey James and Team. Thanks for another informative week. I particularly liked your commentary on the " cloud stocks ". I'm emailing about a totally different stock - AGL. I have held it for many years and have liked it defensive characteristics / yield /reliability. However, I now consider it in structural decline with the electricity price cycle at a low and will take a long time to recover. Most brokers have reduced their fair value. I am thinking of selling as there are better opportunities elsewhere. I would appreciate your thoughts - I understand general advice only.” – David P.
Hi David,
Thanks for pre-empting my General Advice only line. The company does still look set to yield strongly moving forward but when capital is being whittled away so consistently it sounds and feels like a classic “yield trap”. Not one for us as they enter a very tough year as suggested at their recent results.
MM has no interest in AGL.
AGL Energy (AGL) Chart
Question 12
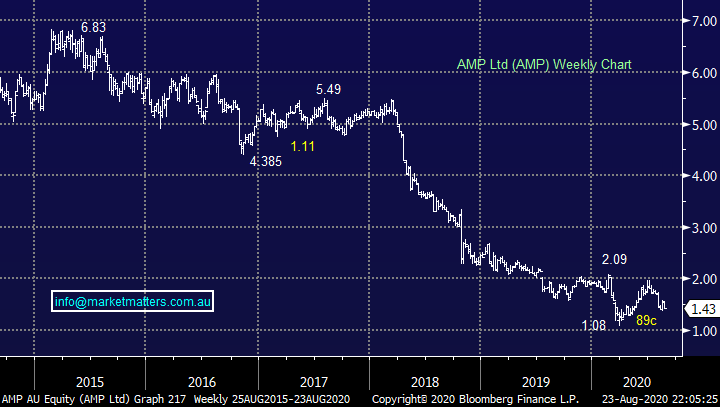
“Hi , I have recently been looking at AMP. Just wondering what your thoughts on AMP’s progress since the Hayne Royal Commission are and more recently the situation within the Executive Team. Is De Ferrari doing a good job?” - Thanks Richard M.
Hi Richard,
AMP certainly has room for improvement at an operational level, but they clearly have cultural problems as well which De Ferarri is responsible for. I think it’s hard to see how they can quickly turn this tanker of underperformance around, unfortunately management have destroyed confidence in this household name. I’m confident we will see another 50% bounce in the next year but from what level and the problem is we have little confidence in the current business to hold on if it starts to spiral downwards – all too hard for us!
**Interestingly, some changes announced today at the top**
MM is neutral AMP at current levels.
AMP Ltd (AMP) Chart
Have a great day & week!
James & the Market Matters Team
Disclosure
Market Matters may hold stocks mentioned in this report. Subscribers can view a full list of holdings on the website by clicking here. Positions are updated each Friday, or after the session when positions are traded.
Disclaimer
All figures contained from sources believed to be accurate. All prices stated are based on the last close price at the time of writing unless otherwise noted. Market Matters does not make any representation of warranty as to the accuracy of the figures or prices and disclaims any liability resulting from any inaccuracy.
Reports and other documents published on this website and email (‘Reports’) are authored by Market Matters and the reports represent the views of Market Matters. The Market Matters Report is based on technical analysis of companies, commodities and the market in general. Technical analysis focuses on interpreting charts and other data to determine what the market sentiment about a particular financial product is, or will be. Unlike fundamental analysis, it does not involve a detailed review of the company’s financial position.
The Reports contain general, as opposed to personal, advice. That means they are prepared for multiple distributions without consideration of your investment objectives, financial situation and needs (‘Personal Circumstances’). Accordingly, any advice given is not a recommendation that a particular course of action is suitable for you and the advice is therefore not to be acted on as investment advice. You must assess whether or not any advice is appropriate for your Personal Circumstances before making any investment decisions. You can either make this assessment yourself, or if you require a personal recommendation, you can seek the assistance of a financial advisor. Market Matters or its author(s) accepts no responsibility for any losses or damages resulting from decisions made from or because of information within this publication. Investing and trading in financial products are always risky, so you should do your own research before buying or selling a financial product.
The Reports are published by Market Matters in good faith based on the facts known to it at the time of their preparation and do not purport to contain all relevant information with respect to the financial products to which they relate. Although the Reports are based on information obtained from sources believed to be reliable, Market Matters does not make any representation or warranty that they are accurate, complete or up to date and Market Matters accepts no obligation to correct or update the information or opinions in the Reports. Market Matters may publish content sourced from external content providers.
If you rely on a Report, you do so at your own risk. Past performance is not an indication of future performance. Any projections are estimates only and may not be realised in the future. Except to the extent that liability under any law cannot be excluded, Market Matters disclaims liability for all loss or damage arising as a result of any opinion, advice, recommendation, representation or information expressly or impliedly published in or in relation to this report notwithstanding any error or omission including negligence.


