Subscribers Questions (HSO, ALU, APX, BBOZ, KDR, ORE, AMP)
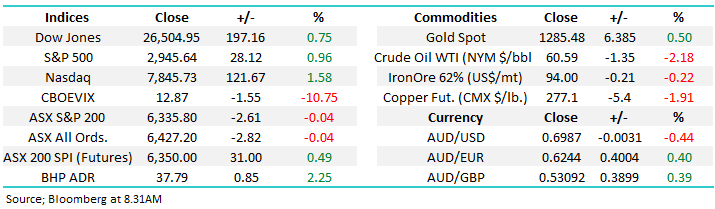
The SPI futures were calling the ASX200 to open up ~0.5% this morning following another strong performance on Wall Street who reacted positively to the US unemployment rate fall to its lowest level in 50-years on Friday while wages growth remained weak. Conversely with BHP falling over 30c in the US it appears the resources are going to maintain their recent weak tone – good news for MM as we are looking to buy the sector a few percent lower. The RBA’s decision on interest rates on Tuesday is the likely pivotal news for stocks this week, our “Gut Feel” is the will surprise the market and cut rates but it’s a close call in MM’s opinion.
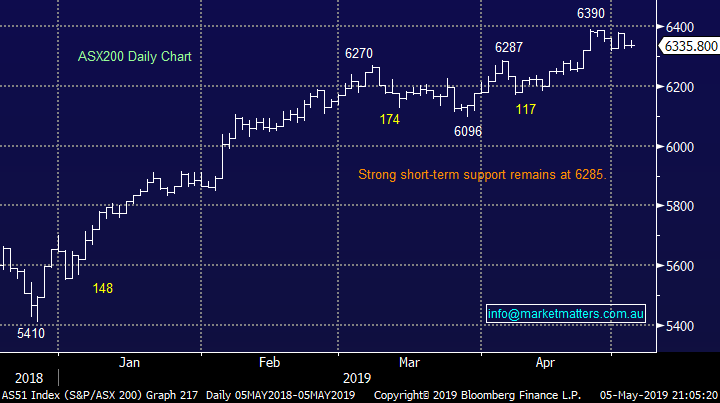
The almost constantly discussed housing market threw up some good news on the weekend with auction clearance rates noticeably improving even as listings rose after the Easter holidays. This is encouraging for the Australian economy because its occurred even while buyers appear to remain nervous around the Federal Election in 2-weeks’ time – at MM we feel investors in all markets should assume Labor will win and move on with life, it’s tough for many we fully understand but the chart of the ASX200 below illustrates that stocks are not concerned by Bill Shorten and his proposed policies.
However Donald Trump has thrown a huge curve ball at global equities this morning by announcing $US500bn in new tariffs on Chinese goods because the Asian giant is moving slower than he would like in the US-China trade negotiations, this move is likely to send shudders, if not shockwaves, through financial markets until at least his next tweet! The $A has already reacted negatively to the news falling -0.6% to break well under the 70c level.
The US S&P500 futures are down 1.5% this morning courtesy of Trumps tweet, expect some large volatility early today!
We have now shifted our short-term neutral stance to a more positive one which still feels a touch nervy as we enter the infamous “May period” a break back below 6270 would negate this opinion from a technical perspective – not far away especially following Trumps fresh announcement.
MM remains in “ buy mode” primarily due to our decent size cash position.
Thanks as always for the excellent questions, a few of which showed us there’s nothing like some corporate action to get investors fired up!
ASX200 Index Chart
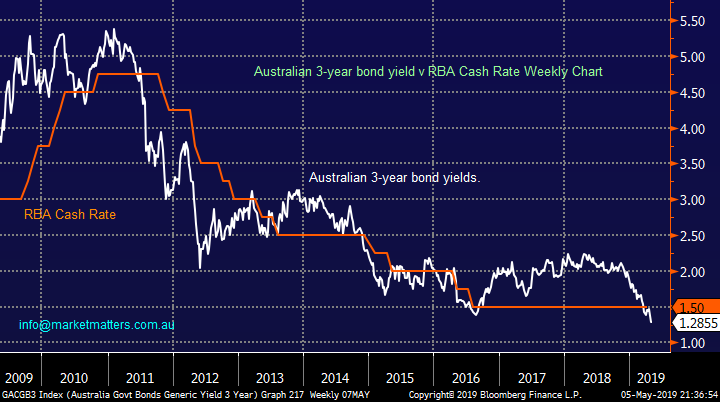
The combination of the slightly better Australian property market, uncertainty on US-China trade and the Federal Election later this month on the 18th (don’t forget to vote!) makes it a tough call for the RBA tomorrow – however, we think given the weak inflation print, they will cut rates tomorrow.
However, whatever the case this month, our view is that the RBA will cut rates at least once in 2019 which is the consensus opinion. The impact on housing of such rate cuts is a tougher call – our best guess remains prices are approaching a plateau but we cannot see any catalyst for the style of recovery such as we’ve witnessed by stocks.
MM feels “lower for longer” will be the phrase which covers both interest rates and property prices.
Australian 3-year bond yield v RBA targeted Cash Rate Chart
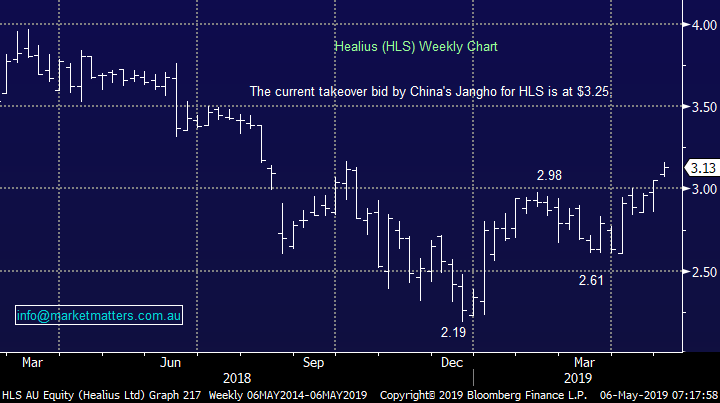
Over the weekend the press have been talking about a number of major private equity players looking at Healius (HLS) which is already under a takeover offer from China’s Jangho at $3.25 e.g. Bloomberg are saying TPG Capital, KKR, Bain and BGH Capital are all in informal talks about the business.
MM is comfortable with or position in the MM Growth Portfolio and at this stage happy to watch how things play out.
Healius (HSO) Chart
Question 1
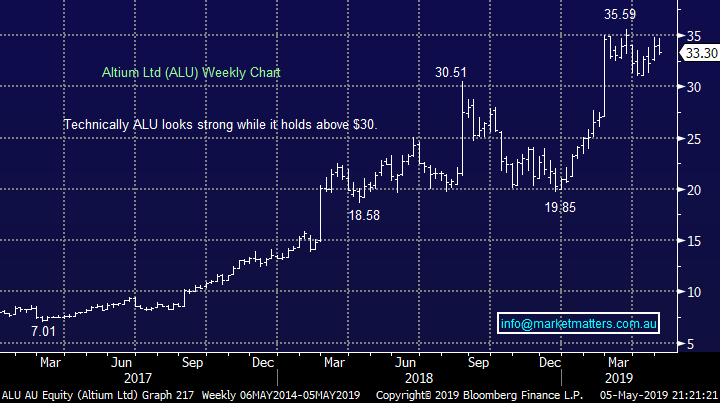
“Hi - I’m just wondering about the strategy of “Sell in May Go Away”? I would also like your opinion about Altium and the other high tech stocks. Is it time to sell or buy?” Best Regards Kenneth C.
Morning Kenneth,
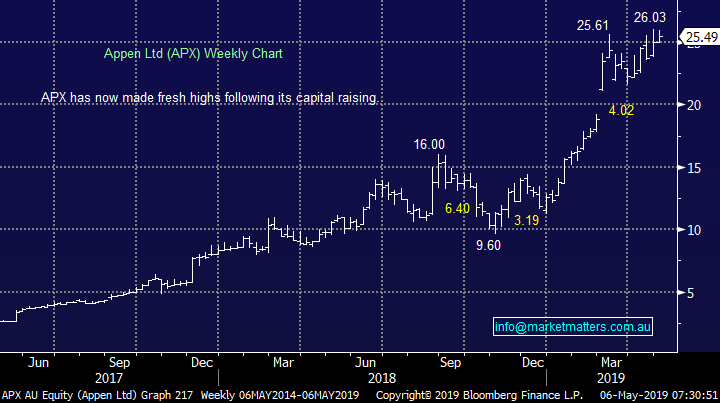
The sector has been extremely strong in 2019 totally exceeding our expectations and probably MM’s biggest error this year was taking profit too early in the likes of Appen (APX), Altium (ALU) and Xero (XRO) after buying perfectly in late 2018.
The acceleration of the recent gains feels like momentum buyers continue to pile into the sector with an almost FOMO mentality (Fear of Missing Out). MM is comfortable not being buyers / long at current levels but do have a our eye on a couple if / when they pull back e.g. Appen (APX) around $20.
Altium (ALU) Chart
Appen Ltd (APX) Chart
Question 2
“Hi Adam, What’s the MM timing on giving this a nibble?” – Geoff S.
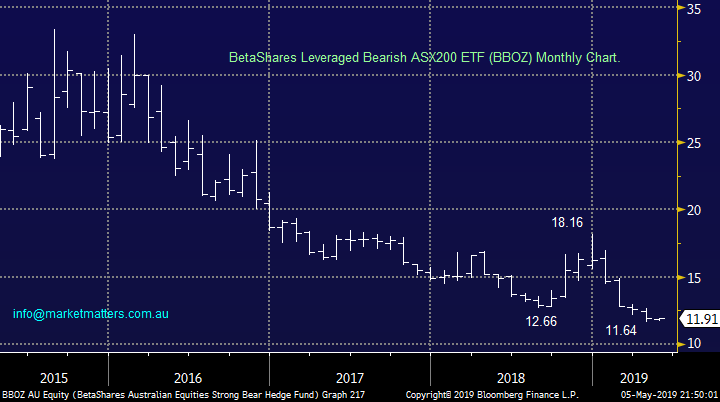
NB This was a question directed to Adam Sanders, Senior Market Strategist at MM with reference to the BBOZ a leveraged negative facing ETF for the ASX200.
Hi Geoff,
Following Donald Trumps move over the weekend perhaps Friday afternoon would have been the ideal time but hindsight can have a knack of selling on cue!
Timing is not something we like to regularly talk in terms of, we prefer considering the simple case of a stock / sector / market being too cheap or expensive. At this stage of the cycle following the recent global central banks about turn to a dovish stance we feel stocks are “rich” but not a major sell.
Our best answer is we feel things will get too stretched on the upside sometime in 2019 / 2020 but it doesn’t feel right just yet given the support being provided by central banks. Short the market into a rate cut is not an ideal scenario in our opinion.
The below chart is of the BBOZ leveraged bearish ETF and its degree of gearing can be seen by its 36% decline while the ASX200 has rallied 18%.
BetaShares Leveraged Bearish ASX200 ETF (BBOZ) Chart
Question 3
“Hi There, Thanks for all the great information and updates. Just a quick question as to when this portfolio might be coming online.” - Thanks in advance Greg T.
NB – Greg is referring to two international portfolios we are launching shortly.
Hi Greg,
I’m never keen to pinpoint a timeframe when the answer is in the hands of IT but we are hoping by June and the start of the new financial year at the latest – soon!
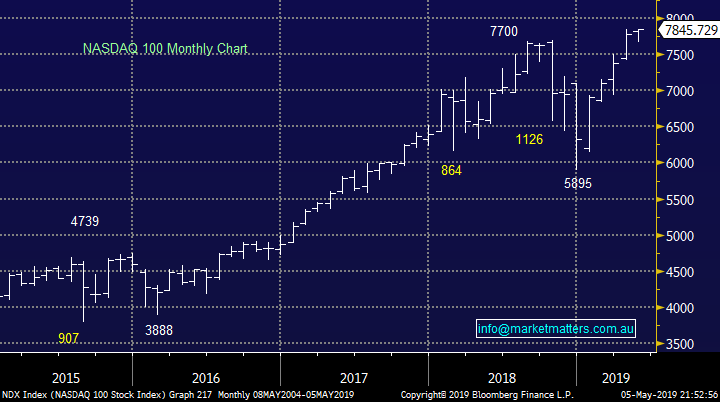
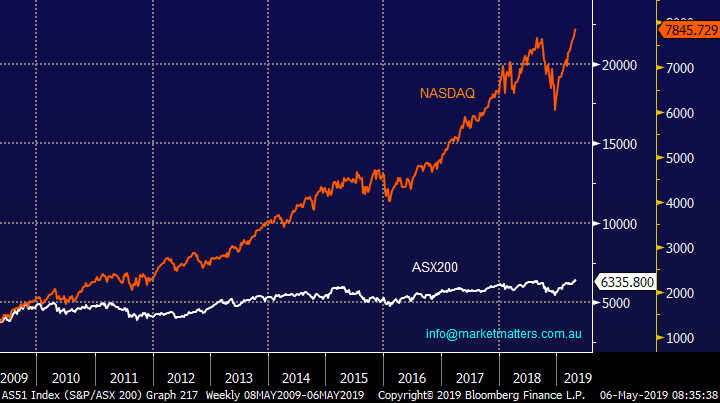
The chart below shows the IT based US NASDAQ which has soared over 30% since December, almost double the ASX200 – we are excited by the opportunity to cast our net further afield.
US NASDAQ 100 Monthly Chart
Question 4
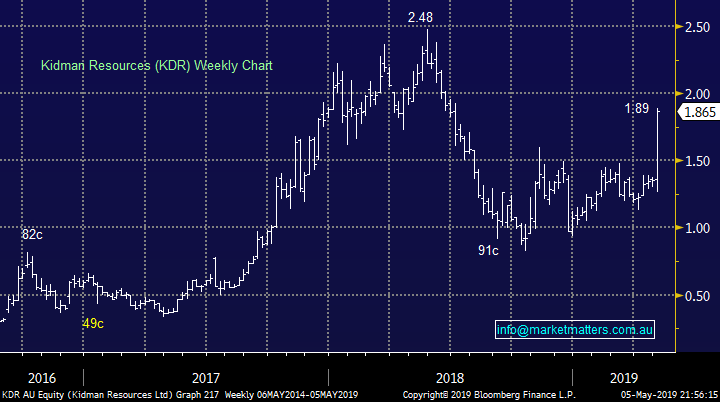
“KDR We purchased 17,000 KDR at $0.99. With the recent sharp increase to $1.86, we sold off 8000, and retained 9000. As the takeover seems friendly, Is there any financial gains to "hang on" or should we simply cash in the remainder as close to $1.90 offer as possible, bringing in some +86% profit.” - Regards Geoff B.
“Thanks for your report on ORE, GXY & AJM. I am thinking much more about Nickel, if you are going into Lithium then you need Nickel as well.” - Regards, Phil.
“Hi James, Interested on your view on the Wesfarmers offer for KDR. I own around 30,000 shares, current delta to the offer price is 3.4%. Do you see other parties potentially making a higher offer? Seems straightforward enough with no real problems to it completing from what I’ve read. So question I’m asking myself is, can I make better than 3.5% with the funds in the next eight weeks or whatever the time to completion will be?” – Regards David H.
Hi Guys,
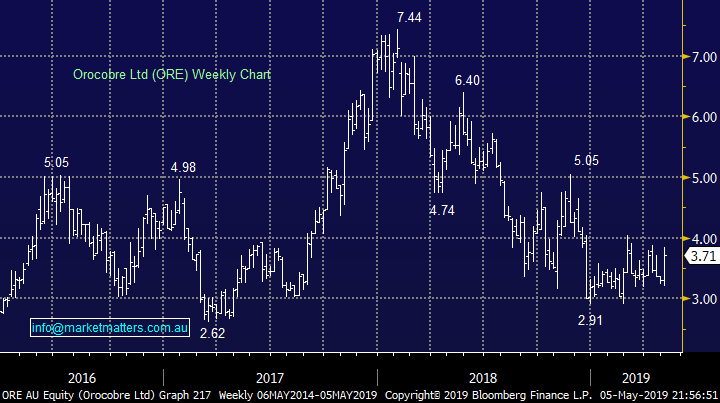
Last week as you may have noticed MM went long Orocobre (ORE) with the Wesfarmers (WES) bid for Kidman Resources (KDR) the catalyst that sent us back into the volatile lithium sector.
1 – We feel the KDR – WES $776m deal is almost “done and dusted” and it will go ahead at $1.90 per share, less than 2% above Fridays KDR close.
2 – Conversely we can see at least another 30% upside in Orocobre (ORE) from Fridays close.
Hence we believe monies can now be best put to work in other areas of the lithium space.
Also, we agree than nickel may start to again become interesting if EV again becomes the apple of the markets eye but at the moment only the lithium space appears to have reignited noticeable interest. Both Western Areas (WSA) and Independece Group (IGO) are on our radar after reasonable quarterly updates.
Kidman Resources (KDR) Chart
Orocobre (ORE) Chart
Question 5
“Hi James and Team, thanks for your tremendous coverage of Oz shares which constantly gets better week by week. One matter I would appreciate is some additional coverage of stocks which (in my opinion) are moving into ‘deep value’ or ‘maximum margin of safety level’, including of course your suggested Buy Price Range and short term suggested Price Target Range.
As an example, here’s my most recent list of stocks (in alphabetical order) which I see approaching ‘deep value’ and are thus stocks I am looking to Buy for short term trades (though some might have moved up already, and will thus come off the list): ABC, AMP, AWC, CCL, CGC, CLH, CPU, CSR, CTX, EHL, ELD, EVN, FLT, GUD, HSN, LLC, MMS, NHF, SBM, SGR, SKI, SPK, PPS, REH, SAR, TPM, WHC.
I don’t expect you to comment on these stocks I’ve listed – I’m just providing them as a helpful example of where my thoughts were a few days ago. Some of these stocks obviously have a few problems (eg: SBM) but I’ve selected many of them as ‘contrarian’ plays based on an expectation of their being somewhat oversold on bad news that’s only going to get better – after all, it only needs to reverse upwards once to realise a trading profit!
By short term trades I mean from about 1 week up to about 6 months (though this is variable).” - Rgds, Gil.
Hi Gil,
Thanks for the thumbs up, much appreciated.
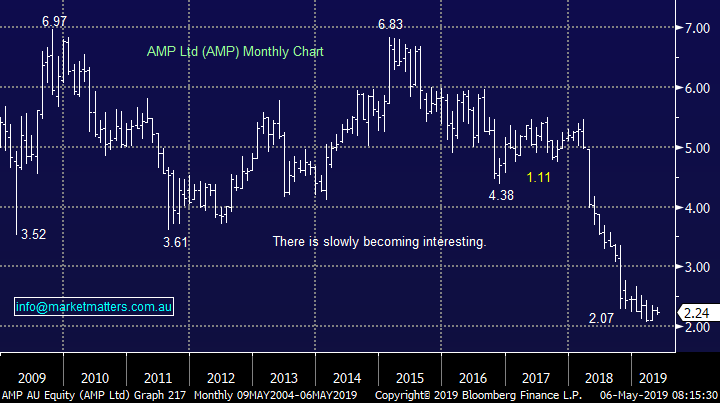
Obviously as you acknowledge a very long and encompassing question which has a few pitfalls along the way – statistically investors are far better off buying stocks that make fresh quarterly highs as opposed to lows. In other words catching the falling knife can be very dangerous e.g. AMP illustrated below just kept falling taking its decline to 70% in only a few years while the overall market rallied strongly.
Identifying “deep value” is a skill which can deliver great gains when correctly implemented. We believe in todays “rich” market this is an ideal time to buy discounted stocks which we rudely named the “dogs”, 5 of which now reside in the MM Growth Portfolio – Costa Group (CGC), Pact Group (PGH), Bingo (BIN), Ausdrill (ASL) and Emeco Holdings (EHL).
We believe investors need to give these forays a little room as you are playing a contrarian viewpoint hence we initially only allocated between 2% into each position, rising to 4% - hence spreading the risk across the 5 stocks.
The main reason our thinking is aligned with Gil’s is that we believe the momentum traders have stretched the elastic band too far between the popular in vogue stocks such as the Software and Services sector and stocks such as those mentioned above that are reorganising after tough periods.
As always, identifying a catalyst for a change of trend is key.
AMP Ltd (AMP) Chart
Question 6
“Hi, Just read today's Income Report. insightful as always. You mention - Market Matters International Equities Portfolio - Market Matters Global ETF Portfolio These are perhaps of more interest than taking up the opportunity to invest through your Income and Growth portfolios. Is it possible to invest in these yet, as the Click Here button's don't seem operative? If not, when will they be available? Regards Michael B.
Hi Michael,
Unfortunately subscribers cannot invest in these 2 portfolios through MM SMA’s (yet) but our intention is they will certainly be available at some point moving forward – the below chart illustrates perfectly why we are excited about the numerous possibilities these vehicles provide.
Currently MM subscribers can invest in portfolio’s that are aligned with both the MM Platinum and Income Portfolios through our SMA’s - https://www.marketmatters.com.au/news/sma/
ASX200 v NASDAQ Chart
Question 7
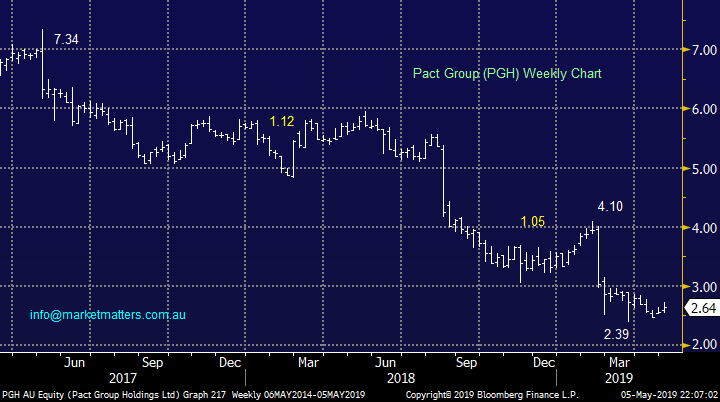
“Hello, I would like your comments on PGH please. It was added to the growth portfolio as a turn-around stock. How long would you give this company time to "turn around"? Are you still reasonably confident that this will happen? If so, what is giving you this confidence?
From the comments on 28 March, is it the case that the previous experience of the new MD is the basis for the confidence that production costs can be lowered? Or are other factors more relevant? When is the company next reporting? Do you have any direct contact with the MD to discuss plans and progress on lifting earnings?
I am concerned because so far I have lost money and need to work out how long I will hold on.” - Thanking you, Carol G.
Hi Carol,
The Pact Group (PGH) is one of the “dogs” we hold in our Growth Portfolio and as we mentioned earlier we are giving it some room as a turnaround story.
The company reported their half-year results in late February which led to the stock plunging 40%, a fall which we believe presented good risk / reward buying opportunities. Hence we will have to wait until August to see if they have fully cleared the decks and are moving in the direction we hope. We do have confidence in the new MD Sanjay Dayal but we cannot expect him to perform miracles in just a few months. Debt levels remain high and this needs to be addressed for the stock to start performing.
We remain comfortable with our 4% holding in PGH but do believe some patience is required.
Pact Group (PGH) Chart
Overnight Market Matters Wrap
· The US equities rallied on Friday night on the back of strong jobs data, however following the tweets from US President Trump over the weekend, the US-China Trade wars had reignited in a negative way, noting trade negotiations are moving too slow and that tariffs on $200 billion of imports will rise to 25% from 10% on Friday – this pushed the US futures to open over 1.5% lower this morning.
· US April nonfarm payrolls beat analyst expectations, while wages growth was lower than consensus. Over three quarters of S&P 500 companies have reported with earnings down 0.8% vs forecasts of a 4.2% fall.
· Metals on the LME were better, with copper bouncing 1%. Crude oil however is off over 2% this morning..
· The June SPI Futures is indicating the ASX 200 to open lower this morning following the current US-China trade negotiations.
Have a great day!
James & the Market Matters Team
Disclosure
Market Matters may hold stocks mentioned in this report. Subscribers can view a full list of holdings on the website by clicking here. Positions are updated each Friday, or after the session when positions are traded.
Disclaimer
All figures contained from sources believed to be accurate. Market Matters does not make any representation of warranty as to the accuracy of the figures and disclaims any liability resulting from any inaccuracy. Prices as at 06/05/2019
Reports and other documents published on this website and email (‘Reports’) are authored by Market Matters and the reports represent the views of Market Matters. The MarketMatters Report is based on technical analysis of companies, commodities and the market in general. Technical analysis focuses on interpreting charts and other data to determine what the market sentiment about a particular financial product is, or will be. Unlike fundamental analysis, it does not involve a detailed review of the company’s financial position.
The Reports contain general, as opposed to personal, advice. That means they are prepared for multiple distributions without consideration of your investment objectives, financial situation and needs (‘Personal Circumstances’). Accordingly, any advice given is not a recommendation that a particular course of action is suitable for you and the advice is therefore not to be acted on as investment advice. You must assess whether or not any advice is appropriate for your Personal Circumstances before making any investment decisions. You can either make this assessment yourself, or if you require a personal recommendation, you can seek the assistance of a financial advisor. Market Matters or its author(s) accepts no responsibility for any losses or damages resulting from decisions made from or because of information within this publication. Investing and trading in financial products are always risky, so you should do your own research before buying or selling a financial product.
The Reports are published by Market Matters in good faith based on the facts known to it at the time of their preparation and do not purport to contain all relevant information with respect to the financial products to which they relate. Although the Reports are based on information obtained from sources believed to be reliable, Market Matters does not make any representation or warranty that they are accurate, complete or up to date and Market Matters accepts no obligation to correct or update the information or opinions in the Reports. Market Matters may publish content sourced from external content providers.
If you rely on a Report, you do so at your own risk. Past performance is not an indication of future performance. Any projections are estimates only and may not be realised in the future. Except to the extent that liability under any law cannot be excluded, Market Matters disclaims liability for all loss or damage arising as a result of any opinion, advice, recommendation, representation or information expressly or impliedly published in or in relation to this report not withstanding any error or omission including negligence.


