Subscribers questions (GEM, LNG, NUF, GCS)
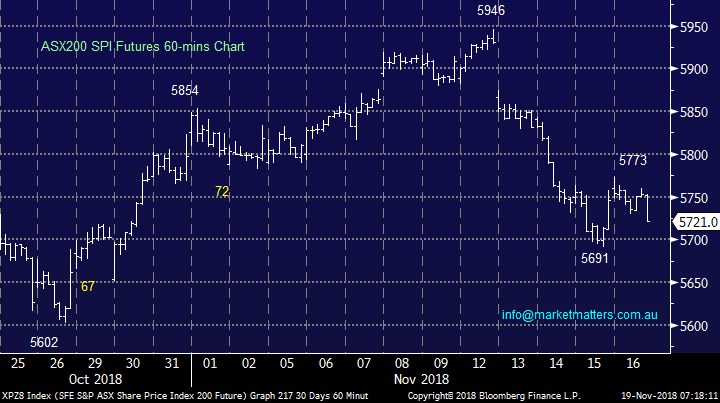
Friday night’s 120-point bounce by the Dow doesn’t feel enough to arrest last week’s weakness, especially following Friday afternoons 50-point decline into the close showing the current lack of confidence in our market. The Saturday morning SPI futures close is calling the ASX200 basically unchanged which almost feels optimistic to me.
Over the weekend we again saw home auction clearance rates slip lower – under 45% for the 3rd week in a row. Not great news when combined with US Vice President Mike Pence’s verbal attacks on China during a week of summits that ended Sunday, including a call for nations to avoid loans that would leave them indebted to Beijing. He said the U.S. wasn’t in a rush to end the trade war and would “not change course until China changes its ways” -- a worrying prospect for a region heavily reliant on exports.
Just when markets were warming to positive rhetoric from President Trump around US - China trade we get this broadside from Pence, I can see markets adopt a classic trading adage – “if in doubt stay out”.
We are mildly bearish the ASX200 short-term targeting a break of the 5600 area.
Thanks again for some more great questions, uncertainty remains the great boost for investor focus, I feel like we have our finger on the pulse at present which if correct suggests a choppy but exciting few weeks into Christmas and 2019.
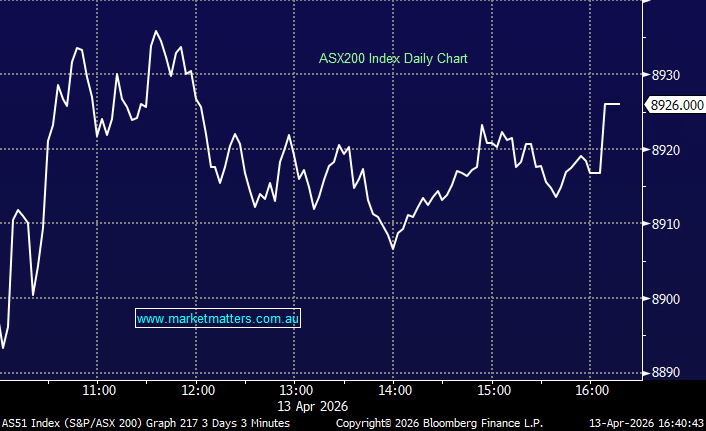
ASX200 Chart
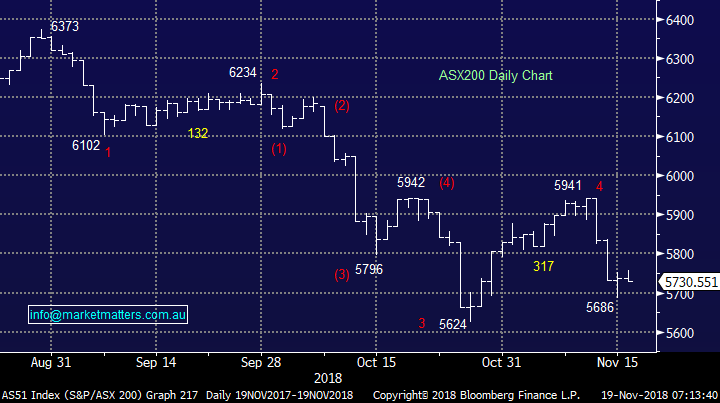
Our preferred scenario moving into 2019 warrants plenty of caution but for the nimble opportunities should be excellent if investors are flexible.
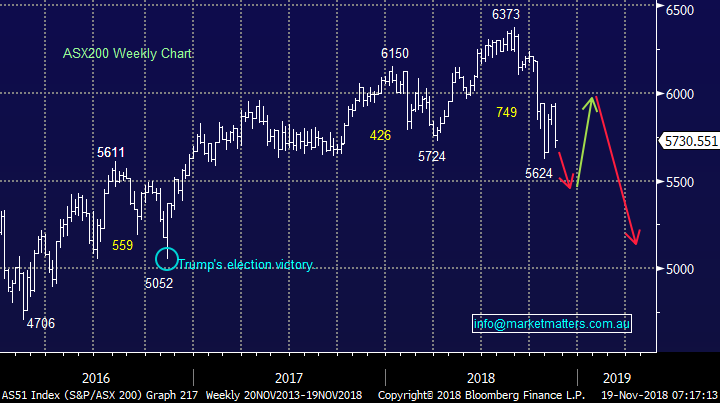
Below is our current preferred scenario into 2019 and beyond – basically a dip lower followed by a ~8% rally into Christmas / New Year and then another ~12% lower in 2019 / 2020 giving an overall decline of over 15%, still not bad considering the advance since the GFC. Its important subscribers remember our ideas are fluid but overall we have got a good strike record with the index over recent years.
If we are correct with below expect our market exposure to vary significantly in the months to come as we look to add “alpha” – value.
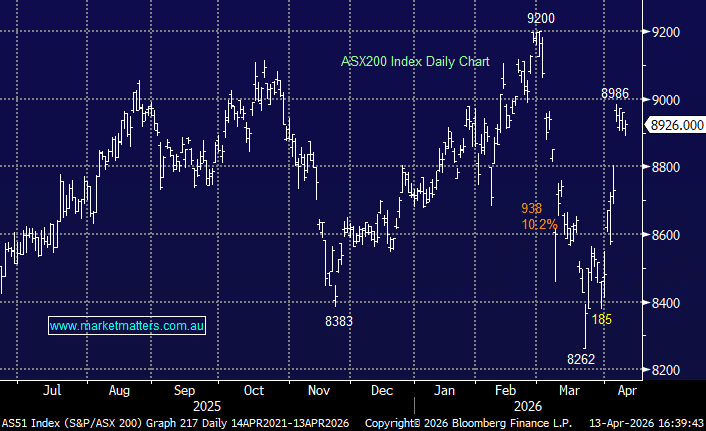
ASX200 Index Chart
Question 1
“Hi MM Team, why have you not you considered the fall of the ASX200 this week could be based on offshore investors closing out on Australia due to the latest polls indicating a higher chance that Labor could win the next federal election? Am I right? or will all international investors with Aussie Investment subs leave this little country if we impose reduced capital gains benefits, eliminate negative gearing on property investment which support local economies and suck up to the left fringe? Lastly reduced investment via low life immature political Labor/Green taxes of SMSF retirees who deserve to survive their last years on earth outside of politics (ha ha) after their very heavy and massive investment in this nation over the last 50 years and more ?? A very passionate old guy Aussie, suck it to the bludgers !!” - Steve K
Hi Steve,
Some strong political views which obviously we will steer clear of but as you know we are not fans of the discussed Labor changes to investments / franking credits.
However we do not believe these opinion polls have any bearing on last week’s selling, in fact the latest polls has the Coalition narrowing the gap on Labor although not enough to retain power at this stage.
ASX200 SPI Futures Chart Chart
Question 2
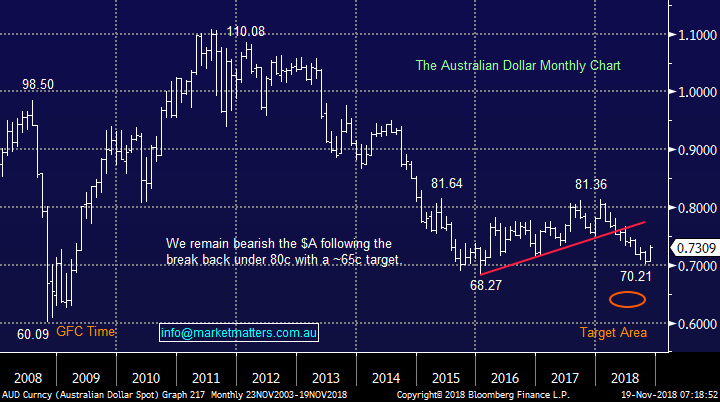
“Morning MM Team, "The $US looks bearish" - can't say that I disagree with this call, but was does that mean for your prediction that the little Aussie battler is heading towards AUD$0.65??” – Regards Scott T.
Hi Scott,
Our 65c is a long-term target, a bounce back towards say 75c is not unexpected considering we’ve seen a 11.15c decline in the Aussie from its highs of 2018 above 81c.
We remain bearish the $A into 2019 / 2020 but simply expect a correction of this year’s decline.
Australian Dollar ($A) Chart
Question 3
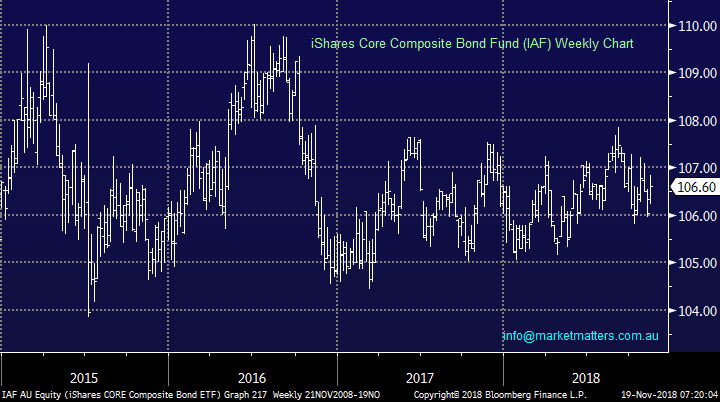
“Hi James & the team, thanks for the very informative Webinar today. I just bought IAF given bond yields falling around the world over the last week. My first time in bonds – mainly as a defensive play, and to learn something about bonds. Early days still, but I’ve been surprised how very little they move despite the events / yield falls of the last week. I was interested in your thoughts on that. Also, have you any suggestions about bond trading – I read that the pro’s trade (leveraged) bond spreads but that’s probably above my ability. Also, I cannot see how to get exposure to TLT, IEF etc via the ASX.” - Thanking you, Kym D.
Hi Kym,
Interest rates don’t move that much month on month hence it should be no surprise IAF is the same – for those that are wondering IAF is currently yielding 2.32% unfranked.
IAF has traded in an almost 6% range since its lows of 2015, about a quarter of the ASX200’s volatility but importantly in an inverse manner i.e. IAF has tended to rally when stocks fall.
As for professional bond trading its like most things in life it takes an apprenticeship of many years, which will probably cost money / opportunity to finally become a “Master of the Universe”.
As for the likes of TLT, IEF etc I am not sure what platform you are using but it should be straightforward. If you have no joy come back to us.
iShares Core Composite Bond ETF Fund Chart
Question 4
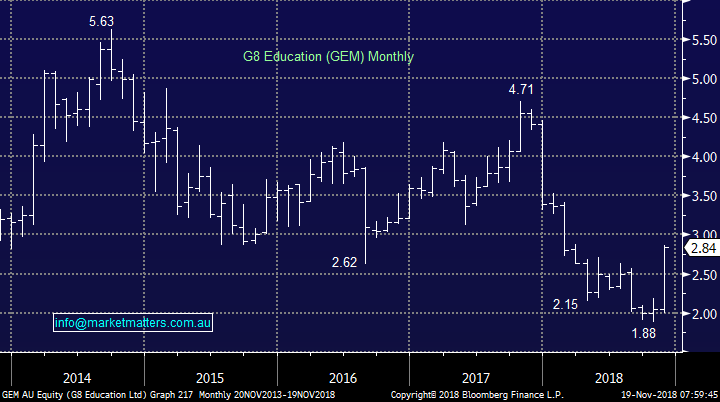
“Hi MM Team, as a long-term holder of GEM, the horror year has been turned on its head this week by the updates from a few childcare providers all pointing to some easing of the occupancy rate pressures. My confidence in the bounce is not high so I was wondering what your technical view is on the stock at the moment.” - Thanks Craig D.
Hi Craig,
G8 Education (ASX: GEM) certainly has improved following its market update on occupancy rates, over 50% in a few months is nice but obviously most investors are long from higher levels.
Technically this was another example of a stock making fresh lows when it broke $2.15 only to recover with a vengeance.
Technically GEM now looks promising while it can hold above $2.40.
G8 Education (GEM) Chart
Question 5
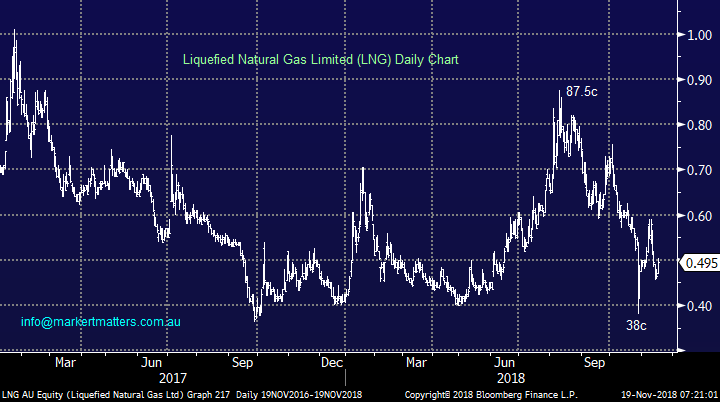
“Guys, have a look at LNG, I think it's about to take off. Have a look!” – Daniel C.
Hi Daniel,
LNG is not a stock I have ever traded and with its market cap below $300m its not an ideal vehicle for MM.
However I can happily give you our technical opinion:
MM could be long LNG with stops below 47c, good risk / reward but not a classic bullish chart pattern.
Liquefied Natural Gas Limited (LNG) Chart
Question 6
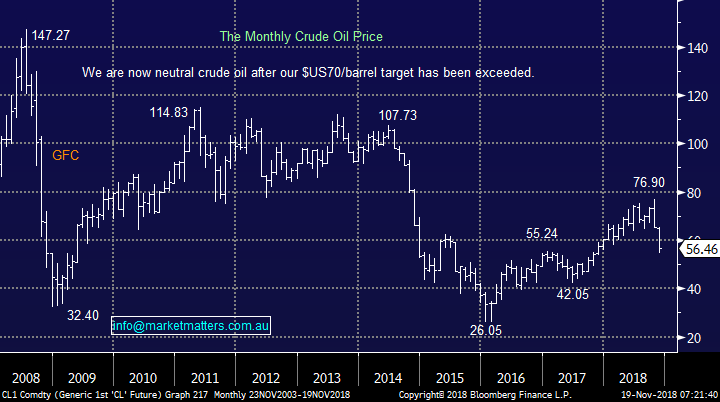
“Hi, is it too early for me to consider a permanent low OIL price hereon with electric cars coming through and the Oil Producers taking advantage of a consumer market which will be declining “- Regards Clive B.
Hi Clive,
A fascinating subject that in itself we could discuss for hours, not the 10-15 minutes we have for each of these questions.
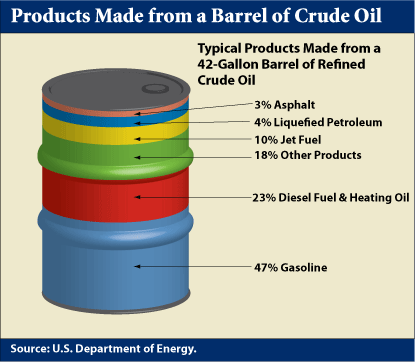
Around 50% of oil production is used for vehicles with the number closer to 70% for cars alone in the US.
If 50% of the demand is in decline, plus most producers are struggling to balance their budgets hence must keep the taps turned on, it’s hard not to imagine a lower oil price moving forward.
We put oil stocks in the more active bucket for investing , just like all resources, that are dependant on the underlying commodities prices for profitability / margins.
Crude Oil Chart
Question 7
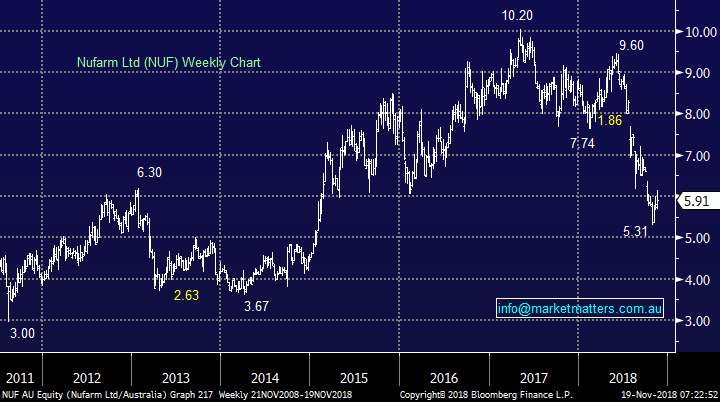
“GDay James, I really enjoy your commentary. Nufarm is a chemical company not a fertiliser company, 2 very different markets in ag space. I deal with Nufarm (ASX: NUF) as a customer in my business and would not be investing in them. They have old chemistry that is getting phased out. They also have no pipeline products that will drive future sales.
They also still manufacture in Australia whilst competing against imported product from china which is eroding profit margins. They also have spray products and seed traits which are not very exciting. If you have any questions give me a call.” – Cheers
Hi - , I really appreciate your informed comments / offer. I’m especially pleased that our previous conclusion is aligned with your thoughts:
“We like NUF in a takeover basket, but cannot buy it for its own fundamental reasons today.”
Nufarm (NUF) Chart
Question 8
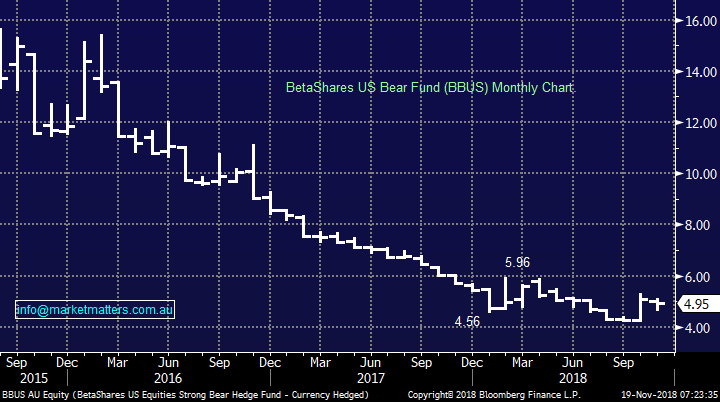
“Subscriber Question for next Newsletter Re. BBUS... You advised beautifully on the buying and selling of BBUS recently, although sold a day early. What is your thinking on purchasing back in to BBUS to cover for your lingering bearishness. Current range is around $4.60-4.76, which is similar to where I bought in the first time around. Is it worth targeting a new price to buy back in, or is this style of ETF short less effective after the initial market correction?” – Charlie N.
Hi Charlie,
We are only looking for a touch more weakness before a rally into Christmas / 2019, unfortunately in this case we believe the boat has sailed. Last week the better option would have been to hedge local portfolios directly through domestic facing ETF’s as we underperformed:
Bearish – ASX: BEAR & / or the geared ASX: BBOZ.
Conversely when we believe the markets poised to enjoy a Christmas rally a “geared” bullish facing local ETF may be ideal i.e. the ASX: GEAR.
I do expect MM will be using the above a number of times moving into 2019/2020.
BetaShares US Equities Strong Bear Hedge Fund (BBUS) Chart
Question 10
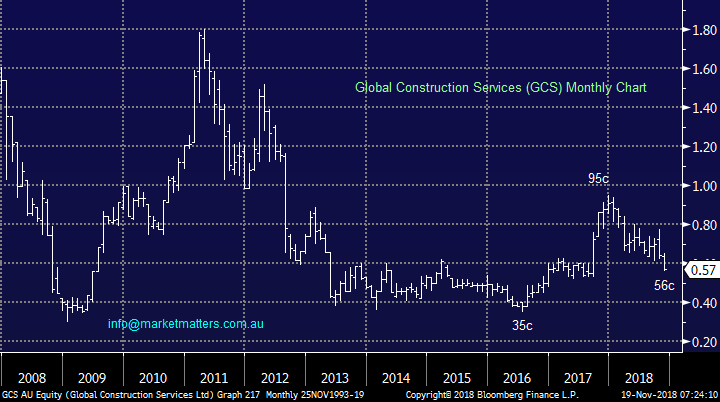
“Hi MM I have a holding in GCS (now SRG global) and wondering if you have a view on them. At one stage I thought you had them in your income portfolio. They have a good set of figures but the share price does nothing but go down. It seems as though every time they get a new contract they are sold off! Hope you have some insights” -. Regards Andrew I.
Hi Andrew,
Global Construction Services (ASX: GCS) is not a business I follow too closely but your certainly correct, the share price is not happy. We have not ever held this stock across our portfolios.
The business currently has a market cap of $251m while trading on a Est 2019 P/E of 8.5x. The share price rose 5% to 75.7 cents in early October after announcing that it had been awarded a 4-year contract by Woodside Petroleum Limited (ASX: WPL) as operator of a North West Shelf gas project.
I do get concerned when stocks fall on apparent “good news” – its one of our avoid filters.
Technically I would rather buy GCS back above 62c as opposed to catching todays falling knife – sorry, probably not what you wanted to hear.
Global Construction Services (GCS) Chart
Overnight Market Matters Wrap
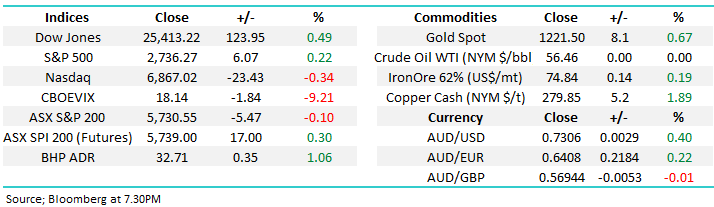
· A mixed session was experienced in the US last Friday, with the Dow and broader S&P 500 ending their session in positive territory, while the tech. heavy Nasdaq 100 closed at a loss.
· Focus is clearly on the US-Trade war and if any agreement would be made in the APEC summit, however it is reported this morning that no final official statement was issued after China refused to sign in protest the language used on reforms to the World Trade Organisation.
· BHP is expected to outperform the broader market after ending its US session up an equivalent of 1.06% from Australia’s previous close.
· The December SPI Futures is indicating the ASX 200 to open with little change, however with the current reports this morning with the US-China Trade war, we expect risk to the downside.
Have a great day!
James & the Market Matters Team
Disclosure
Market Matters may hold stocks mentioned in this report. Subscribers can view a full list of holdings on the website by clicking here. Positions are updated each Friday, or after the session when positions are traded.
Disclaimer
All figures contained from sources believed to be accurate. Market Matters does not make any representation of warranty as to the accuracy of the figures and disclaims any liability resulting from any inaccuracy. Prices as at 19/11/2018
Reports and other documents published on this website and email (‘Reports’) are authored by Market Matters and the reports represent the views of Market Matters. The MarketMatters Report is based on technical analysis of companies, commodities and the market in general. Technical analysis focuses on interpreting charts and other data to determine what the market sentiment about a particular financial product is, or will be. Unlike fundamental analysis, it does not involve a detailed review of the company’s financial position.
The Reports contain general, as opposed to personal, advice. That means they are prepared for multiple distributions without consideration of your investment objectives, financial situation and needs (‘Personal Circumstances’). Accordingly, any advice given is not a recommendation that a particular course of action is suitable for you and the advice is therefore not to be acted on as investment advice. You must assess whether or not any advice is appropriate for your Personal Circumstances before making any investment decisions. You can either make this assessment yourself, or if you require a personal recommendation, you can seek the assistance of a financial advisor. Market Matters or its author(s) accepts no responsibility for any losses or damages resulting from decisions made from or because of information within this publication. Investing and trading in financial products are always risky, so you should do your own research before buying or selling a financial product.
The Reports are published by Market Matters in good faith based on the facts known to it at the time of their preparation and do not purport to contain all relevant information with respect to the financial products to which they relate. Although the Reports are based on information obtained from sources believed to be reliable, Market Matters does not make any representation or warranty that they are accurate, complete or up to date and Market Matters accepts no obligation to correct or update the information or opinions in the Reports. Market Matters may publish content sourced from external content providers.
If you rely on a Report, you do so at your own risk. Past performance is not an indication of future performance. Any projections are estimates only and may not be realised in the future. Except to the extent that liability under any law cannot be excluded, Market Matters disclaims liability for all loss or damage arising as a result of any opinion, advice, recommendation, representation or information expressly or impliedly published in or in relation to this report notwithstanding any error or omission including negligence.