Subscribers’ questions (FMG, TLS, PDN, BSL, WSA)
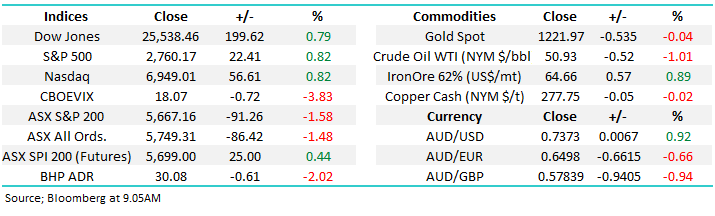
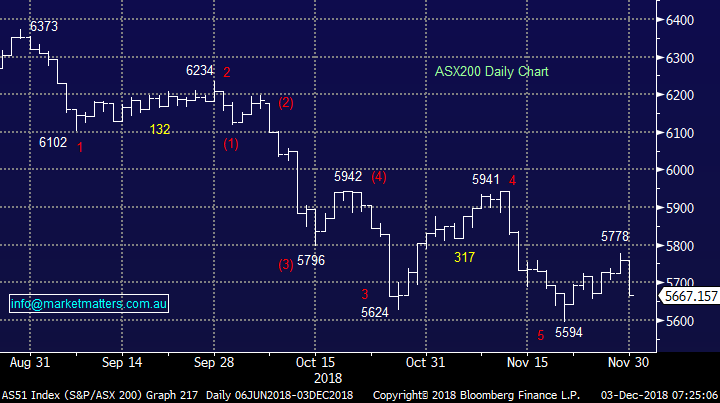
The ASX200 had a simply horrible Friday falling over 90-points as the market was hit buy a barrage of futures (SPI) selling making us the standout underperforming global index for the week. The local market felt on track for our 5950 December target all week until Friday, at times like this we must remind ourselves of one of MM’s favourite sayings – “remain open-minded”. However we have been looking for a choppy style advance from Novembers 5594 low and this could easily be back on track with a quick 2% advance from last weeks finish.
The strength from US markets on Friday night and the agreed “temporary truce” between Xi and President Trump looks set to propel the ASX200 open back above 5700 this morning but the ongoing weakness from BHP and most resources cannot be dismissed short-term. This mornings headlines are certainly pointing to a bullish open by stocks, especially with the $A trading up 1% at 7am AEST – the $US has been a safe haven for investors concerned about the US – China trader war.
“Trump, Xi Agree to Temporary Truce in Bid to Contain Trade War” – Bloomberg.
We remain the ASX200 short-term targeting the 5950-6000 area.
Thanks as always for some more great questions, especially after such a disappointing week and month. A few less than recent weeks shows us Christmas has arrived, the trees were for sale on the weekend and lights were up as we entered December
NB We are looking for a decent top in the coming weeks hence we urge subscribers to maintain at least a casual eye on equities as we enter the final stretch of a choppy 2018.
ASX200 Chart
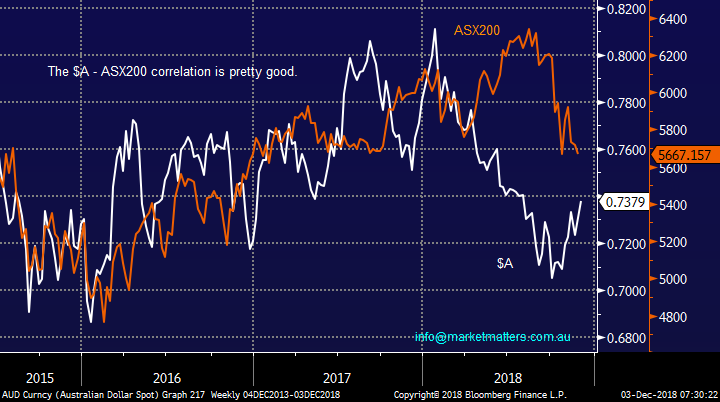
As we mentioned above the $A has gapped up 1% this morning following the “Xi / Trump” meeting at the G20 on the weekend, we looked at the implication of this in the Weekend Report and its bullish equities:
1 - A stronger $A suggests a recovery by the ASX200 should follow.
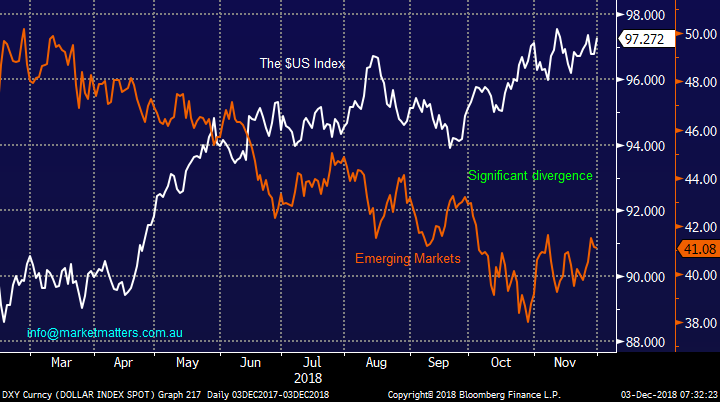
2 – A weaker $US Index strongly implies a recovery in the Emerging Markets which again suggests a stronger ASX200.
The $A v ASX200 Chart
$US Index v Emerging Markets Chart
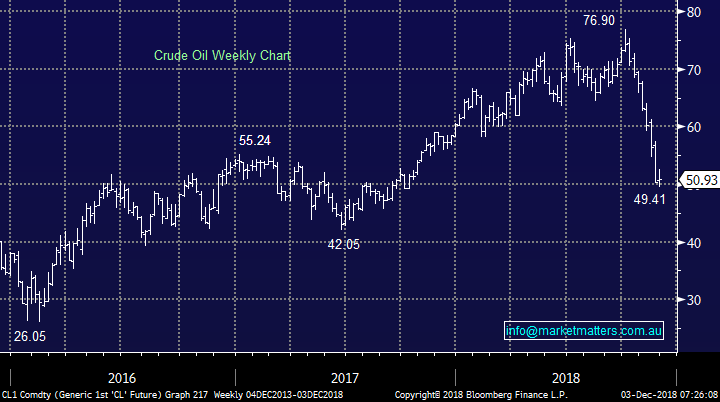
Investors and traders who doubt our most quoted mantra – “remember to be open-minded and flexible” should cast their eyes to the following chart of crude oil – I can assure you very few people were predicting a 35% plummet in just 2-months.
Markets will always surprise us but if we quantify the downside the upside will look after itself.
Crude Oil Chart
Question 1
“An aftermarket notice on Friday of a Change in Director’s interest for Fortescue, shows Twiggy having purchased $117 million worth of shares on market during the week. This being on top of the current $500 million share buyback program currently underway. Fortescue insiders obviously believe the share prices is at a low, and will bounce. Good management, management’s confidence in their own stock, and management investment in on market purchasing gives me great faith in a company. I dipped in last time you guys indicated FMG as a buy, and was wondering whether insider actions, such as the above, strengthens your opinion or not, on whether to buy in again. Where do you see the price of iron ore, and specifically the lower grade ore, and the FMG share price, going from here through 2019? It’s obviously unloved currently, but Twiggy might be indicating there is some love around the corner?” – thanks Charlie.
Hi Charlie,
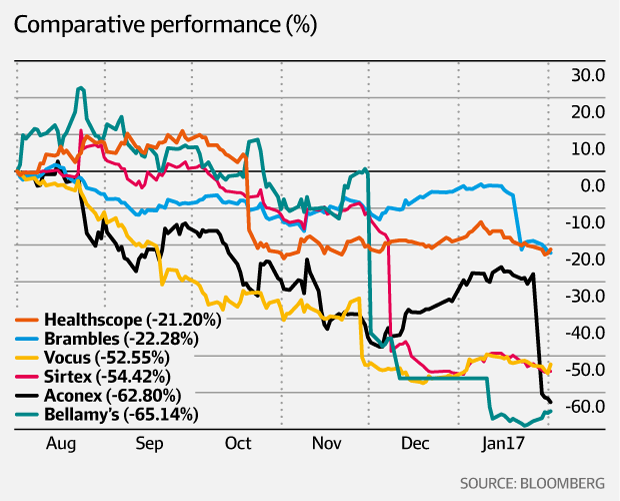
A very comprehensive question for a Monday morning, we agree 100% with your thoughts that Twiggy buying another $117m worth of Fortescue (ASX: FMG) is a positive sign. It sends a far better message to the market than what’s been witnessed numerous times recently i.e. director s dumping stock before profit downgrades and stocks crashing lower e.g. Kogan this year and the below 6 in 2016/7 which we discussed back on the 2nd of May.
i.e. In total nine executives and directors sold shares in Aconex, Sirtex Medical, Bellamy's Australia, Vocus Group, Healthscope and Brambles worth about $60 million, those shares were subsequently worth just $32 million ~6-months later – amazing timing and easy to warm the interest of any cynic.
· Hence at MM we believe it’s very important to be abreast of any significant insider activity.
Hence Twiggy buying is the first tick for FMG, we think it’s great!
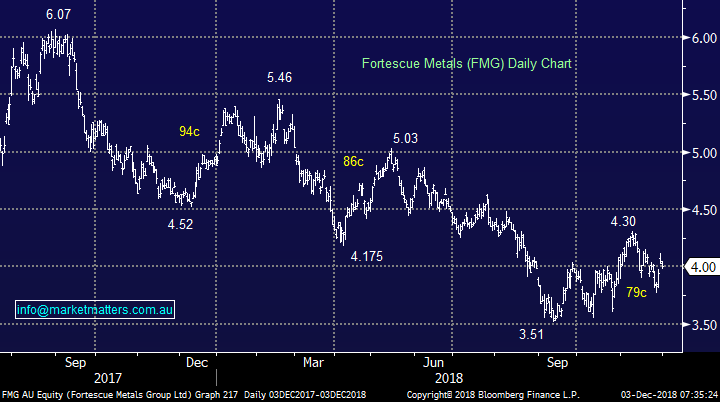
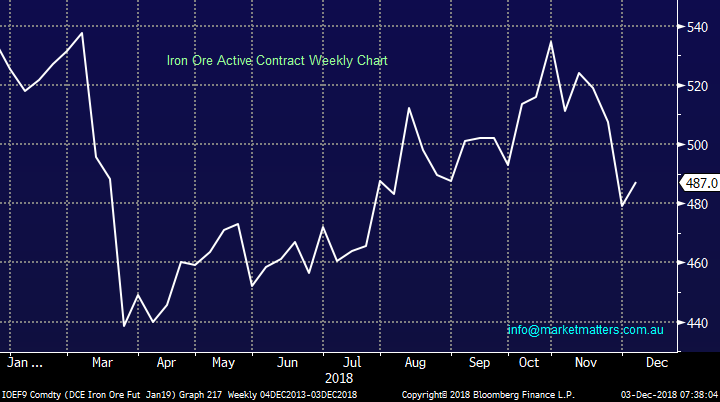
Technically the stock looks ok but there are no great signals from a risk / reward perspective. Similarly iron ore right in the middle of its 2018’s range, no great clues here.
MM is net positive FMG along with our view on the ASX200 and resources which we are looking to buy into current weakness / underperformance.
MM is bullish FMG but would be concerned technically back below $3.75.
Fortescue Metals (ASX: FMG) Chart
Iron Ore Chart
Question 2
“Hi James, back on my hobby horse (apologies), your patience with Telstra is admirable but please don’t hold your breath. I notice on the portfolio page that you include the dividend in the calculation of the current gain/loss, so you’re showing a loss on Telstra of just 1.75%, which in my opinion disguises the situation. You seem happy to lose the benefit of the dividend by using it to prop up a capital loss. A couple of observations, Vocus (ASX: VOC) was a clear buy technically in recent months, why didn’t you dump Telstra and jump across to it? For me, I actually crossed ‘the ditch’ and bought Spark New Zealand (on the ASX) as it also looked good technically.” - Regards, Paul.
Hi Paul,
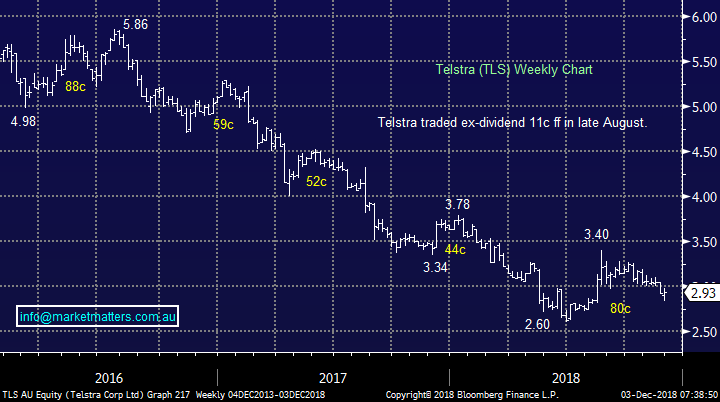
In hindsight I wish we had sold all / part of our Telstra (ASX: TLS) back above a $3.30 – we wrote about reducing around $3.50, clearly too fussy in hindsight.
I don’t agree with your thoughts around the dividend, it must be taken into account e.g. if we bought TLS the day before it traded ex-dividend is it fair to say we are down ~3% the following day and ignore the 11c fully franked we had just received? I believe not.
We still like our TLS / Telco position but moving forward we will consider being more active within the sector – well done to you on that one.
MM remains very confident that the next few years have almost been designed for the active investor.
Telstra (ASX: TLS) Chart
Question 3
“Good note (Resources last Tuesday), As is Uranium as a Commodity ... the number 1 Commodity YTD ...See these two papers by Chinese Government "China’s foreign dependence on uranium will be greater than for oil, and the situation will become extremely serious" & "China's uranium demand will grow at the rate of about 7.69% per year, which is about three times the growth rate of production" RIO sold Rossing mine ... and Paladin is located right next door. China needs Uranium supply”. – Rodney F.
Hi Rodney,
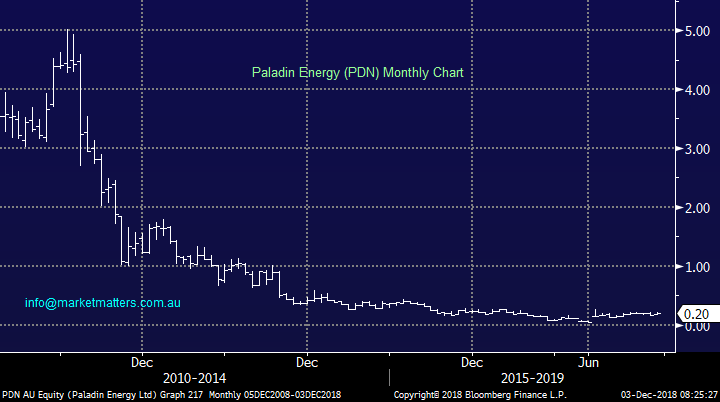
Uranium is receiving a lot of press recently and Paladin has not missed out since “small cap guru” David Paradice took a 10% stake in the company.
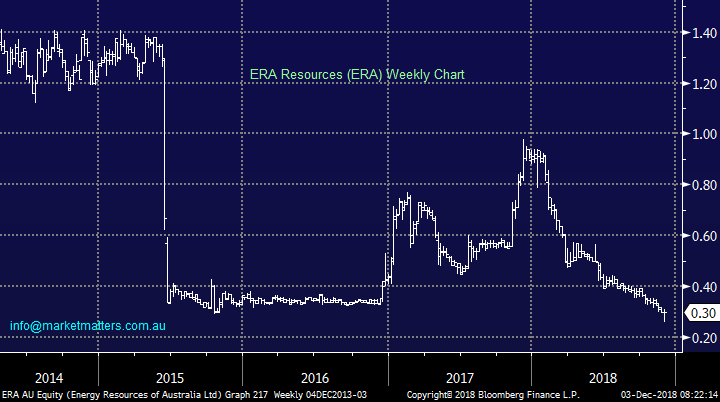
Other companies on the ASX with uranium exposure are BHP, RIO and ERA.
The performance of the uranium sector has been awful since the Fukushima disaster back on the 11th of March, 2018. The companies simply need a much higher uranium price to make money and while Chinese demand will help this equation we are nowhere near yet.
MM is neutral PDN but technically I would rather buy a clear break of 22c and then place stops below 20c.
Paladin Energy (ASX: PDN) Chart
Energy Resources (ASX: ERA) Chart
Question 4
“Hi James and M&M team, just have one for your subscriber questions. Wondering what your thoughts are on BSL around these levels, seems to have been nothing but one-way traffic since results. Seen a bit of commentary that it's trading at around a 10% discount to global peers. Thinking a bit of value might be opening up around here or slightly lower. Any insights appreciated.” - Cheers, Damian.
Hi Damian,
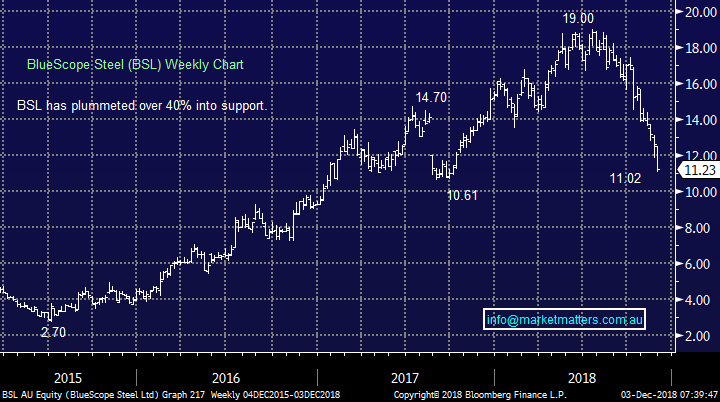
BlueScope (ASX: BSL) definitely does feel cheap since its 40% decline with the stock now trading on only a P/E of 5.57x for 2019 although that increases in outer years.
Building / construction related stocks across the board have been hit hard – simply look at downgrades from Boral (ASX: BLD), Fletcher Building (ASX: FBU) and others. It seems to me that BSL is trading as if the market thinks a downgrade is on the way – perhaps the market has tagged BSL unfairly.
The company is also exposed to China and perhaps this weekends net positive outcome between Xi and Trump will reignite some optimism for BSL.
MM likes BSL at current levels expecting at least the next 10% move on the upside.
BlueScope steel (ASX: BSL) Chart
Question 5
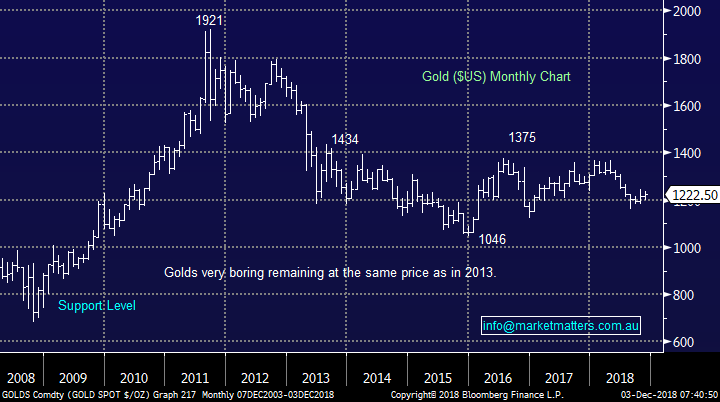
“INN Daily: Goldman Sachs Optimistic on Gold, Expects Commodities to Soar in 2019” -is this true? - Regards Phil B.
Hi Phil,
There was a story on CNBC where Goldman’s were calling both gold and oil to bounce next year but there are plenty more negative stories from the same US powerhouse in recent months.
https://www.cnbc.com/2018/11/26/goldman-sachs-says-oil-and-gold-prices-are-extremely-attractive.html
We believe the $US will fall into 2019 and resources should eventually bounce accordingly but medium-term the picture is very tricky – gold hasn’t moved in 5-years, we don’t intend to second guess it yet, it will tell us when it wants to rally and that’s likely to be led by signs of a sustained uptick in global inflation.
Gold $US Chart
Question 6
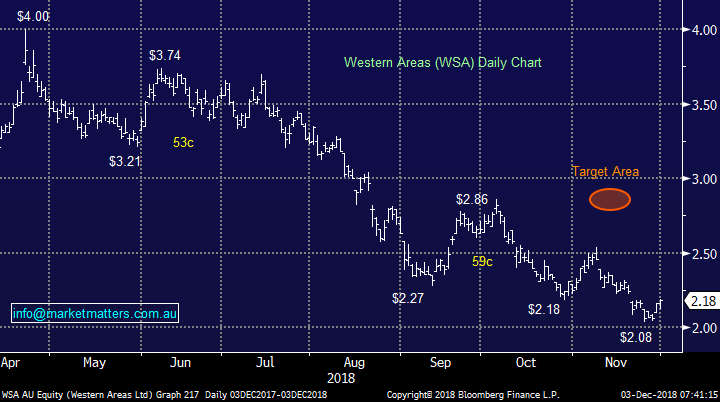
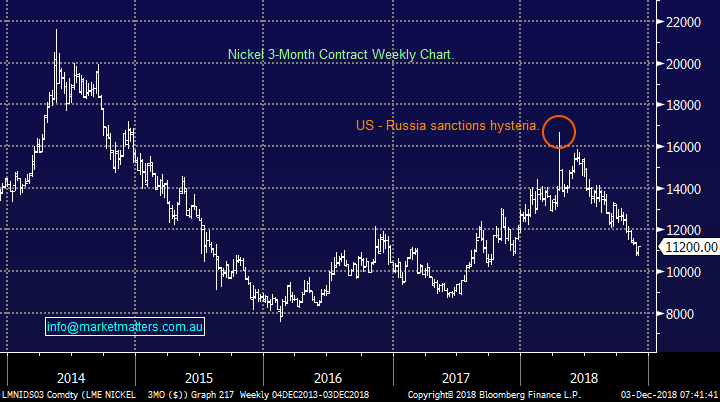
"Hi James and Team, I note that WSA is held within the Growth Portfolio and on Monday you stated that you were comfortable with that position even though the nickel price was falling. Over the last 6 months the nickel price has fallen from around US$7.00/lb to around US$4.90/lb (-30%). Over the last 12 months the LME Warehouse Stock Level has fallen from 380,000 tons to 290,000 tons 6 months ago to 214,000 tons today (-44%). Please explain why the falling nickel price and falling LME inventory level are so correlated. I would have expected the falling inventory level to be a positive for the nickel price.” - Paul B.
Hi Paul,
You must remember we called Western Areas (ASX: WSA) to fall towards the $2.20 area where we went long i.e. a 45% correction. Obviously nickel had to decline significantly for us to be correct and “get set” in WSA.
I can understand your confusion around the nickel price and stock levels but while supply / demand always dictates the price of things over a decent timeframe it doesn’t short-term - that often gets influenced by human emotions of “Fear & Greed”.
Nickel soared earlier this year around US – Russia sanctions concerns and in our opinion the commodity is simply regaining its equilibrium but we are bullish from current levels.
MM is long and bullish WSA targeting a 25% rally.
Western Areas (ASX: WSA) Chart
Spot Nickel Price Chart
Overnight Market Matters Wrap
· The US equity markets rallied ~0.8% last Friday ahead of the talks on hopes that Presidents Trump and Xi would take a more conciliatory path to avoid further tit for tat tariffs on imports. As part of the truce, China has agreed to import more from the US, in particular agriculture goods.
· This morning, Graincorp (ASX: GNC) received a non-binding indicative $1.76b bid from its long-term asset partner ($10.42/share cash) – a massive premium of 42.74% from its previous close of $7.30!
· BHP is expected to underperform the broader market after ending its US session down an equivalent of 2.02% from Australia’s previous close due to the recent strength of the Aussie dollar.
· The December SPI Futures is indicating the ASX 200 to open 27 points higher this morning, testing the 5700 level this morning.
Have a great day!
James & the Market Matters Team
Disclosure
Market Matters may hold stocks mentioned in this report. Subscribers can view a full list of holdings on the website by clicking here. Positions are updated each Friday, or after the session when positions are traded.
Disclaimer
All figures contained from sources believed to be accurate. Market Matters does not make any representation of warranty as to the accuracy of the figures and disclaims any liability resulting from any inaccuracy. Prices as at 03/12/2018
Reports and other documents published on this website and email (‘Reports’) are authored by Market Matters and the reports represent the views of Market Matters. The MarketMatters Report is based on technical analysis of companies, commodities and the market in general. Technical analysis focuses on interpreting charts and other data to determine what the market sentiment about a particular financial product is, or will be. Unlike fundamental analysis, it does not involve a detailed review of the company’s financial position.
The Reports contain general, as opposed to personal, advice. That means they are prepared for multiple distributions without consideration of your investment objectives, financial situation and needs (‘Personal Circumstances’). Accordingly, any advice given is not a recommendation that a particular course of action is suitable for you and the advice is therefore not to be acted on as investment advice. You must assess whether or not any advice is appropriate for your Personal Circumstances before making any investment decisions. You can either make this assessment yourself, or if you require a personal recommendation, you can seek the assistance of a financial advisor. Market Matters or its author(s) accepts no responsibility for any losses or damages resulting from decisions made from or because of information within this publication. Investing and trading in financial products are always risky, so you should do your own research before buying or selling a financial product.
The Reports are published by Market Matters in good faith based on the facts known to it at the time of their preparation and do not purport to contain all relevant information with respect to the financial products to which they relate. Although the Reports are based on information obtained from sources believed to be reliable, Market Matters does not make any representation or warranty that they are accurate, complete or up to date and Market Matters accepts no obligation to correct or update the information or opinions in the Reports. Market Matters may publish content sourced from external content providers.
If you rely on a Report, you do so at your own risk. Past performance is not an indication of future performance. Any projections are estimates only and may not be realised in the future. Except to the extent that liability under any law cannot be excluded, Market Matters disclaims liability for all loss or damage arising as a result of any opinion, advice, recommendation, representation or information expressly or impliedly published in or in relation to this report notwithstanding any error or omission including negligence.


