Subscribers questions (FMG, SYD, US GDXJ, BBOZ, IGL, REA, NXT, MP1)
Global equities came down to earth at the end of last week after Fed Chair Jerome Powell scuppered the markets belief in a “V-shaped” recovery, he stressed that the pandemic could inflict “longer-lasting damage on the economy”. At MM we felt equities were rallying into very thin air with arguably only basically zero percent bond yields justifying the lofty share price valuations, we postulated that perhaps the Fed was becoming concerned that they were in fact creating a whole new bubble in asset prices and decided to let a little air out of the balloon. This thought actually switched sides of the fence last night when I read the commentary from the Feds address to Congress on Saturday morning AEST.
This time we again heard the Fed state it was committed to using its full range of tools, previously described as “whatever it takes”, to support the US economy in this challenging time. They promised to use this “full range of tools" to pull the country out of the current coronavirus led recession. Although Jerome Powell did note the nearly 20 million jobs lost since February, which reversed the almost 10 years of job gains in one fell swoop, his tone in my opinion was far more along the lines of we can deal with this, as opposed hold on tight it’s going to be a tough ride. Perhaps not only President Trump blamed the Fed for the Dows latest plunge and urged them for a touch of calm.
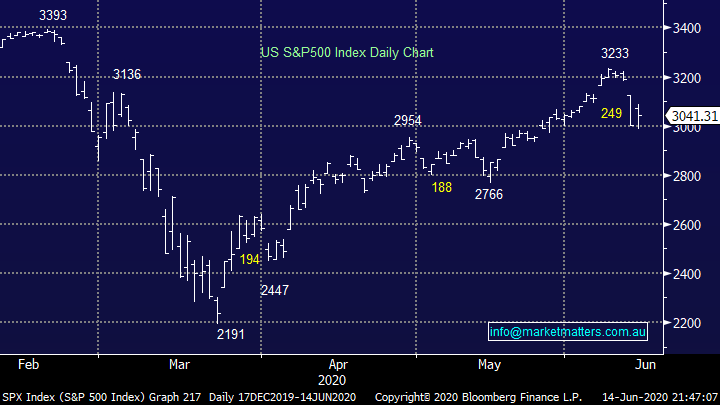
My “Gut Feel” is the Fed wanted to slow the markets advance, not cause another period of increased volatility hence the mantra we adopted for much of the last few months feels back in play i.e. Buy weakness and sell strength. This is not a simple case of stating the obvious as opposed to a reiteration of MM’s view that equities are going higher in a step like fashion with plenty of decent pullbacks along the journey.
US S&P500 Index Chart
The ASX200 was set to open fairly quiet this morning after a very volatile session in the US on Friday, the Dow traded in an almost 900-point range before settling pretty close to where it was when we went home on Friday, although US Futures have opened down around 1% this morning implying a weaker open locally. As we’ve said previously MM is in “buy mode” looking to accumulate stocks into weakness, an increase of bad news around COVID-19 over the weekend might potentially reignite some market jitters this week – Beijing has registered its highest number of fresh cases in 2-months sending parts of Chinas capital back into lockdown while the number of cases in South Korea also rose. These dare I say it subtle reminders of how quickly the virus can slap a complacent society might weigh on stocks especially with many medical experts concerned around potential outbreaks following the recent large global BLM protests.
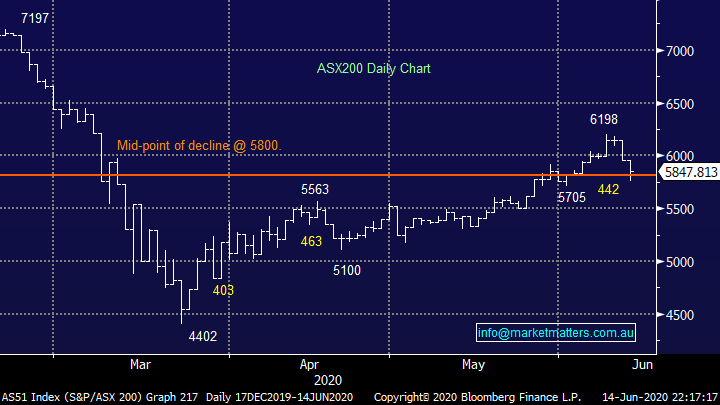
MM remains bullish Australian stocks medium-term, but cautious short term
ASX200 Index Chart
A few less questions this week, I wonder whether a small 1850-point plunge in the Dow has created some nerves amongst our subscribers, it certainly was a tough few days for investors who had become too euphoric.
Question 1
“Quick question - you quote the iron ore price each morning. Can you tell me where you get that data?” – Thanks Colin H.
Morning Colin,
We get our data from Bloomberg but this is obviously an expensive service, I would suggest a simple Google search will produce a good result day to day e.g. https://markets.businessinsider.com/commodities/iron-ore-price
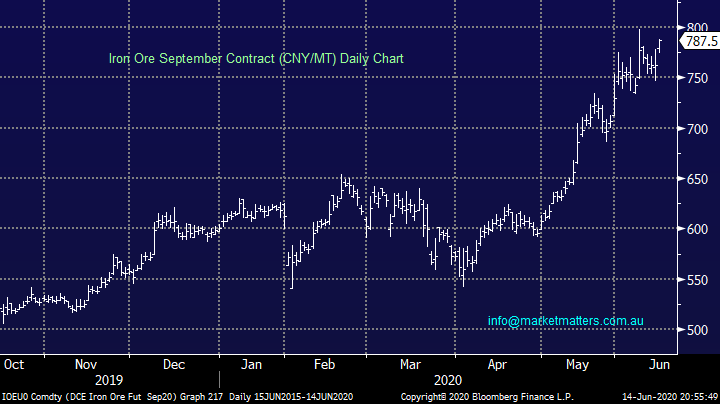
At MM we quote 2 different prices, the first below is in Chinese Yuan with the contract being traded on the DCE-Dalian Commodity Exchange.
MM is bullish iron ore and keen buyer of the next 100 CNY/MT correction.
Iron Ore Sept Futures (CNY / MT) Chart
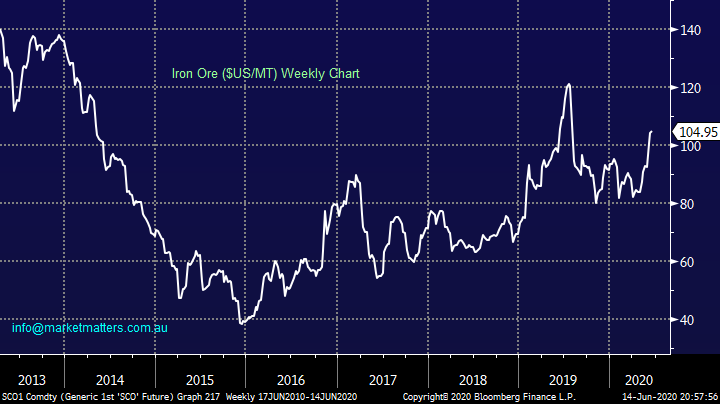
Alternatively we sometimes quote SGX-Singapore Exchange price which is traded in $US/MT– sorry for any confusion!
MM can see iron ore retesting its 2014 high as governments press their fiscal stimulus buttons.
Iron Ore Spot Futures ($US / MT) Chart.
Question 2
“Hi there, I have been looking at taking out a margin loan and was wondering which companies you would recommend to ensure you still come out on top. I was thinking MQG, MFG, SYD, FMG or BHP. Also do you think it would too risky to pick a small cap tipped for high growth? Such as AVH or PAR” - Cheers Nick S.
Morning Nick,
A question that my compliance team will shudder at given we provide general advice only, hence my answer will of course be in general terms. Firstly, it’s important to recognise that we could never “recommend stocks to ensure anyone still comes out on top”, especially with a leveraged margin loan which puts an investor down 5-6% before the doors are even opened. I must stress if it was that easy we would all borrow to the hilt and leverage up, just consider that over the past 20-years shares have returned +8.8 per cent per annum, compared with +7.6 per cent from bonds and +5.7 per cent from cash. This outperformance especially when combined with fully franked dividends is clearly attractive but once we add the “cost of carry” from a margin loan timing becomes vital otherwise the differential can vanish very quickly.
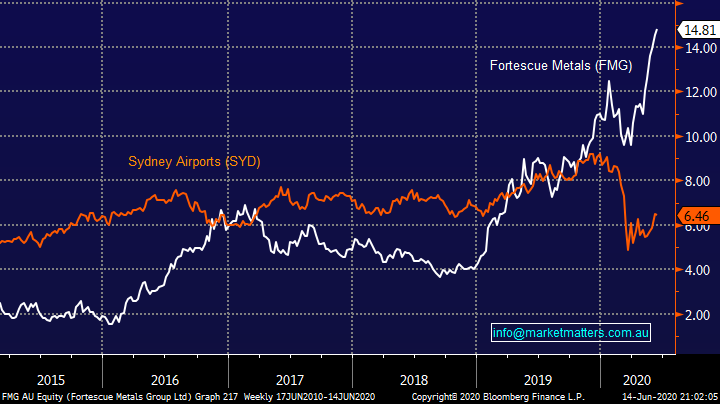
From a portfolio perspective by definition we are believers in our Growth and Income Portfolios or a combination thereof. The chart below of 2 stocks you mentioned illustrates the vagaries of individual stocks and the reason for a well-balanced portfolio. While I have no issues with a portion of investments being directed towards high growth, I would always stress that diversification is important, especially when overlaying leverage.
Fortescue Metals (FMG) & Sydney Airports (SYD) Chart
Question 3
“G'day James & MM. Team, I am wondering if MM have had a look at Manuka Resources (MKR) at all and if so what are your thoughts. The company have put out an IPO Prospectus / announcement for 20 cent a shares and wondered if it may be worth a small gamble.” - Cheers Pete G.
Hi Pete,
For subscribers not familiar with MKR it owns 2 projects in NSW - a 52-million-ounce Wonawinta silver project, which includes an on-site processing facility that began production last month, and the Mt Boppy gold project. Unfortunately it seems MKR have already raised the $$ in an oversubscribed offer and subsequently its been closed off early due to the strong demand – I hope you jumped on board as it looks like it may debut well.
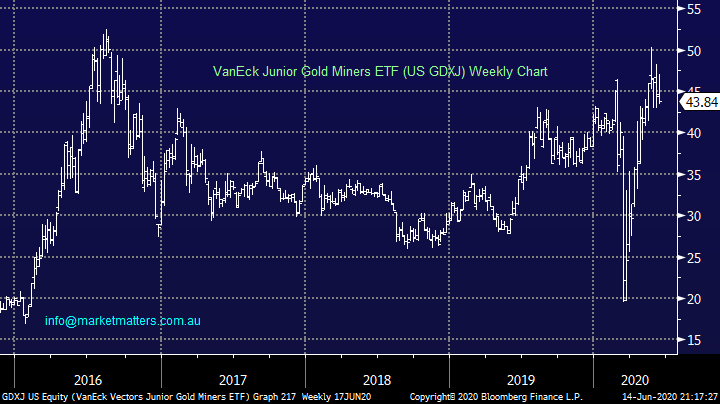
MM remains bullish the gold sector medium-term.
VanEck Junior Gold Miners ETF Chart
Question 4
“Dear James, I have a quick question for Monday, with the ETF in General and the BBOZ in particular, when would the issuer/market maker balance/update the price of the portfolio, would it be real time/throughout the day/close of trade or whatever?” - Thanks Jimmy K.
Hi Jimmy,
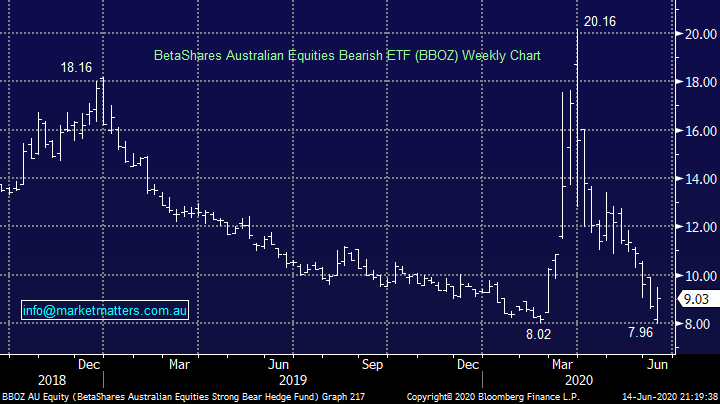
The BBOZ ETF is leveraged around -2.3x so I would envisage that the vast majority of positions would be hedged almost immediately by the issuer via the SPI futures market. i.e. We buy BBOZ, they short the equivalent amount of SPI Futures. Its common that people who control the VAR (value at risk) of such “trading books” have a little room to try and add value around the edges but my understanding is these variations will be small and positions will primarily be covered in real-time.
BetaShares Australian Equities Bearish ETF (BBOZ) Chart
Question 5
“Hi guys, Great commentary. Level heads certainly needed this year. I realise you do not give individual financial advice. I am looking for longer term ideas for a 'fixed' income with reasonable capital security providing approx. 3-4% annual return for my last monies. I keep 30% of retirement monies in reserve, currently in Term Deposits, at 1.4%., and falling behind inflation. So, my Choices: Term Deposit...Best for 12 months seems to be about 1.65% Not/Applicable. Gov't Bonds. I had a look on the ASX, but still had no idea how to calculate return p.a. Most of the bonds I saw seem to have buy price at $125+ for a $100 face. Maybe? OTC Bonds seem to be quite inflexible, especially fluidity, compared to shares, as well as holding costs. N/A Hybrids seem to offer reasonable return of 3-4%, but no more secure than shares, though their price recovery better. Maybe? ETF with bond influence eg, IAF, composite Bonds maybe a more stable alternative to shares? Looks attractive? Usual shares not really suitable for 'reserve monies'. N/A With the recent movements, any thoughts on the above, ASX Gov't Bonds, Bank Hybrid, or ETF bond following to achieve 3-4%?” – Geoff B.
Hi Geoff,
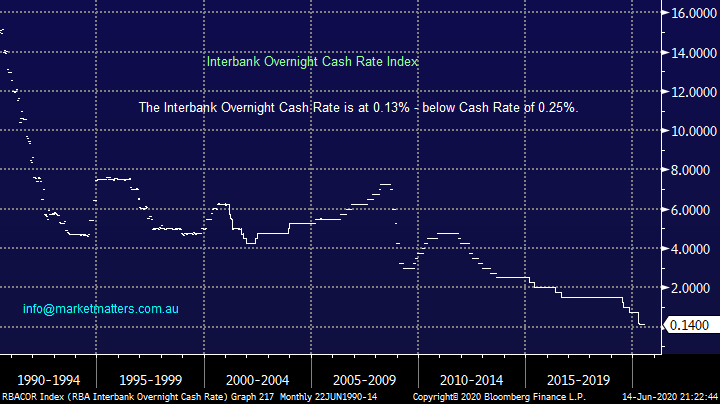
Thanks for the appreciation, with Interbank Overnight Cash rate sitting at 0.14%, well below the RBA’s Official Cash Rate it appears likely that it’s going to be long journey until the yield on cash will be vaguely enticing. A few options to consider:
As you suggest, Government Bonds are yielding next to nothing and will lose value as interest rates move higher (at some point), however we do hold a fund in the income portfolio that holds / trades Government bonds via the use of a relative valuation strategy to improve returns and reduce interest rate risk, it trades under code XARO. While the fund is only new on the ASX, the underlying portfolio / strategy has been running from 2012. This fund is expected to generate around 4% pa even though rates are low.
In Corporate Bonds, there is an Australian Corporate Bond ETF from Betashares that invests in investment grade bonds. Its tradable on the ASX under code CRED and has a current running yield of 3.44% pa and a yield to maturity of 2.66% pa. A yield to maturity lower than a running yield shows that the portfolio of bonds is trading at a premium to their issue price. The average duration of this portfolio is 7.58 years which is long. At MM, we have little interest in buying longer dated fixed rate credit at this point in the cycle.
MM likes XARO, less so CRED
Hybrids in our view offer a good alternative with tier 1 bank hybrids yielding around 4% over bank bills. We hold bank hybrids in the Income Portfolio, however there are two other good options we think for a more diversified approach. Again, Betashares run a Hybrid ETF code HBRD with a current running yield of 4.06%, while Shaw and Partners have a Hybrid SMA that I use, with a current running yield of 4.20%. It provides a professionally managed approach, its liquid and gives solid diversification, and importantly, securities are floating rate rather than fixed, which is important.
MM liked tier 1 bank hybrids
We are fans of diversification in fixed income assets however we have a clear preference for floating rather than fixed rates, or strategies that manage the likely uptick in interest rates over time.
Interbank Overnight Cash Rate Chart
Question 6
“IGL. Should we sell and realise a loss leading up to the end of the financial year? Is it a share to hang on to and/or buy back in OR are there better buys?” – Dale C.
Hi Dale,
Obviously, I cannot comment on your personal tax position with regard to tax loss selling but below is our thoughts on IGL at this stage.
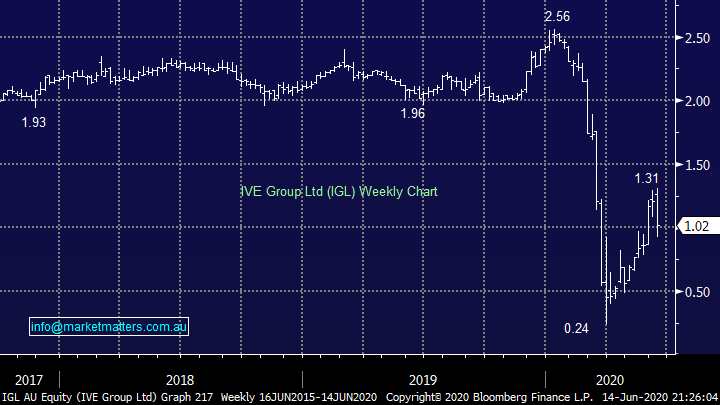
IGL also happens to be a disappointing position in our Income Portfolio and as we often say, if we look after the losers, the winners will take care of themselves. IGL is an integrated marketing business we’ve held in the Income Portfolio since mid-2018 and its showing a paper loss of ~25%. IGL were in the unfortunate position of just making an acquisition prior to COVID-19 hence the pandemic could not have come at a worse time for them, however it’s important to understand that when economic conditions improve, IGL is very leveraged to them. Their clients are blue-chip Australian corporates and if IGL can see through this difficult period, we believe they’ll be well placed on the other side.
The main risk at the moment is debt. At their last update they reported net debt of $174m, they also cancelled the interim dividend saving them $12.7m and said cash on hand was $29m, plus trade debtors exceed trade creditors by $30m. Their banking facilities were renegotiated in April 2019 and these don’t mature until 2023, they said they were within covenants however I think it’s very likely that debt will be higher than 3x net debt/EBITDA (on a rolling basis) and this is the largest market concern. While a capital raise at some point would not surprise this is a business capable of doing $50m in free cash flow per annum which is about 1/2 their current market cap, an exciting play for an economic recovery.
MM is positive IGL at current levels.
IVE Group (IGL) Chart
Question 7
“Hi James & Team, Your fundamental & technical view on the following stocks: BET, REA, AFG, FMG please.” - Thanks Sidney H.
Hi Sydney,
Please excuse the brevity but obviously this is effectively 4 questions rolled one:
1 – Betmakers Technology (BET) 40c:
I’m not a close follower of this $190m software company which develops odds comparisons & intelligent betting platforms, but it certainly has enjoyed a great rally since March advancing from 10c to over 40c. The reason for the appreciation was the announcement of an agreement with the New jersey Thoroughbred Horsemen Association and Darby Development. The stocks look a good aggressive risk / reward play while it can hold above 28c.
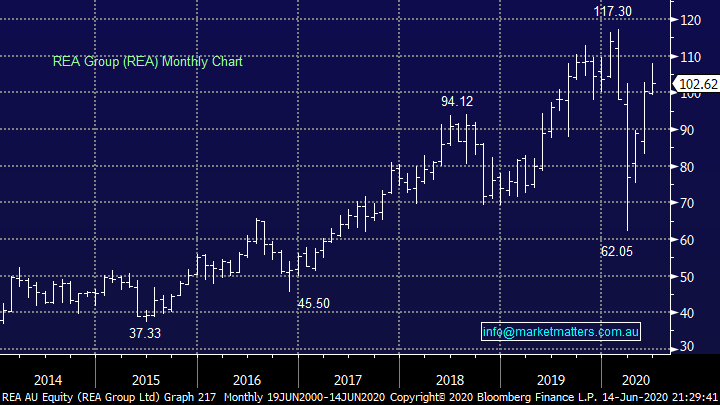
2 – REA Group Ltd (REA) $102.62:
Realestate.com is a platform that many of us look at, if only at times for casual look & feel of the local property market. We like this excellent company but after rallying more than 50% from its March low it feels on the rich side trading with a P/E over 50x. MM likes REA into weakness under $100, it looks very similar to the NASDAQ which is not a bad thing in today’s market.
3 – Australian Financial Group (AFG):
This business operates as a mortgage broker which as an industry which has experienced many twists and turns of late, the stock is still trading down ~50% from its February high. MM has this stock in the neutral corner simply due to the numbers of structural variables currently in play.
4 – Fortescue Metals (FMG) -
We are fans of this major iron ore miner but after such a stellar run by both the stock and bulk commodity we feel more comfortable adopting a patient approach looking for some better risk / reward.
REA Group (REA) Chart
Question 8
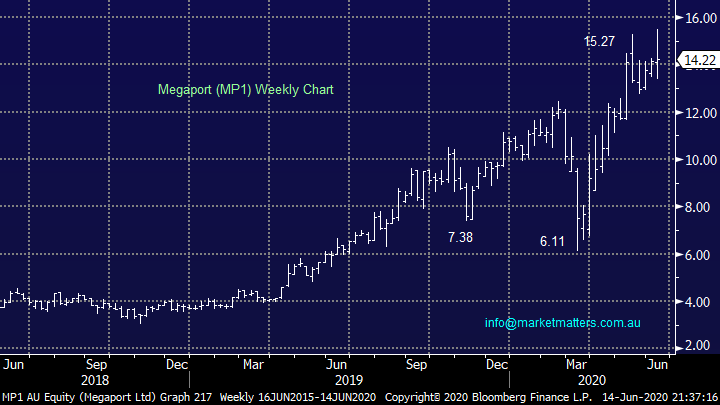
“Dear James and Team. Great informative commentary during a volatile week - well done. I’m looking at two stocks in the cloud computing space - NXT and MP1. Quite different business models but I’m concerned about NXT being capital intensive. Which company do you prefer and what is a good price entry point?” - Thank you, cheers David P.
Morning David,
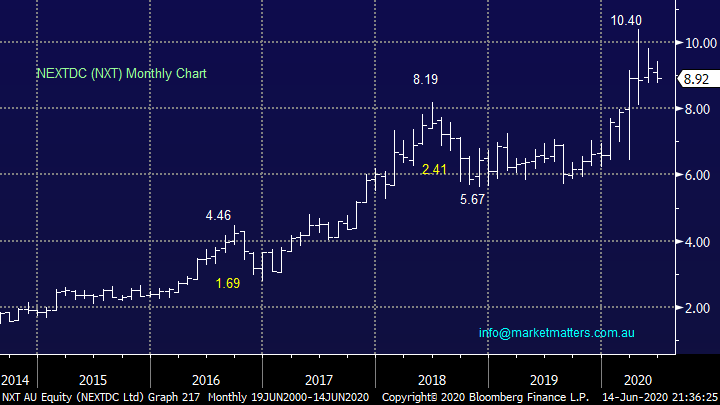
Thanks for the thumbs up we certainly are living in exciting times for equities with months of moves unfolding in just 48-hours! Both NXT (datacentres) and MP1 (elastic connectivity platforms) have clearly enjoyed strong moves in 2020 and while the upside momentum is clearly strong for both the ideal entry has become a tougher call.
Our preference is NXT as we’re believers in the company’s future growth, accumulation into any weakness below $9 feels the best approach.
MM likes both NXT and MP1.
NEXTDC (NXT) Chart
Megaport (MP1) Chart
Overnight Market Matters Wrap
- The US was higher on Friday led by the Dow and broader S&P 500 as investors continue with their bets on its economic prospects, this will likely be dampened following reports of a second wave in Beijing, traced back to a market which provides 90% of its fruit and vegetables to its city.
- The VIX (volatility) index declined 11.5% however remains above its low level of complacency.
- Dr. Copper, a measure of the global growth gained slightly, ending its session at US$260/lb., while crude oil gave back some of its recent climb as traders wait for further insight as the OPEC+ Joint Technical Committee meet on Wednesday seeking whether further output cuts would be advised before the alliance’s Joint Monitoring Committee meet the day after.
- BHP is expected to outperform the broader market after ending its US session up an equivalent of 1.5% from Australia’s previous close.
- With the US Futures opening over 1.4% lower this morning, the ASX 200 is expected to follow suit and test the 5775 level in a volatile session.
Have a great day!
James & the Market Matters Team
Disclosure
Market Matters may hold stocks mentioned in this report. Subscribers can view a full list of holdings on the website by clicking here. Positions are updated each Friday, or after the session when positions are traded.
Disclaimer
All figures contained from sources believed to be accurate. All prices stated are based on the last close price at the time of writing unless otherwise noted. Market Matters does not make any representation of warranty as to the accuracy of the figures or prices and disclaims any liability resulting from any inaccuracy.
Reports and other documents published on this website and email (‘Reports’) are authored by Market Matters and the reports represent the views of Market Matters. The Market Matters Report is based on technical analysis of companies, commodities and the market in general. Technical analysis focuses on interpreting charts and other data to determine what the market sentiment about a particular financial product is, or will be. Unlike fundamental analysis, it does not involve a detailed review of the company’s financial position.
The Reports contain general, as opposed to personal, advice. That means they are prepared for multiple distributions without consideration of your investment objectives, financial situation and needs (‘Personal Circumstances’). Accordingly, any advice given is not a recommendation that a particular course of action is suitable for you and the advice is therefore not to be acted on as investment advice. You must assess whether or not any advice is appropriate for your Personal Circumstances before making any investment decisions. You can either make this assessment yourself, or if you require a personal recommendation, you can seek the assistance of a financial advisor. Market Matters or its author(s) accepts no responsibility for any losses or damages resulting from decisions made from or because of information within this publication. Investing and trading in financial products are always risky, so you should do your own research before buying or selling a financial product.
The Reports are published by Market Matters in good faith based on the facts known to it at the time of their preparation and do not purport to contain all relevant information with respect to the financial products to which they relate. Although the Reports are based on information obtained from sources believed to be reliable, Market Matters does not make any representation or warranty that they are accurate, complete or up to date and Market Matters accepts no obligation to correct or update the information or opinions in the Reports. Market Matters may publish content sourced from external content providers.
If you rely on a Report, you do so at your own risk. Past performance is not an indication of future performance. Any projections are estimates only and may not be realised in the future. Except to the extent that liability under any law cannot be excluded, Market Matters disclaims liability for all loss or damage arising as a result of any opinion, advice, recommendation, representation or information expressly or impliedly published in or in relation to this report notwithstanding any error or omission including negligence.


