Subscribers questions (FMG, CNEW, CQQQ US, AUZ, WPL, GXY, HVN, NAB)
LOCAL REPORTING CALENDAR: CLICK HERE **Please note, data sourced from Bloomberg, not all ASX companies are on this list and dates can vary**
Today we have results from CLW, GPT, AZJ & ADH, I focus on CLW & GPT. in the recording below.

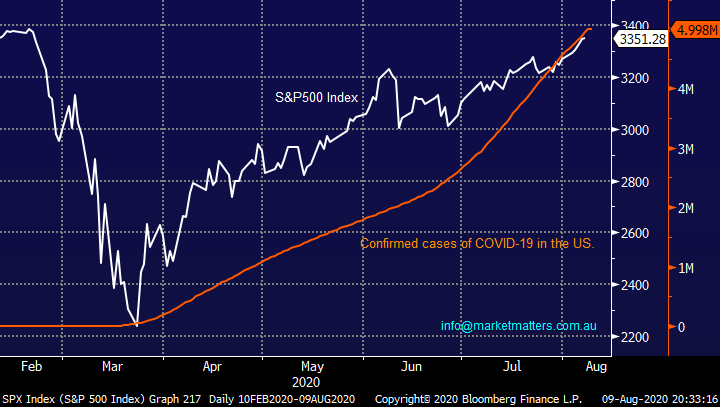
The financial news is dominated by a combination COVID-19 and / or the latest round of one upmanship between the US & China however the chart below illustrates that although it makes interesting and at times scary reading equities simply don’t care! While stocks continue to adopt the “don’t fight the Fed” attitude it’s almost a case of the worse the news the more bullish it becomes for shares i.e. the US has seen the number of new cases of COVID-19 increase at more than 1 million per month since March yet stocks have rallied at over 10% per month during the same period.
One glimmer of hope in the bigger picture comes from Sweden whose basically “business as usual” attitude to the initial breakout back in March is appearing to pay dividends with Stockholm close to reaching the herd immunity milestone. Sweden’s 5763 deaths for a population of over 10 million is not a disaster considering the approach taken by the Scandinavian nation and if a vaccine does prove impossible this is the inevitable route that we will have to follow, as opposed to the open-close-open-close frustrating and economically crippling cycle. Perhaps Sweden’s belief that the “fight against the virus is a marathon not a sprint” will prove correct, at least we know there is a manageable if far from ideal alternative.
I listened to an interesting 10-min podcast from Bill Gates over the weekend, remember he forecast the increasing likelihood of a global pandemic years ago. I was comforted to hear him say that we will be largely free of the pandemic by late 2021 through a combination of herd immunity, therapeutics cutting the death rate and a vaccine – however he did send a chill down my spine when he pointed out how lucky we’ve been this time around that the virus wasn’t a more fatal disease.
We believe the bad news from the coronavirus is built into stocks, hence the surprises are more likely on the upside.
Confirmed cases of COVID-19 in the US v S&P500 Index Chart
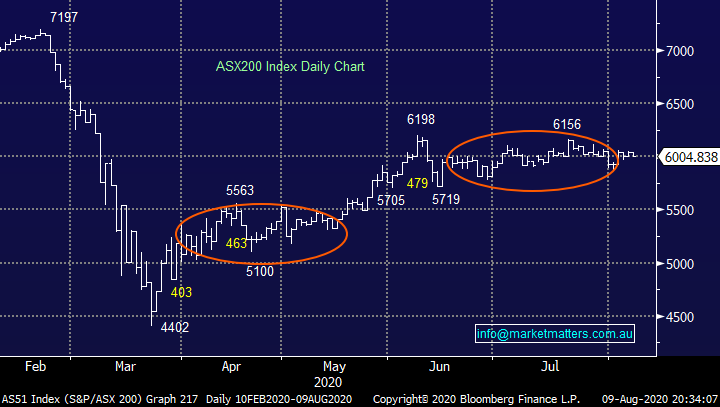
The SPI Futures are calling the local market to open strongly this morning following the solid advance by the financials in the US on Friday, far more relevant to the ASX than the likes of Facebook, Apple, Amazon etc. The local index is glued to the 6000 area but we continue to believe it’s a matter of time before we see an assault on the 6500 region, but attempting to identify when has proved akin to a coin toss.
MM remains bullish Australian stocks medium-term.
ASX200 Index Chart
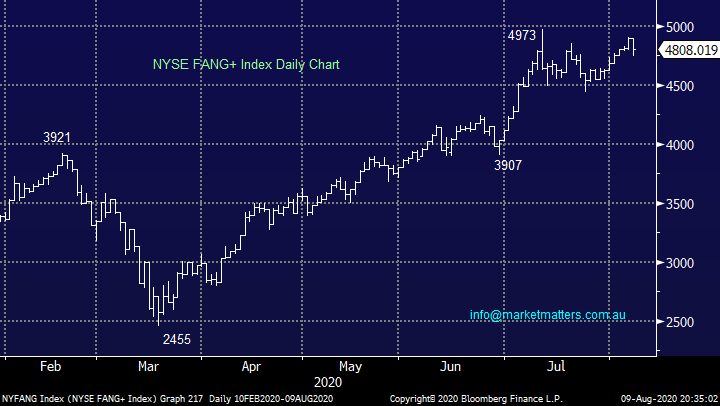
Last week we saw Apple (AAPL US), Microsoft (MSFT US) and Facebook (FB US) all make fresh all-time highs while the FANG’s Index fell just short of the same milestone, we feel its likely to kick the goal this week – remember the trends your friend! Pundits have been preaching the US tech sector is overpriced for many months, even years now but its proved a costly miss for many, at MM we remain bullish however we feel the sectors massive outperformance may be coming to an end.
MM likes the US tech space, short-term we still see another ~5% upside.
NYSE FANG+ Index Chart
Thanks again for the much-appreciated questions, a few less than usual but with Melbourne in lockdown and the rest of Australia nervous it’s no surprise, thanks and keep safe.
Question 1
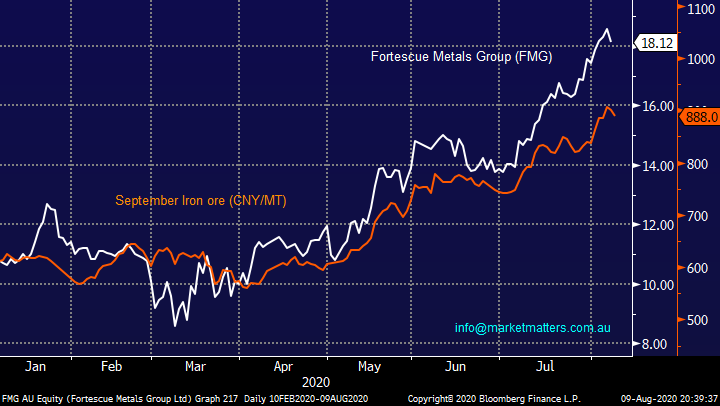
“Hi MM Team MM remains bullish commodities & the “reflation trade”. Can you please re-affirm these views in regards to FMG - Current Price $18.12 (YTD High $18.64). Would you continue to hold thru reporting period and dividend payout? When you read the following views: "However, given what we view to be emerging downside risks to the iron ore price and that, from our analysis, the current FMG share price implies the iron ore spot price will remain at these levels for the next three years, we are taking the view that FMG is indeed priced for perfection. While we regard a healthy final dividend (BPe A91cps) as locked in, we believe the downside risks around the iron ore price and FMG going ex-dividend (likely early September) are insufficient compared to our underlying valuation to justify holding through to those catalysts. We lower our recommendation to sell. " TP $12.50” - regards Debbie G.
Morning Debbie,
Fortescue Metals (FMG) has certainly been in the limelight through 2020 and as you rightly point out a number of analysts are saying its “very rich” at current levels although I would caution that I haven’t read many of them call iron ore to scale its current heights through 2020 – consensus Iron Ore price forecasts for calendar year 2020 are $US90, dropping to $US78 for CY21 & $US67 in CY22.
Our outlook for Fortescue (FMG) is as a follow:
1 – We remain overall bullish the iron price as China looks to stimulate its economy although pullbacks are inevitable as in all markets. Last August the Iron Ore price fell ~40% in a month.
2 – I’m sure FMG will have another $1.50-$2 (around 10%) retracement before Christmas, after all it is historically a volatile stock. We would still be looking to buy such pullbacks as opposed to selling weakness however taking some ‘off the top’ for existing longs makes sense here
Whether FMG corrects after its result or later in the year is impossible to know without prior knowledge of its result but I feel at the moment the biggest risk is losing a position in the middle of a strong bull trend. Whether investors should consider taking part profit comes down to their individual portfolio construction, we recently trimmed our OZ Minerals (OZL) although we remain bullish, it was in our case a scenario of too many eggs in the one basket.
MM remains bullish FMG and the reflation trade.
Fortescue Metals Group (FMG) v September Iron Ore (CNY/MT) Chart
Question 2
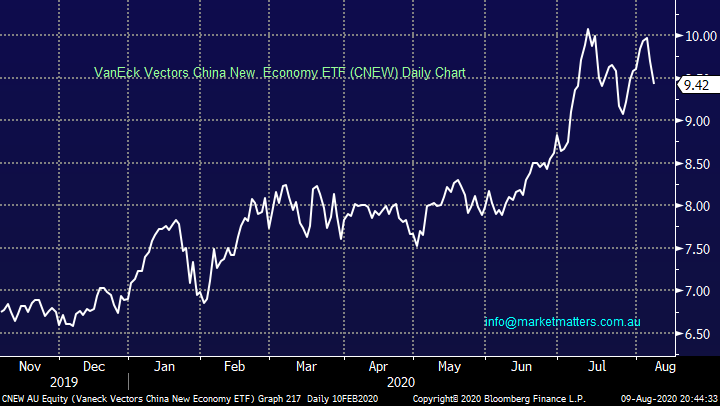
“Hi James, In question 5 the reader asked about exposure to Chinese tech stocks though an ETF. While not exclusively a tech ETF perhaps the VanEck China New Economy ETF (ASX CNEW) gives reasonable exposure to China tech, perhaps biased to biotech?” - Cheers, Rob M.
Morning Rob,
Undoubtedly an option although I felt last week’s question was more directed towards traditional tech as opposed to biotech, in other words Chinese companies which are going to challenge the US FANG’s over the years ahead. A quick comparison of the 3 products mentioned will allow subscribes to evaluate which best serves their needs remembering we do like the Chinese tech space:
1 - The unleveraged iShares MSCI China ETF (MCHI US) is a good US traded vehicle to play a bullish outlook for Chinese stocks, it has a market cap of $US5.8bn and it tracks the top 85% of Chinese stocks, not just tech.
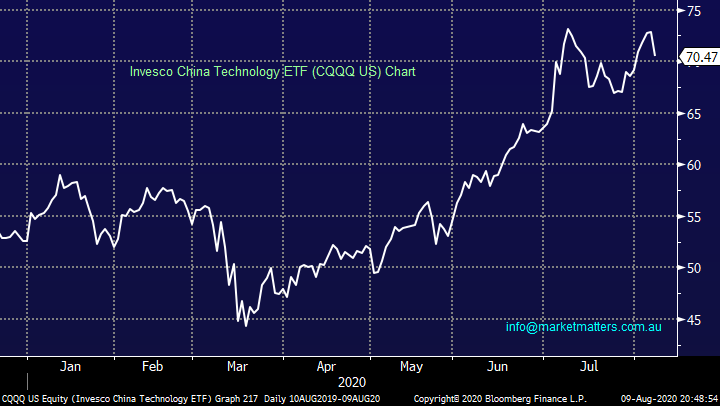
2 - The Invesco China Technology ETF (CQQQ) is also a good US traded product with a market cap of $US951m which tracks China’s IT stocks – currently Tencent Holdings (700 HK) makes up ~10% of this ETF.
3 – The VanEck China New Economy ETF (CNEW) is traded in Australia which some subscribers may prefer but it only has a market cap of $A112m plus a focus on growth stocks, not necessarily in the IT space – currently its almost 17% in the pharmaceuticals sector compared to ~8% in electronics.
MM likes all 3, the ideal selection depends on an investors view on markets.
VanEck Vectors China New Economy ETF (CNEW) Chart
Invesco China Technology ETF (CQQQ US) Chart
Question 3
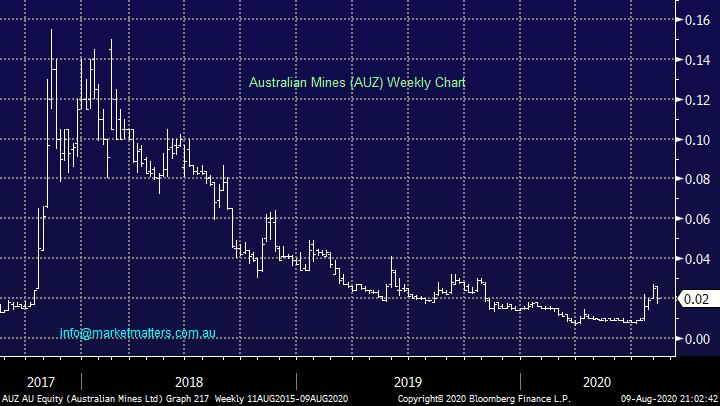
“Could you please advise on AUZs recent bounce upward? Temporary or Sustainable?” - Louis W.
Morning Louis,
Australian Mines (AUZ) is a small resources company on the ASX, it has a market cap of $73m and a business which produces and supplies battery and technology metals to global markets. As we can see from the chart below its had numerous attempted recoveries over the last few years but all to no avail. The only way I could quantify the risk / reward with AUZ is with technical analysis and as such I would have “stops” under 1.4c.
MM is neutral AUZ.
Australian Mines (AUZ) Chart
Question 4
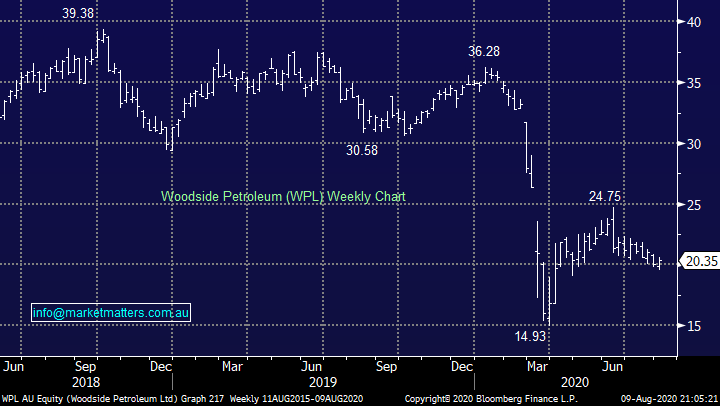
“Hi James, I cannot understand why you would cut WPL (5 Aug 2020) and crystallise a 35% loss. Please explain.” - Cheers Geoff S.
Morning Geoff,
Cutting losses is a very important part of investing probably the area where most of us struggle the most. We are considering cutting the WPL position only in our Income Portfolio before the company reports because we can see better alternatives elsewhere when yield is our primary focus. That call does not suit our growth portfolio, and it may not suit individual investors goals, however at MM we simply write about what we are doing on our various portfolios.
MM is neutral WPL short-term.
Woodside Petroleum (WPL) Chart
Question 5
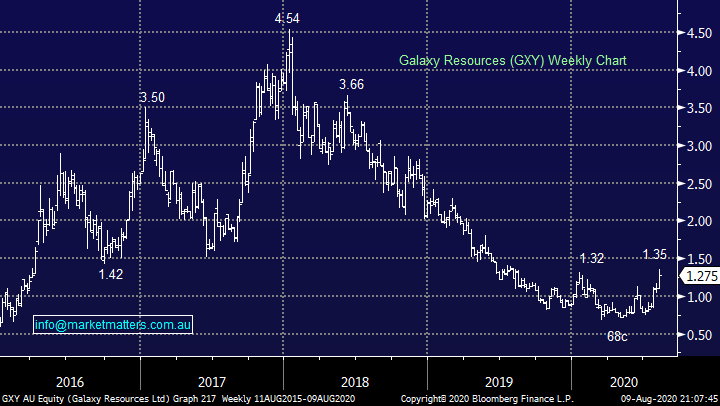
“Hi James, thanks for the market commentary. Last time I asked you about Galaxy Resources (GXY), you forecast a price around 1.30's. It has hit that point. Have there been developments that may justify another leg up over the next couple of months or should I just take profits and scamper away?” - Regards Ram.
Hi Ram,
Galaxy Resources (GXY) is a volatile beast and I’m glad you have some paper profits to savour, a quick glance at the chart below illustrates you are in the minority! Technically I would have stops under $1.10 hence the risk / reward is not exciting around $1.30 but there does always exist for a sharp short-covering rally i.e. 7.24% of the stock is currently short sold. I know this sounds a touch non-committal but it’s the nature of the stock.
MM is neutral GXY at current levels.
Galaxy Resources (GXY) Chart
Question 6
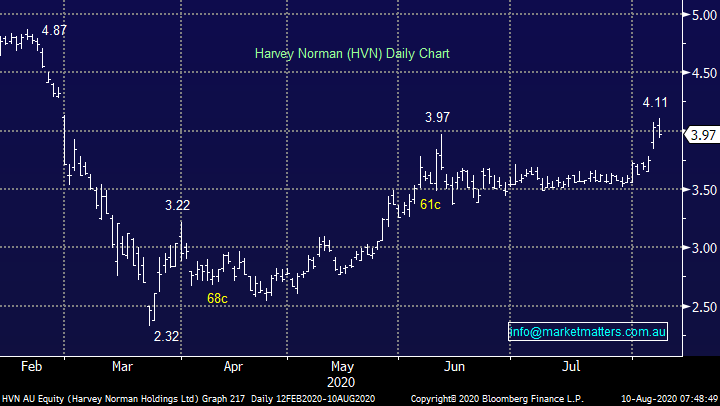
“Hello James and Team, Could you help me out and explain what you mean by the line you used in the paragraph looking at Harvey Norman. “we would now advocate stops on longs under $3.90”.Here’s my attempt: You would be happy to buy, even at the current price of say, $4.03, but if it drops to $3.89 you would sell your entire parcel, however if it fluctuates and drops to $3.91 you would still consider buying in o average lower. Am I getting warm?” - Cheers, Alan P.
Morning Alan,
A great question that may assist a number of subscribers understand our thoughts:
1 – After breaking out above $4 last week following Nick Scali’s positive outlook on furniture retail the stock has achieved our flagged short-term goal.
2 – HVN is due to report its full-year numbers at the end of August but the problem is with the recent move a degree of optimism is clearly already built into the share price.
Its hard now to quantify the risk / reward because a sharp move is likely after the company reports but in these situations we rely on the technical picture as it has a habit of pre-empting news flow hence if the breakout in HVN fails and the stock falls under $3.90 we would prefer to be out of the position.
MM is net bullish HVN with close stops.
Harvey Norman (HVN) Chart
Question 7
“Hi James, Good calls on the currency and Gold, when it comes to Australian gold stocks, can you provide a list of the Australian gold miners who have either forward sold at lower gold prices or alternatively companies who’s policy it is to produce and sell at the current/spot gold price.” - Regards, Brendan M.
Hi Brendan, this is a very good question and I’ll try to do an update with Peter O’Connor at Shaw soon, plus we have a new analyst in the small cap resource space which I’ll rope in – stay tuned.
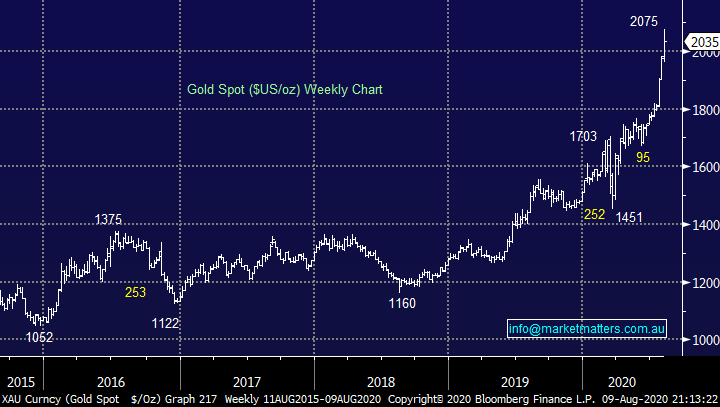
Gold is getting so much press its worrying me, as subscribers know we are looking for a pullback to ~$US1975 before establishing a long position. In terms of hedging many companies have missed out on a significant portion of golds huge appreciation which has been fuelled by coronavirus inspired economic uncertainty, a falling $US, negative real interest rates and more rising US-China tensions, because they hedged their production too early. Some examples:
Regis Resources (RRL) has a huge hedge position ~$1614, painful when the precious metals is over $US2000/oz – predicted to be a revenue hit of ~6%. Conversely market favourites Northern Star (NST) and Evolution (EVN) have hedged lower amounts at higher prices hence the share outperformance – NST hedge book 2-years out is above $US2,000/oz which is impressive. Newcrest (NCM) is partially hedged around $US1875, pretty good levels considering the last decade.
Obviously when golds hot like today being unhedged is the way to be but history tells us picking the twists and turns of the precious metal is a tough ask and a degree of hedging is prudent.
MM likes gold back under $US2000/oz.
Gold Spot ($US/oz) Chart
Question 8
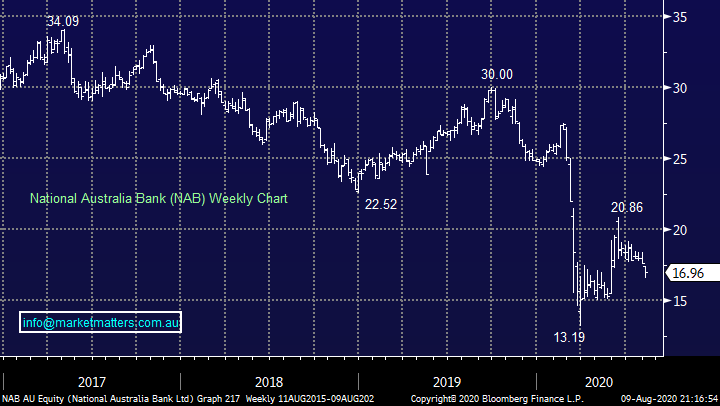
“Hi James, is NAB a buy as it dives below $17? If nothing else, can the dividend be a consolation price? What is the benefit of buying hybrids instead of buying the underlying shares?” - Thanks Regards Ram.
Hi Ram,
In our opinion National Australia Bank (NAB) is representing good value at current levels although we do still prefer Commonwealth Bank (CBA) hence it’s our main sector holding. The market is focused on potential bad debts at present, Victoria is front and centre in people’s minds, also there’s the Q of how badly will the economy suffer once the JobKeeper finishes plus of course can NSW, QLD et al avoid a 2nd wave of the virus – a scary combination.
We like the banking sector over the next 12-18 months in-line with our reflation trade viewpoint but the downtrend is entrenched so we should be cognisant that surprises often unfold with the trend. Dividends are far from guaranteed for the bank shares in today’s environment whereas with Hybrids the confidence of income can be significantly higher.
MM likes the Australian Banking Sector.
National Australia Bank (NAB) Chart
Have a great day & week!
James & the Market Matters Team
Disclosure
Market Matters may hold stocks mentioned in this report. Subscribers can view a full list of holdings on the website by clicking here. Positions are updated each Friday, or after the session when positions are traded.
Disclaimer
All figures contained from sources believed to be accurate. All prices stated are based on the last close price at the time of writing unless otherwise noted. Market Matters does not make any representation of warranty as to the accuracy of the figures or prices and disclaims any liability resulting from any inaccuracy.
Reports and other documents published on this website and email (‘Reports’) are authored by Market Matters and the reports represent the views of Market Matters. The Market Matters Report is based on technical analysis of companies, commodities and the market in general. Technical analysis focuses on interpreting charts and other data to determine what the market sentiment about a particular financial product is, or will be. Unlike fundamental analysis, it does not involve a detailed review of the company’s financial position.
The Reports contain general, as opposed to personal, advice. That means they are prepared for multiple distributions without consideration of your investment objectives, financial situation and needs (‘Personal Circumstances’). Accordingly, any advice given is not a recommendation that a particular course of action is suitable for you and the advice is therefore not to be acted on as investment advice. You must assess whether or not any advice is appropriate for your Personal Circumstances before making any investment decisions. You can either make this assessment yourself, or if you require a personal recommendation, you can seek the assistance of a financial advisor. Market Matters or its author(s) accepts no responsibility for any losses or damages resulting from decisions made from or because of information within this publication. Investing and trading in financial products are always risky, so you should do your own research before buying or selling a financial product.
The Reports are published by Market Matters in good faith based on the facts known to it at the time of their preparation and do not purport to contain all relevant information with respect to the financial products to which they relate. Although the Reports are based on information obtained from sources believed to be reliable, Market Matters does not make any representation or warranty that they are accurate, complete or up to date and Market Matters accepts no obligation to correct or update the information or opinions in the Reports. Market Matters may publish content sourced from external content providers.
If you rely on a Report, you do so at your own risk. Past performance is not an indication of future performance. Any projections are estimates only and may not be realised in the future. Except to the extent that liability under any law cannot be excluded, Market Matters disclaims liability for all loss or damage arising as a result of any opinion, advice, recommendation, representation or information expressly or impliedly published in or in relation to this report notwithstanding any error or omission including negligence.


