Subscribers questions (FLT, IFM, PHB, CV1, GDX, JMS, PLS, FMG, NBI, MXT)
The ASX200 ground higher last week as the news on US – China trade improved almost daily throughout the week. The Chinese summed up my initial feelings perfectly with their official response to “phase one”, they’re wary but overall welcomed the outcome at the end of the day. If the new Asian economic super power wants to relieve some pressure from its slowing economy it needs to find some degree of balance with President Trump. Conversely the volatile US president has an election looming in 2020 hence to him the public’s perception of his image as a powerful leader on the global stage is almost as important as the outcome.
Over the weekend we saw little major news except property prices continuing to improve strongly with plunging interest rates improving buyers confidence into the end of 2019, a number of auction results in Sydney actually came in significantly above their reserve. Interestingly we have property prices rallying back towards their all-time high just as markets are expecting the RBA to cut rates down to 0.5% in the coming months, potentially they might be fuelling another property bubble in 2020 but it may be the only way to get the Australian consumer back out spending.
No change, MM remains comfortable being relatively defensive, at least for a few more weeks.
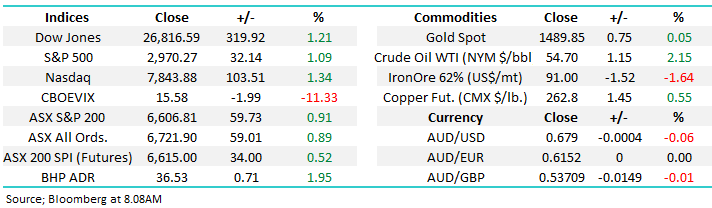
This morning the SPI futures are pointing to an opening for the ASX200 up around +0.5%, BHP rallied over 2% in the US implying that resources will lead the line at the start of this 3rd week in October.
Thanks for the questions as always, a few took us into pastures new which is always refreshing.
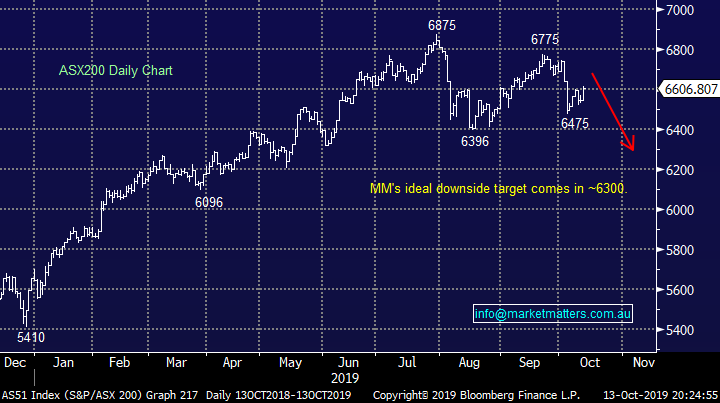
ASX200 Index Chart
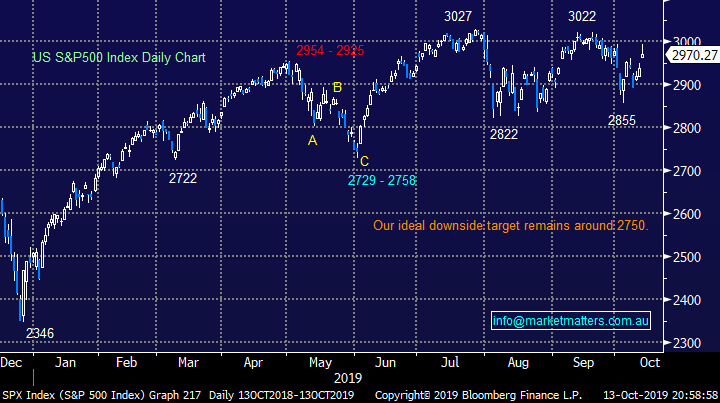
US stocks continue to trade in a very choppy manner, last week they registered small gains but interestingly they closed near their weekly low even after the trade deal was announced - a close under 2950 will generate sell signals for MM in the S&P500 cash.
While our preferred scenario is US stocks will correct in the coming weeks I reiterate there are no sell signals in play, it’s more of an ongoing “Gut Feel” at this stage.
US S&P500 Index Chart
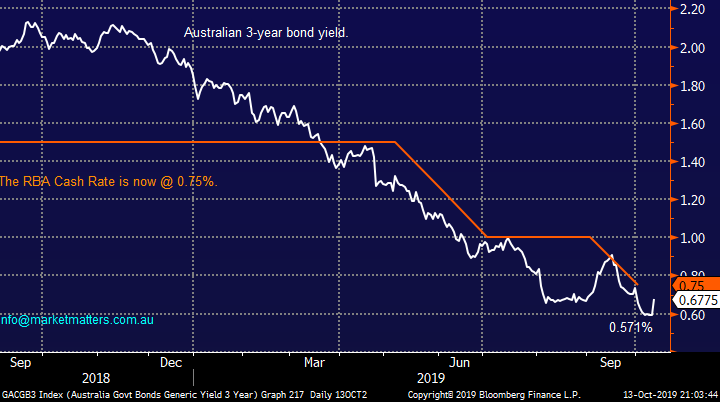
The chart below illustrate Australian bond yields recently making fresh all-time lows following the RBA’s rate cut to 0.75%, markets are continuing to target a drop to 0.5% in the months ahead as the Australian central bank appears to be using up all its monetary ammunition in an effort to revitalise our economy – might just be working looking at housing prices.
MM believes rates may be reaching the nadir on the downside.
Hence we can see a market move from growth back to cyclicals with a potential dramatic unwind of the entrenched “buy growth” theme.
Australian 3-year Bond Yields Chart
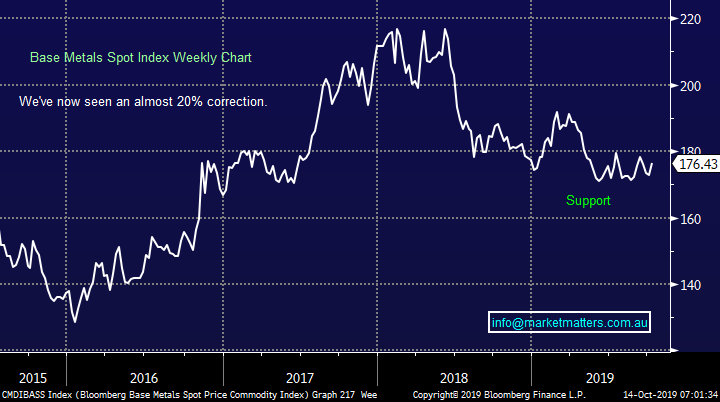
As we touched on in previous reports MM is becoming increasingly positive on base metals after their ~20% correction. Last weeks initial agreement on trade between the US and China might just be the catalyst to trigger a recovery in these industrial metals.
MM is bullish base metals at current levels.
Hence we are looking to buy OZ Minerals (OZL) today.
Bloomberg Base Metals Index Chart
Question 1
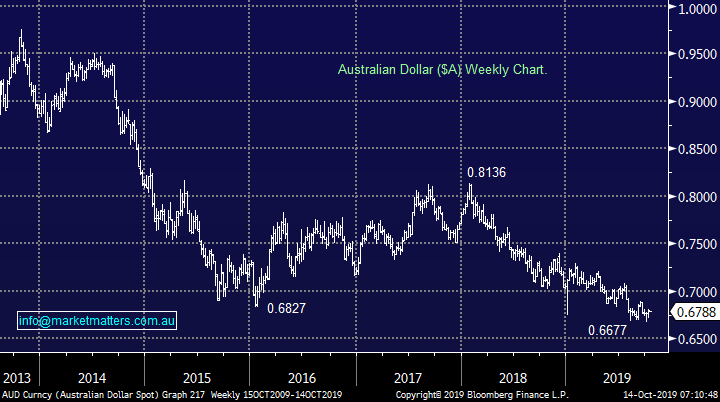
“Hi MM Team, given your contrarian bullish view of the AUD$, how do you intend to manage currency risk in your International Equities Portfolio. For example, a 15% appreciation in the AUD$ could dramatically affect the performance of the US$ securities (in Aussie dollar terms).” - regards Scott T.
Morning Scott,
Thanks for the great question which I will answer from a simple practical standpoint. At this stage we have 4 portfolios at MM:
1 Platinum & Income Portfolio – these portfolios are reflected / mirrored as closely as is practically possible in the MM SMA’s, we also invest MM’s money in the Growth Portfolio – more information on our SMA’s can be found here https://www.marketmatters.com.au/news/sma/
2 Overseas & Global Macro ETF Portfolio’s – at this stage these are theoretical portfolios.
Hence to answer your question which refers to our “theoretical portfolio” :
If we invest a substantial % of funds in $US stocks we will consider hedging with an $A ETF (BetaShares Strong AUD), currently a large position in our Global Macro ETF portfolio. However at this stage we have under 20% exposure to the $US so it’s not too worrying but the $A ETF may well pop up in the International Portfolio in the future as a simple currency hedge.
The Australian Dollar ($A) Chart
Question 2
“Hi MM Love your work. Reading the FLT latest announcement ,what am I missing that the market doesn't like.? Will you be providing some feedback on why the share price is being hammered.” – Danny W.
Morning Danny,
Firstly thanks for the thumbs up!
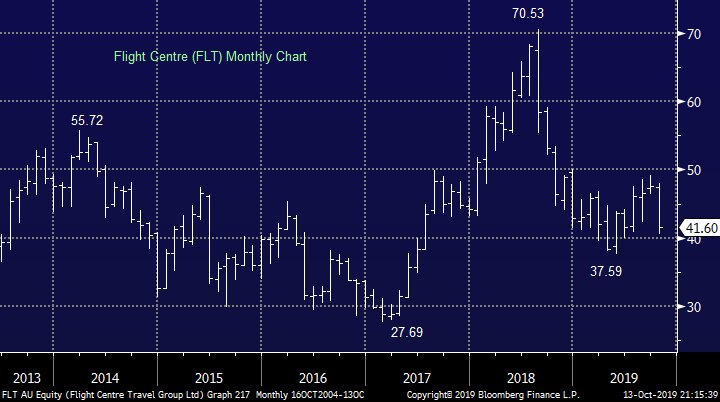
Flight Centre (FLT) has indeed endured a very tough month falling well over 10% following a disappointing trading update. The company announced they were experiencing subdued trading in both Australia and the US , while BREXIT uncertainties were creating a headwind in the UK. Short term the company needs the consumer confidence lift in property to flow through into discretionary spending.
The major issue was analysts were anticipating ~10% growth for the business hence the announcement which implies no growth was a clear slap in the face for their forecasts, the shares have only really fallen by the apparent degree of the “miss”. Any future periods when recession concerns pick up momentum are also likely to be bad news for businesses like FLT chasing the consumers spare dollar. They said they would provide guidance at their AGM in November which we’ll sit and wait for before looking at FLT again.
FLT feels like its trading around the correct level but technically we can see another 10% downside.
MM likes FLT into fresh 2019 lows.
Flight Centre (FLT) Chart
Question 3
"Hi James & team, 1) what is your opinion on the upcoming KKR credit income fund? How would you rank it among the other income funds, such as MXT, GCI, NBI, PL8 in descending order of safety? 2) What do you think of the following 3 stocks recommended to me? IFM, PHB AND CV1?” - Your assistance is much appreciated, Sidney H.
Hi Sidney,
A fairly large question hence I will split into 2 halves: The first part RE MXT, GCI, NBI and PL8 I will take on notice and address in this weeks income note on Wednesday.
The 3 other stocks you’ve mentioned are not on our day to day watch list hence we’ve skewed our opinion from a technical perspective:
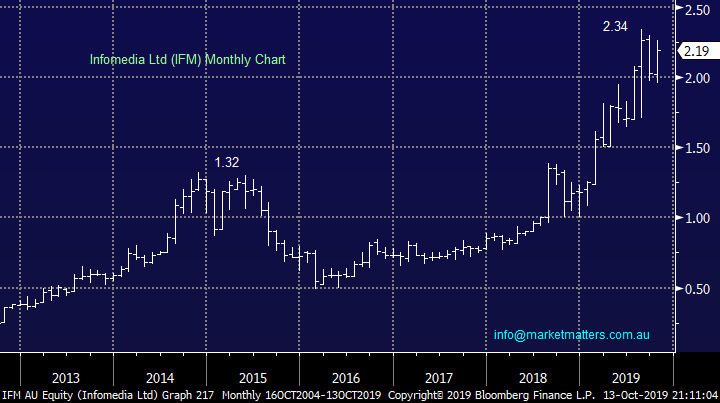
Infomedia (IFM) $2.19 – this business supplies and develops electronic parts catalogues for the auto industry, it currently has a market cap of almost $700m. The company delivered some excellent numbers in August with revenue up 16%, earnings per share up 25% while its dividend increased 26% making this debt free business look attractive. Unfortunately it’s definitely not cheap above $2 leaving it hard to chase from both a and technical & value perspective.
Technically IFM looks good to MM with it likely to test the $2.50 area, this would enable technical traders to raise stops to ~$2.30.
Infomedia Ltd (IFM) Chart
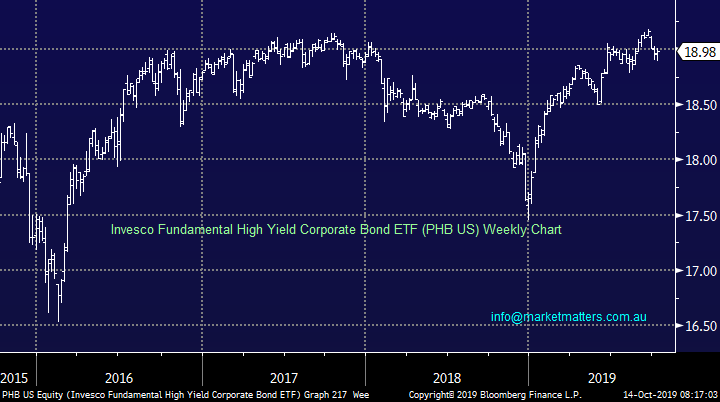
PHB $US18.98 – This “Junk Bond” ETF is neutral to us as it hovers around its post GFC high, a sniff of inflation & / or increasing rates and its likely to come under significant pressure. On face value, Junk Bonds are a riskier end of the market at this stage of the economic cycle, where the hunt for yield is putting downward pressure of rates which in a lot of cases are not pricing in the underlying risks of the investment. The chart below shows the volatility in bonds in December when equity markets fell. Bonds should be more defensive than the chart below implies.
Invesco High Yield Corporate Bond ETF (PHB US) Chart
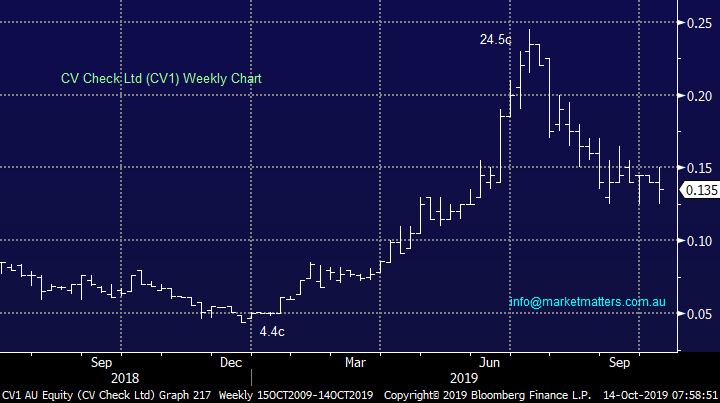
CV Check Ltd (CV1) 13.5c - this screening and verification company only has a market cap of $39m and its trading in the middle of its 2019 range and hence neutral to MM.
CV Check Ltd (CV1) Chart
Question 4
“H Market Matters, LOVE your work!! Listening now to the 47 minute Video by James Gerrish. Exceptional content!!! Many thanks!” – Mathew C (Hill Capital).
“Hi guys. Sorry but must be dumb as cannot find the video of today about lics with Hamish. Can you please advise how I do this” - thanks Ian H.
Hi Guys,
Firstly thanks again for the thumbs up! Here is the video for those that may have missed it - CLICK HERE or on the image below
Question 5
“Good morning. Can you advise what is happening with GDX at the moment? Commsec showing last price as $0.” - Regards John V.
Hi John,
They are changing from being a CDI of a US Fund listed on the ASX to being an Australian denominated fund listed on the ASX. Paperwork would have been sent to all holders about the change. Essentially, the fund will re-list under the same code, with the same assets, it will simply be an easier way for local investors to put money into the fund without the paperwork from overseas.
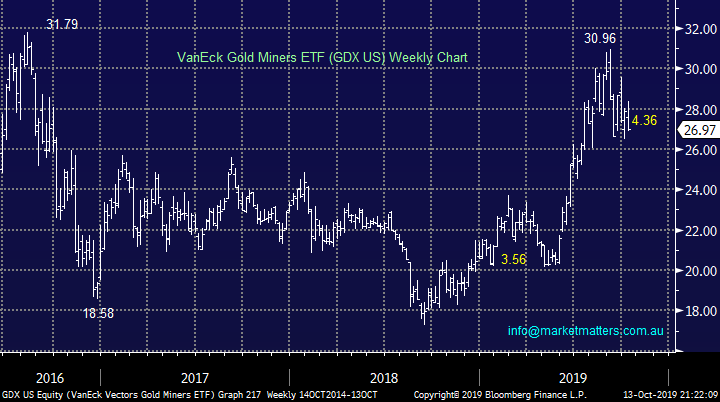
Below is the GDX which is traded in the US on Friday night - it was down slightly in-line with the underlying gold price.
MM remains bullish the GDX looking for fresh 2019 highs.
VanEck Gold Miners ETF (GDX US) Chart
Question 6
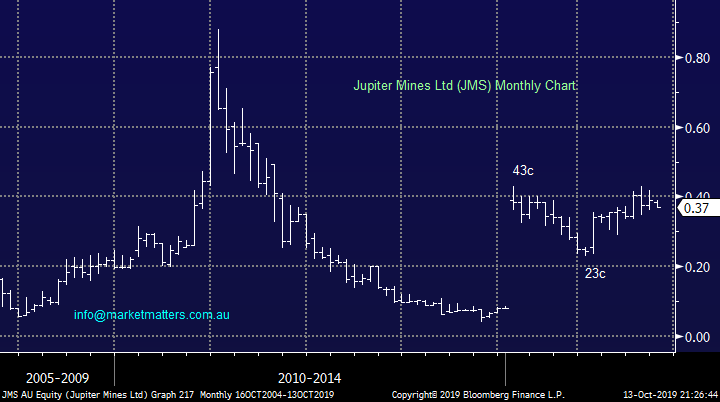
“Hi James, I have been following and investing in Jupiter Mines for a while now (I bought at 33c). It has a dividend yield on current price of about 19%. It seems to be an excellent company with no debt, good cash flow and has as chairman Brian Gilbertson, very well known in the mining industry. Any thoughts on this company? The only negatives I see is that it has less than 50% in Tshipi mine and basically a single product. It seems to have a very successful BEE partner but obviously South African mining has a very bad name at this stage (I am from South Africa originally and it’s not so bad there as it seems!).” - Kind regards Manie M.
Hi Marnie,
Relisted manganese miner Jupiter Mines (JMS) saw UBS sell a $89m stake in the business for Investec last month, a fairly big position for a $725m company. The stock was crossed at 34c suggesting an area of support for the WA based company. This is another stock we will use technicals on as a track record of operations is relatively thin on the ground.
MM is technically positive JMS with stops below 33c.
Jupiter Mines Ltd (JMS) Chart
Question 7
“Hallo James, I don't understand the 2nd line under "Materials Index". Why would you expect the resources stocks to recover if low bank rates fail to stimulate growth?” – Nick A.
Hi Nick,
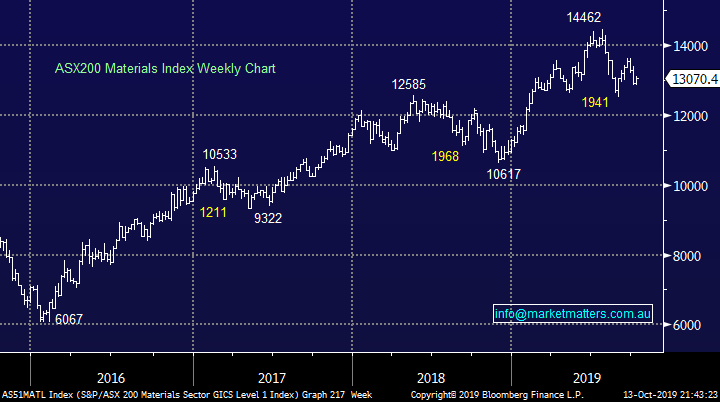
Sorry for the confusing read (see below), I can see where you’re coming from. Basically we feel that central banks are about to unleash aggressive fiscal stimulus on top of the recent monetary efforts (low interest rates) and it’s this government spending plus the signs of a US – China truce that will reignite the resources sector after its more than 13% correction.
“The Materials (Resources) Index is a huge group within the ASX200 with a market cap of $330bn, its headed by the likes of the BHP Group and RIO Tinto. At MM we have been looking to increase our exposure to the resources sector moving forward as we anticipate global stimulus to come back with a bang as rate cuts fail to underpin decent growth .”
MM is looking to buy resource stocks.
ASX200 Materials Index Chart
Question 8
“Hi, James, Harry & the Market Matters Team. Enjoy reading your ’down to earth’ commentaries. Noted the following correction to your **Correction – Pilbara (PLS)**” – Mike H.
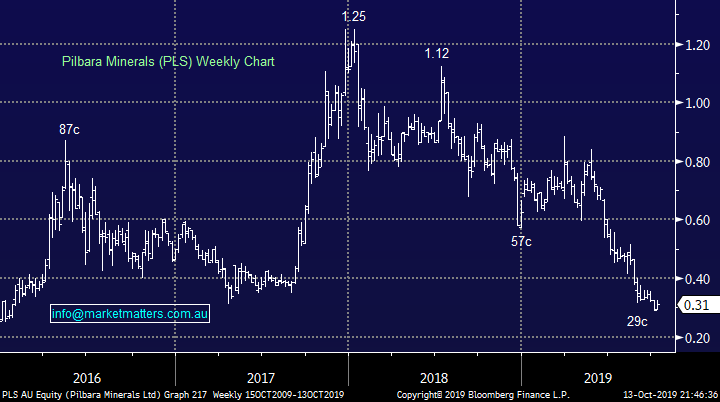
**Correction – Pilbara (PLS)** In yesterday’s morning note (click here) we mentioned the Pilbara Mineral (PLS) share purchase plan writing that under the SPP, holders could purchase stock at the lower price of 30cps or a 10% discount to the 5 day VWAP during the offer period (which closed this afternoon). In fact, it should have read a 1.0% discount, not a 10% discount. The pricing period closed this afternoon with the 5 day VWAP being 30.55c, hence we would expect the SPP to be priced at 30.25c
The lower price is 30cps
Thanks for the positive feedback, much appreciated. Yes, clearly an error on top of an error! Sorry, it clearly should say the SPP will be priced at 30cps.
Pilbara Minerals (PLS) Chart
Question 9
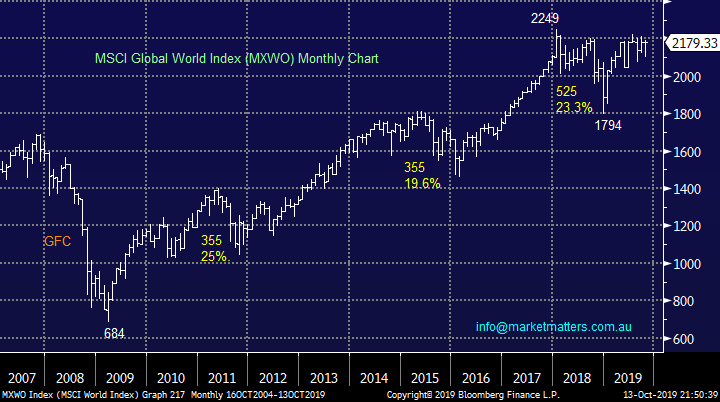
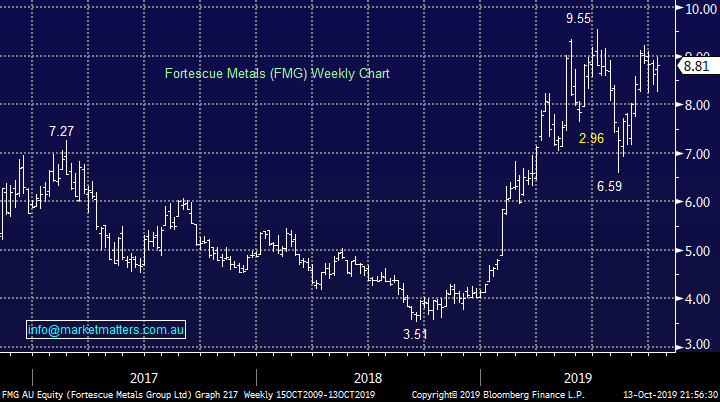
“Hi, as an old manual chartist before the digital era, I would like your comments on The Chart you published this weekend "MSCI Global World Monthly Chart" To me it shows a Head and Shoulders pattern nearing completion which is a bullish pattern and would support your thoughts on the Resource Sector for 2020 and maybe forecasting good results in the US/China trade war for the betterment of the global economy. FMG chart is showing similarity” - Yours an 88 yr. old Clive B.
Hi Clive,
Subjective charting is always open to debate / different interpretation, its one of the reasons it’s fun as well as very useful tool when combined with some decent risk / reward mechanics. I can certainly see what you are suggesting which, for the MSCI implies a break of 2249 would bring a target of 2714 in to play.
RE FMG, we do like Fortescue (FMG) and a test of $10 looks a strong possibility our end, however the head and shoulders pattern you suggest would imply a more bullish target.
MSCI Global World Index Chart
Fortescue Metals (FMG) Chart
Question 10
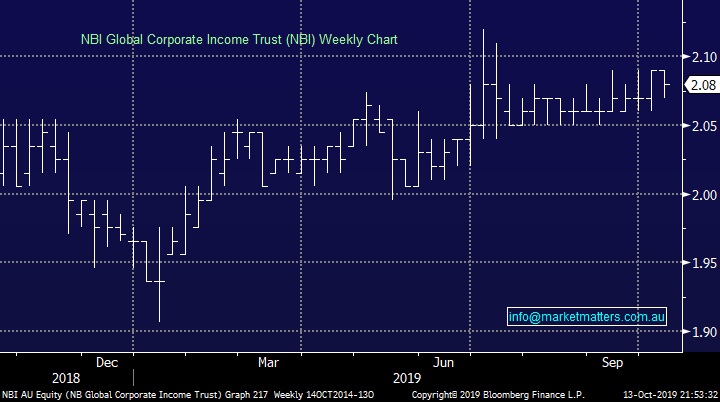
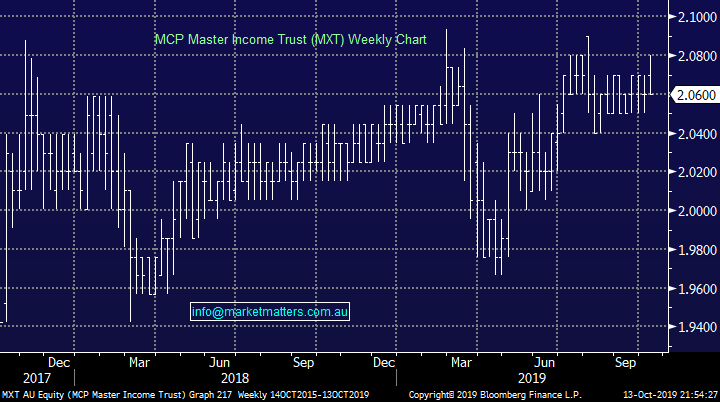
“Hi James just a question on two investments in the MM Income portfolio, NBI and MXT. Both appeal but both now trading 4% above NTA. With low returning fixed interest funds like these I guess I need to wait for the prices to come back a bit. What would MM consider I should be targeting as my entry price?” - Marvin C.
Hi Marvin,
Yes, ideally waiting to get these closer to NTA would be optimal. Both of these funds have raised money in the past, which we have participated in, and these raisings are done at NTA. I’m not sure of any imminent plans for either of these to raise funds, however there are others that could do this. In this weeks income note, we’ll have a look at this area of the market in more detail, including the KKR offering mentioned above.
NBI Global Corporate Income Trust (NBI) Chart
MCP Master Income Trust (MXT) Chart
Overnight Market Matters Wrap
- Risk is certainly back on for investors across globe after US President Trump announced the US and China reached the first phase of a “substantial” trade deal and further planned tariffs, which were due to take effect this week, have been put on hold.
- The trade deal which will be written in the coming weeks will see China buying up to US$50bn worth of US agricultural products, and an agreement on currency and financial services issues. The news also spurred the commodity markets with oil in particular up over 2% with crude back above US$54.50/bbl., with prices also underpinned by a missile attack on an Iranian oil tanker.
- Safe haven assets lost its lustre, with gold spot sub US$1,490/oz. while we expect materials sector such as BHP to outperform the broader market after ending its US session up an equivalent of 1.95% from Australia’s previous close. The big 4 banks are expected to weigh following an inquiry into their handling of interest rates not being passed on to consumers in full.
- The December SPI Futures is indicating the ASX 200 to open 35 points higher, towards the 6645 level this morning.
Have a great day!
James & the Market Matters Team
Disclosure
Market Matters may hold stocks mentioned in this report. Subscribers can view a full list of holdings on the website by clicking here. Positions are updated each Friday, or after the session when positions are traded.
Disclaimer
All figures contained from sources believed to be accurate. All prices stated are based on the last close price at the time of writing unless otherwise noted. Market Matters does not make any representation of warranty as to the accuracy of the figures or prices and disclaims any liability resulting from any inaccuracy.
Reports and other documents published on this website and email (‘Reports’) are authored by Market Matters and the reports represent the views of Market Matters. The Market Matters Report is based on technical analysis of companies, commodities and the market in general. Technical analysis focuses on interpreting charts and other data to determine what the market sentiment about a particular financial product is, or will be. Unlike fundamental analysis, it does not involve a detailed review of the company’s financial position.
The Reports contain general, as opposed to personal, advice. That means they are prepared for multiple distributions without consideration of your investment objectives, financial situation and needs (‘Personal Circumstances’). Accordingly, any advice given is not a recommendation that a particular course of action is suitable for you and the advice is therefore not to be acted on as investment advice. You must assess whether or not any advice is appropriate for your Personal Circumstances before making any investment decisions. You can either make this assessment yourself, or if you require a personal recommendation, you can seek the assistance of a financial advisor. Market Matters or its author(s) accepts no responsibility for any losses or damages resulting from decisions made from or because of information within this publication. Investing and trading in financial products are always risky, so you should do your own research before buying or selling a financial product.
The Reports are published by Market Matters in good faith based on the facts known to it at the time of their preparation and do not purport to contain all relevant information with respect to the financial products to which they relate. Although the Reports are based on information obtained from sources believed to be reliable, Market Matters does not make any representation or warranty that they are accurate, complete or up to date and Market Matters accepts no obligation to correct or update the information or opinions in the Reports. Market Matters may publish content sourced from external content providers.
If you rely on a Report, you do so at your own risk. Past performance is not an indication of future performance. Any projections are estimates only and may not be realised in the future. Except to the extent that liability under any law cannot be excluded, Market Matters disclaims liability for all loss or damage arising as a result of any opinion, advice, recommendation, representation or information expressly or impliedly published in or in relation to this report notwithstanding any error or omission including negligence.


