Subscribers questions (FB US, COH, CGC, MRK US, BMY US, PAC, WHC, BLG, IAF, IGB, AVH, RXL, ALK, BVS, MXWO, ORE, IEU, LSF, KKC, PE1, 5GN)
The last weekend of this financial year was almost befittingly dominated by the coronavirus but not in a particularly escalated manner, parts of the developed world are at risk of moving backwards into restricted living / lockdown with Leicester in the UK the latest member of this infamous group after 658-cases have been confirmed in the last fortnight. I’m sure we all know the problem for stocks, the Dows almost 10,000-point rally from the depths of March has been built on huge government / central bank stimulus plus optimism that the virus will be well and truly behind us come 2021 but if the later is removed from the equation stocks have simply bounced too hard too fast and the last few weeks weakness is reflecting this view.
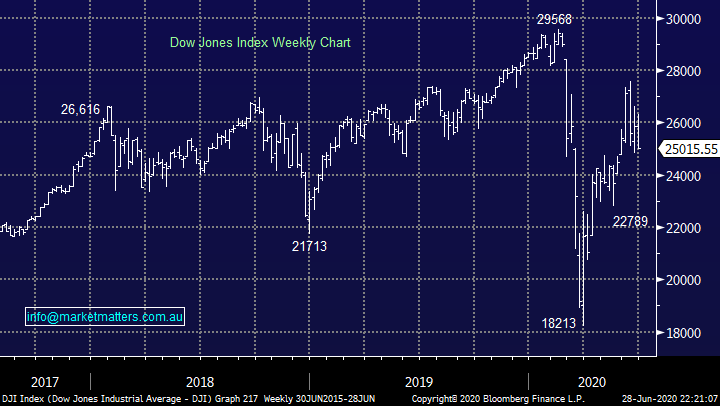
At this stage MM believes the current concerns rippling through equities is no great surprise having flagged a strong likelihood the virus would come back to haunt stocks after many had become complacent but we remain bullish over the years ahead hence our focus is on buying opportunities as we contemplate ideal levels to move further up the “risk curve”. We like the Dow under 24,000 from a risk / reward perspective. With Chesapeake Energy (CHK US) filing for bankruptcy overnight Fridays negative tone might follow through today, as we often say never say never – in 2014 CHK was trading above $US6000 and on Friday it closed under $US12.
MM likes US stocks ~5% lower.
Dow Jones Index Chart
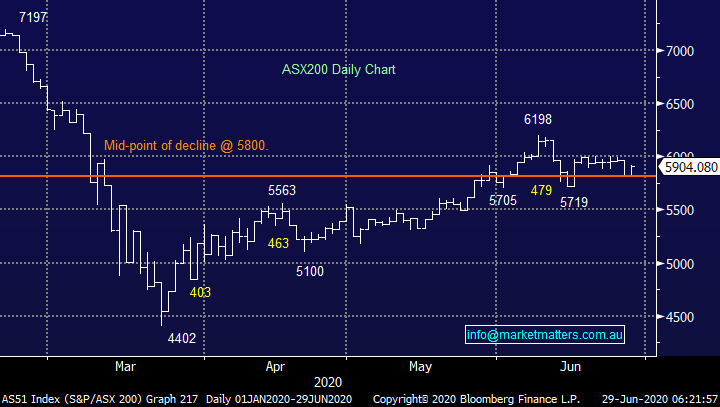
The ASX200 futures were slapped fairly hard after-market on Friday implying the index will open down almost 2% this morning, with the $A testing 68.50c on the downside at 6am this morning another “ risk off” day feels likely. The world has now endured more than 10 million confirmed cases of COVID-19 and over 500,000 deaths and with many parts of the globe experiencing rising numbers we might just be in the early stages of a long and uncertain battle with the virus as many experts still believe a vaccine is 12-18 months away at best. However the stock markets largest fear is often uncertainty and if the COVID-19 journey while tough and unpredictable doesn’t throw up too many nasty surprises it might just ”get used to it” in its own optimistic way, an outcome we’ve seen before and will see again.
MM remains bullish Australian stocks medium-term.
ASX200 Index Chart
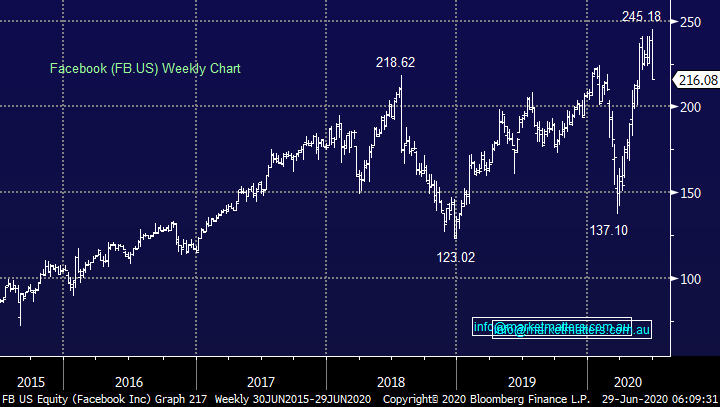
Last week’s plunge by Facebook (FB US) saw Mark Zuckerberg’s wealth fall by an astronomical $US7bn as many huge global companies suspended social media advertising because of “hate speech”, the list of major global corporations includes Coca-Cola, Pepsi, Starbucks and Unilever – only a few decades ago it was all about freedom of speech, now it needs to fit into societies certain boxes. That’s clearly a huge revenue hit for the on-line industry but 2 things remain obvious to us – social media isn’t going away fast and these high profile consumer orientated companies will not be keen to sacrifice exposure for long. The companies are making an admirable social stand but history tells us the news will evolve and they will again want to get the profit printing press churning as fast as possible.
MM likes Facebook (FB US) around the $US200 area.
Facebook (FB US) Chart
A noticeable pick up in the number of questions this week, perhaps two 700-point falls on Wall Street has sparked some interest from our subscribers, remember as we often say volatility equals opportunity for the prepared.
Question 1
“Thanks for your ongoing efforts, it has helped enormously in these current times. A couple of quick questions. I hold COH, and have done for some time and also took up the recent offering. With regard to your thoughts on sell strength and buy weakness would this perhaps fall into this category with a view to obtaining a bit more forward momentum and perhaps re-enter later? The next question being your thoughts on CGC, I'm open to your thoughts on holding this at present.” - Many thanks Greg T.
Morning Greg,
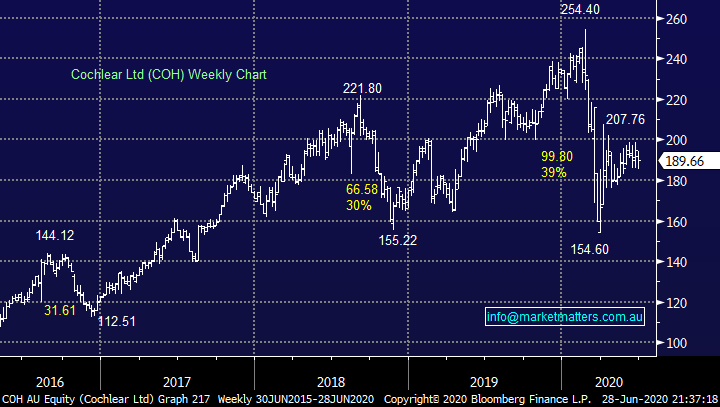
Much appreciated feedback, there’s certainly plenty of activity in todays market. Cochlear (COH) remains 25% below its 2020 high making it hard to identify levels where I could label “sell strength” in the foreseeable future. However in the relatively short-term I would say COH looks destined to rotate between $180 and $200 hence any spike out of this respective range could be faded by the active investor who is ready to move against how the market will undoubtedly feel at the time.
Cochlear raised capital back in March at $140 which has likely fuelled some of the selling above $200 but this will eventually fade away hence we are keener buyers than sellers.
MM likes COH below $180.
Cochlear (COH) Chart
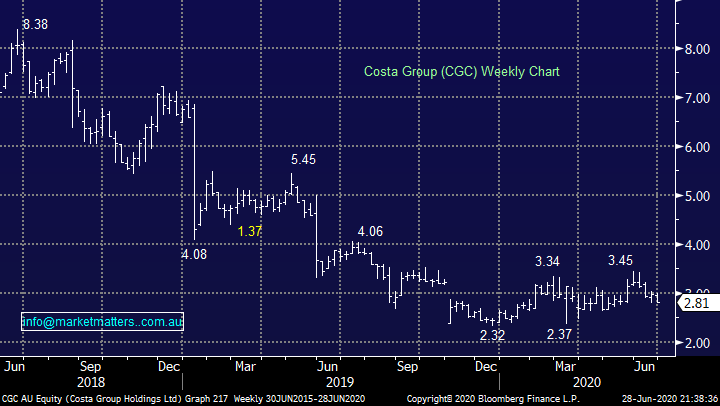
Costa Group (CGC) is certainly testing our resolve, the fruit / vegetable grower has been rotating around $3 for most of 2020 having fallen hard in 2018/9. At this stage we are giving the position some room as we believe operationally the business is in a turnaround phase, but like all positions we are constantly evaluating the holding.
Costa Group (CGC) Chart
Question 2
“MM is doing a great job on Domestic stocks. With MM moving more into the international area does the team have any thoughts on Merck (MRK) or Bristol-Myers Squibb (BMY) as health stocks for the future.” - Chris G.
Morning Chris,
Firstly thanks for the vote of confidence towards the local market, we are excited by our ongoing evolution into the global market a move which brings with it plenty of opportunities. Firstly we are cautious both the Healthcare Sector and $A in the years ahead but it doesn’t mean there won’t be some great individual investments that present themselves along the way. Moving onto the 2 stocks you mentioned:
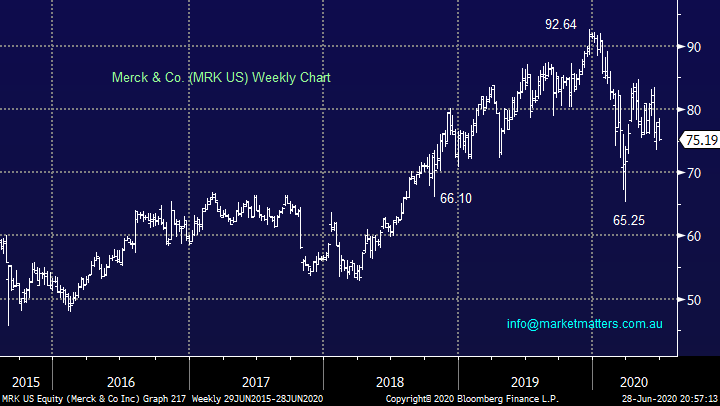
MRK is a $US90bn healthcare business which is mapping out its future around longer life expectations which is ironic as COVID-19 and Diabetes threaten this dynamic. However we like their forward thinking and major strategic effort to create a new drug development pipeline for neurodegenerative diseases like Parkinson's disease and Alzheimer's disease.
MM likes MRK in the mid-low $US70 region.
Merck & Co. Ltd (MRK US) Chart
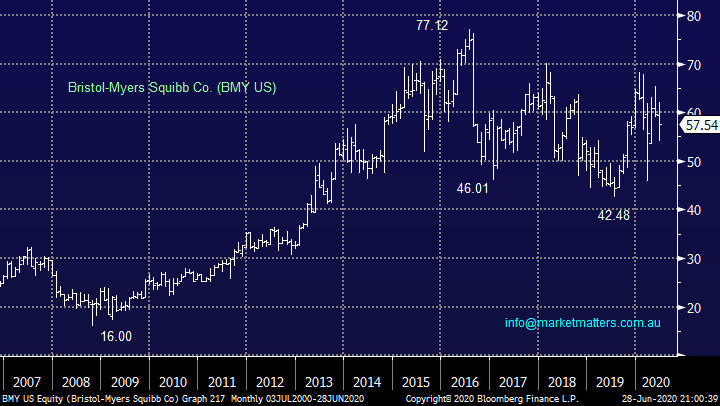
BMY is the lesser known of the two but its still a $US130bn massive conglomerate with an impressive collection of pharmaceutical assets and importantly an ever-increasing pipeline. Back in December, the company increased its dividend for 2020 by almost 10%, extending its long and reliable history of increasing its dividend, having done so four times in the past five years.
MM likes BMY at current levels.
Bristol-Myers Squibb Co. (BMY US) Chart
Question 3
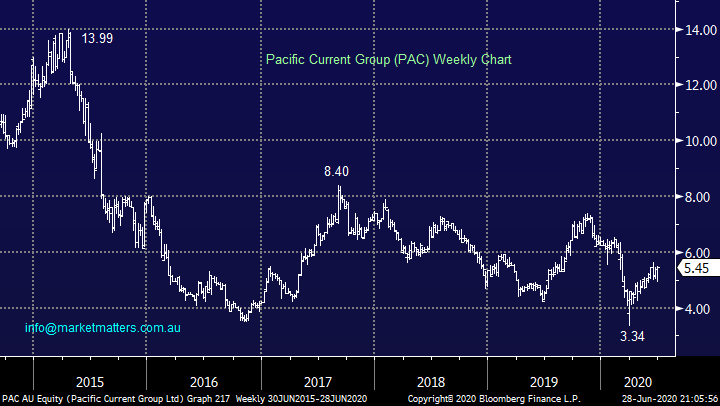
“Great weekend note James. I love the counter consensus view on Banks. Every Fund Manager seems underweight Banks. James, one I like for your back pocket is Pacific Current (PAC:ASX). It has c$75 billion FUM across 16 boutiques. Based on FY guidance it looks to be c10x PE & a c6.7% grossed up yield (50% payout). Also is trading below tangible book value of $6.20 at 0.85x (MFG is on 11x Book). It also had a takeover offer at $7.43 it rejected in Oct 2019 so today its well under water. CEO needs share price above $8.00 by June 22 to get 2.5m share rights (LTI hurdles $6.75 plus compound of Dividend. Looks interesting. One totally off people's radar. Worth watching. GQG with 45b of the 75b has since the last FUM update risen 30%! Problem is AUD/USD conversion. If AUD rises FUM conversion down which will be a headwind and I know your view on AUD.” – Rodney.
Hi Rodney,
Fingers crossed the contrarian view on the banks plays out as MM is now slightly overweight. I agree with you that $270m asset management company PAC looks both interesting and good value at current levels plus as you say it’s been a good dividend payer over the years.
MM likes PAC around current levels.
Pacific Current Group (PAC) Chart
Question 4
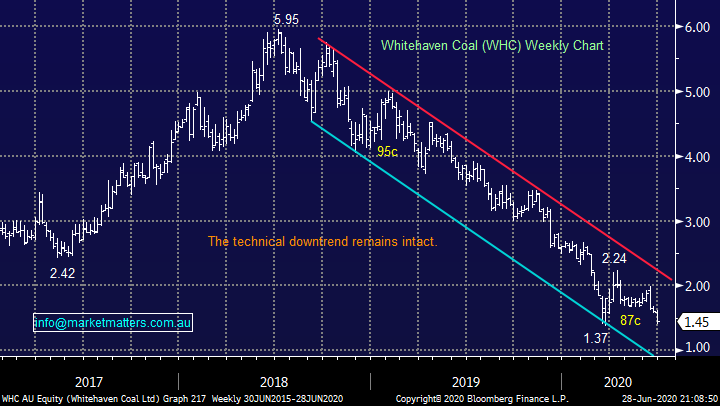
“Good morning, I read your coverage of WHC recently and noted you have a target of $1.30 to enter. I am a believer that as a country we will likely need coal fired generation (clean coal technology) to meet our energy needs at a reasonable cost for some time to come. Also that we will likely still feed into offshore demand in the same area also for some time to come. Ideally it's a balance between push to renewables, keeping energy prices low and keeping jobs etc. I missed WHC during the GFC when it was under $1 and have watched its rise and fall over the years since. Several announcements yesterday 1/ NSW government is looking at coal and communities and jobs etc and 2/ Labor also looking at some sort of bi-partisan energy policy that might include clean coal generators (announcement just yesterday and post your last WBC write up). Question is are we now in the zone in which the risk reward is biased even more to the upside. It seems like WHC has manageable debt load, productive assets and reasonably assured demand for a few years to come. CEO has offloaded a lot of shares at current levels though and that concerns me. Quite a few big names on the share registry though. Interested in your updated thoughts on this stock.” - Many thanks Mark P.
Hi Mark,
Over recent years WHC has been falling like a ping pong ball going down a stairwell i.e. it was always going to reach the bottom but has some inevitable large bounces along the way. I agree with your thoughts around WHC but the downtrend is ingrained plus there are plenty of sellers as ethical investing becomes more in vogue. Fewer institutional buyers, fewer banks lending into Coal pushing up funding costs and of course the ~50m shares which are still outstanding from Farallon, a known seller has us on the sidelines for now.
We believe buyers should remain pedantic and accumulate into fresh 2020 lows, perhaps the placement of that stock overhang will create a meaningful low.
MM likes WHC into fresh 2020 lows.
Whitehaven Coal (WHC) Chart
Question 5
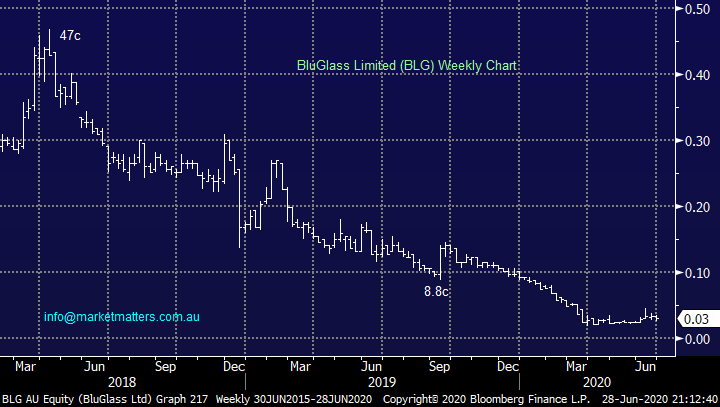
“Any knowledge on this company “BLG”” -Cheers Gerry B.
Hi Gerry,
Unfortunately BLG is a new one on me and with a market cap of just $25m plus very poor performance I think its unlikely MM will be paying close attention anytime soon.
MM is neutral BLG.
BluGlass Limited (BLG) Chart
Question 6
“Hi James, on Tuesday you were bullish US short-term and on Thursday you were bullish US stock medium-term. What changed in 48 hours?” - Cheers Tim N.
Morning Tim,
Hopefully we have explained this in the last few reports but to quickly summarise:
1 – MM has remained bullish equities medium-term over recent months.
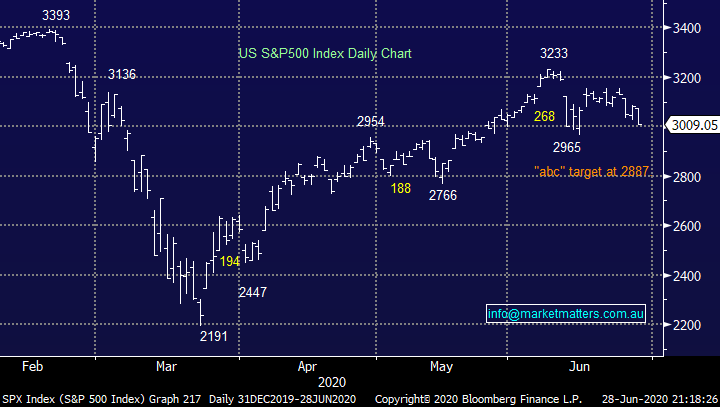
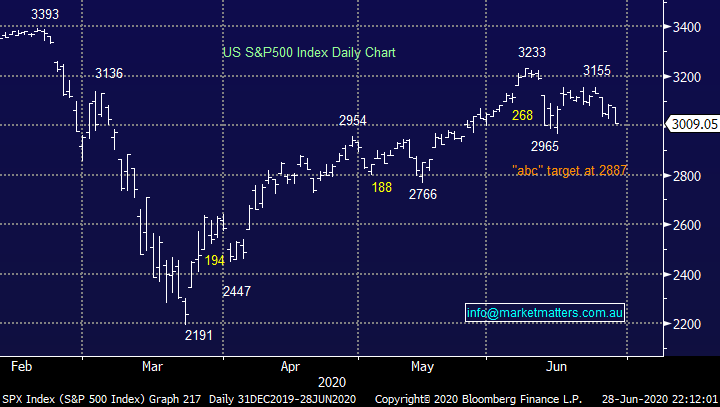
2 – Short-term we have outlined 2 likely scenarios and using the S&P500 below they were either a pop towards 3300 before a pullback, or a fall under 2900 to provide a good buying opportunity, we have simply oscillated between which of these 2 felt the most likely hence our tweaks but importantly short-term moves are the toughest to forecast as they are largely determined by random news flow.
MM remains medium-term bullish stocks.
US S&P500 Index Chart
Question 7
“Hi James and All, I appreciate reading you opinions and would like to know what you think of IAF and IGB as possible safe places to park funds and earn something back.” - Regards Tim H.
Hi Tim,
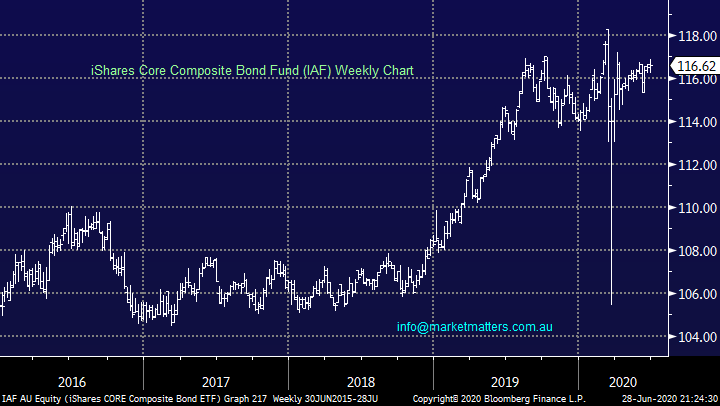
Both are bond funds that will provide a place to hide if the market falls out of bed. While we don’t write a lot about asset allocation at MM given our focus mainly on highlighting individual investments, asset allocation is important, and having a portion of money in bonds reduces overall volatility in a portfolio. That said, I find it hard to get too excited about them in absolute terms given the outlook for interest rates.
1 – The IAF is a $1.3bn domestic ETF fund which invests in government and corporate bonds, while rates / bond yields remain low it should serve your purpose. It has a running yield of ~3% while its average yield to maturity is just 0.82%pa. That number combines yield plus capital loss given bonds are trading above their face value.
iShares Core Composite Bond Fund (IAF) Chart
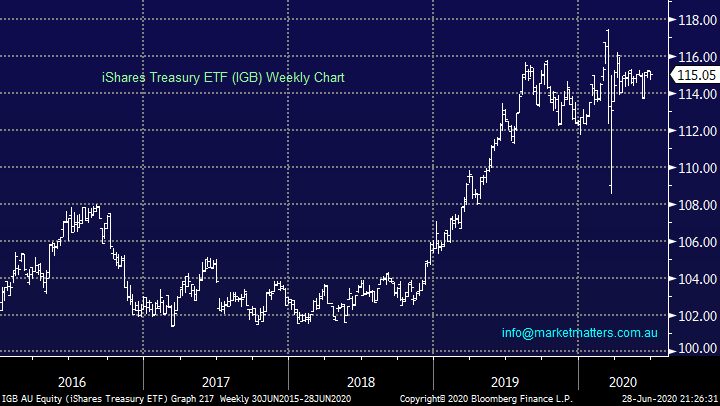
2 – The IGB is a smaller $85mn domestic ETF fund which invests in Government Bonds only, has a running yield of 2.76% but with an average yield to maturity of 0.67%pa. Again, that number prices in yield minus capital losses. The other aspect to consider here is average duration of 6.65 years i.e. fairly long dated
If interest rates stay low, bond prices will stay high, however if interest rates start to rise, bonds prices will fall.
iShares Treasury ETF (IGB) Chart
Question 8
“Hi James & Team, thanks for you well researched information on the markets particularly during such interesting and testing times. I have found the Covid-19 experience somewhat polarising with regards to business. As we know some sectors absolutely decimated while others report being as busy as ever. If the upcoming reporting season reflects this there will be the expected disappointing updates from many companies but perhaps also some surprises on the upside. Based on what has happened could you provide your thoughts on which ASX200 companies may be in this position and be able to maintain dividends through the 2021 FY?” – Thanks Brian W.
Morning Brian,
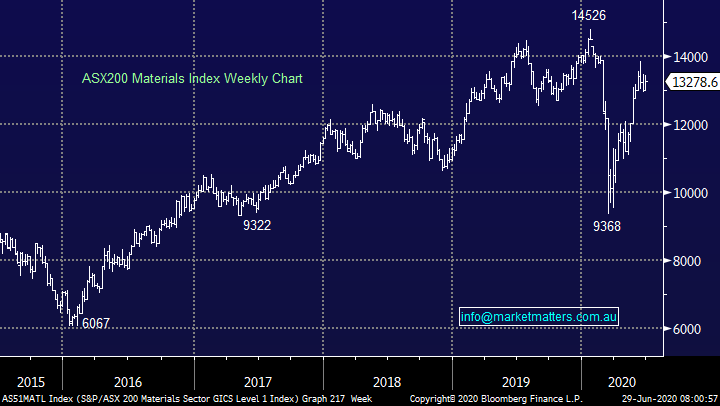
Thanks for the thumbs up, always makes me feel good on a Monday morning. This is indeed the million dollar question because it requires not only an insight into how a company’s been tracking but then an evaluation of what the markets expecting and is positioned for. At current levels my favourite sector for both price appreciation and dividends in the next 1-2 years is the Materials / Resources Sector – the likes of BHP, RIO and Fortescue look set to make fresh multi-year highs in the not too distant future, while dividends are sustainable.
Of course, the other area that should hold up well now and into the future is technology, however dividends are less prevalent here.
MM likes resources into 2021.
ASX200 Materials Index Chart
Question 9
“Dear James, any idea why the price of AVH has dropped after the recent scheme of arrangement?” – Thanks Indran R.
“AVHDA. Can you tell me what is happening with this share. Should shareholders be worried? A very general question - what would you buy if you had $2000? What would you buy if you had $5000? Assume a 12-month hold.” - Dale C.
Hi Guys,
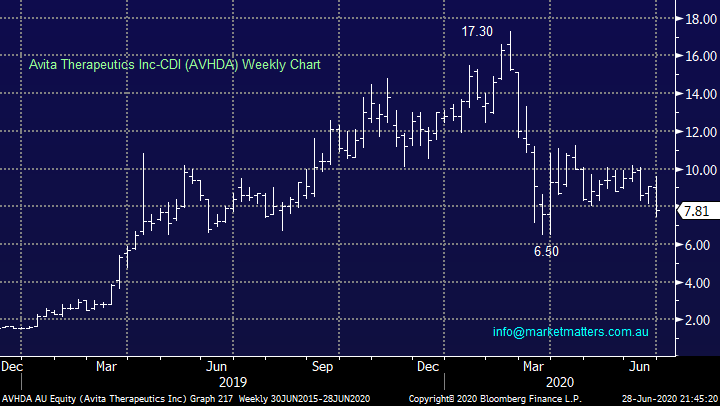
AVH is a regenerative medicine company which focuses on skin treatment which has been growing strongly and this March it revealed a more than 80% increase in revenue for 9-months year on year. There are a few things happening with AVH at present. The letters DA on the end of the code simply refer to deferred settlement which happens when stocks go through an initial listing, or restructuring process. AVH has had a share consolidation plus is being redomiciled to the US meaning that its primary listing will be on the Nasdaq and it’s secondary listing will be on the ASX which is the opposite to what it is now. The DA should drop off today and the stocks revert back to normal code and settlement.
In terms of the sell off, when a stock moves to a primary listing overseas, some funds are forced sellers given mandate restrictions hence the weakness in the share price. I also think the share price simply got ahead of itself with revenue not justifying a market cap in excess of $1bn, it’s still valued at $838mn today although revenue for the 3rd quarter was just $6mn. The downside momentum is fairly strong and a break under $6 would not surprise us.
MM is neutral AVH.
As to what I would buy with any amount of money by definition our money is held in the MM Growth and Income Portfolios which reflects our views / opinion on the market.
Avita Therapeutics Inc-CDI (AVHDA) Chart
Question 10
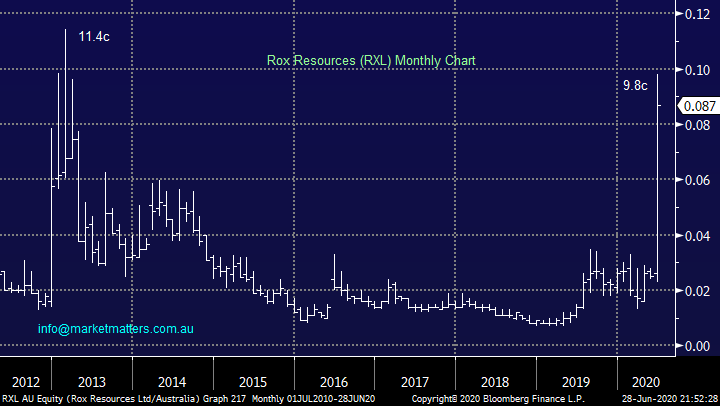
“Good Morning James & MM Team, I've been following Rox Resources (RXL) for a number of years now and over the last week their share price has jumped considerably due to exceptionally high grade gold results from their drilling program. Is this a stock you have ever look and if so what are your thoughts ? Thanks in advance.” - Cheers, Pete G.
Hi Pete,
RXL is not a stock I have looked closely at over the years but with a market cap of $173m its obviously grown in stature of late thanks to some extraordinary recent drilling results from their Youanmi Project. While only early days they saw results as good as 176g/t of gold which is phenomenal. I’ve seen results like that before but generally in jurisdictions where vested interests have a tendency to ‘massage’ the outcomes! (RXL are in WA). In any case, the results are shallow drilling only with deeper drilling is ongoing.
This is a punt on the results being confirmed by more comprehensive drilling however management have a decent holding in the stock, and the results to date have been very good.
For the keen, technically I could buy with stops under 6c but that’s not exciting risk / reward at this stage.
MM is neutral RXL.
Rox Resources (RXL) Chart
Question 11
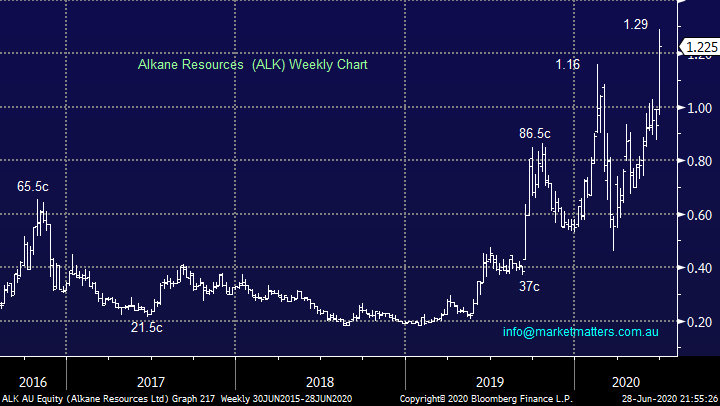
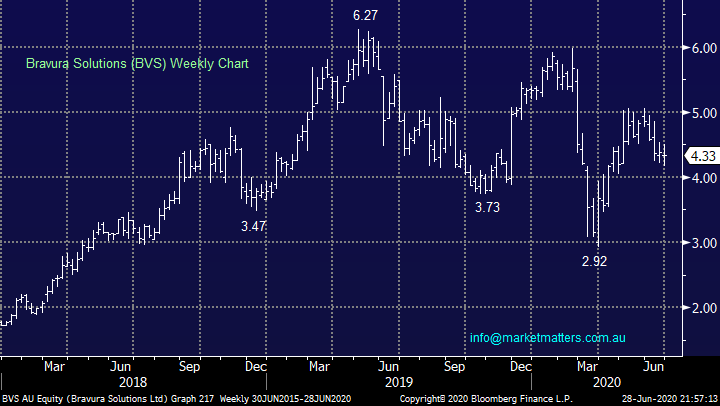
“Hi MM Team A BIG thanks - your daily reports have been an anchor in this storm. I would like your view on Alkane Resources (ALK) and Bravura Solutions (BVS) please. Also I take it as a YES to participate in the Mincor SPP at 72c/share given your bullish view for nickel stocks.” - regards Debbie G
Hi Debbie,
Thanks for heartfelt message, very much appreciated!
1 Alkane Resources (ALK) $1.22 – this gold and rare earths player is clearly volatile but looks good today. Technically ALK looks good with stops below $1.
Alkane Resources (ALK) Chart
2 Bravura Solutions (BVS) $4.33 - this wealth management software company has struggled a touch over the last 12-months but earnings growth is solid which should be ongoing following acquisitions which also gives the company some diversification, MM likes BVS at current levels.
If we held Mincor (MCR) we would take up the raise at 72c, but I do prefer Western Areas (WSA) as a larger cap play on Nickel.
Bravura Solutions (BVS) Chart
Question 12
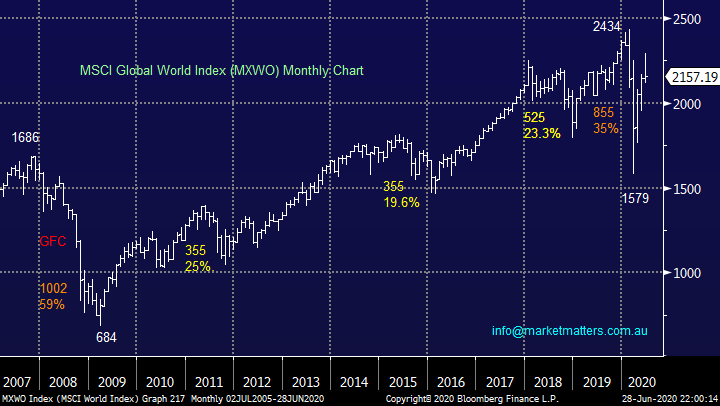
“Hi James, you seem to be holding strong in your short/ medium bullish stance for the ASX and S&P, but surely with some of the alarming numbers around PE ratios, unemployment, 2nd wave COVID spikes, the high must be in for the US market pretty soon. Apart from more Fed stimulus, which had little impact on the market last time, there is very little good news on the horizon. Is now a good time to pick up some cheap BBUS from its current bargain basement price? Also ‘risk off’ seems to be back in favour, gold, CSL, RMD, etc, taking the place of the energy and travel stocks. Any thoughts on repositioning for a correction?” - Thanks Charlie N.
Hi Charlie,
We are watching this carefully but at this stage we are sticking to our guns believing news inspired pullbacks will produce some buying opportunities rather than a reason to panic just yet. We are very mindful of the points you raise but at this stage we believe economic stimulus will be the main driver of stocks, after all at this stage nothing is unfolding that we haven’t outlined as likely throughout our reports in May / June.
MM is bullish stocks medium-term.
MSCI World Index (MXWO) Chart
Question 13
“Hi, now everyone is seeing the difference with using low petroleum usage with clearer air and water, I'm predicting there will be a push for more electric motor cars, as batteries is such a short term option plus the disposal issue in a few years is going to be a nightmare, I looking to get in early in hydrogen, do you have any predicting /crystal ball on any companies producing hydrogen for transportation?” – Thanks Paul H.
Hi Paul,
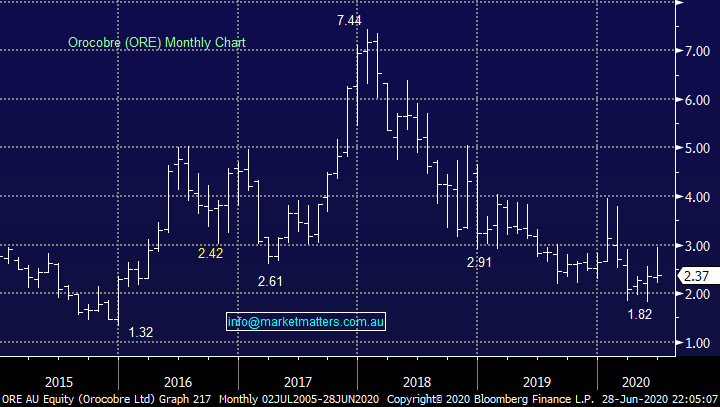
You may be a long way ahead of the curve when we consider where vehicle manufacturers are spending their monies today, I remember back in 2018 when lithium was all the rage and Toyota paid ~$7.50 for a stake in Orocobre (ORE) as they strived to ensure access to lithium moving forward – even the experts in the field struggle to predict the evolution of new technologies and supply / demand accordingly.
In terms of early developments, the companies I know who are doing something in Hydrogen are Hazer Group (HZR), along with Woodside (WPL) and Fortescue (FMG), both of which are backing research in the space, although I doubt this will turn the dial in the immediate term.
My “Gut Feel” is you're actually too early at this stage.
Orocobre (ORE) Chart
Question 14
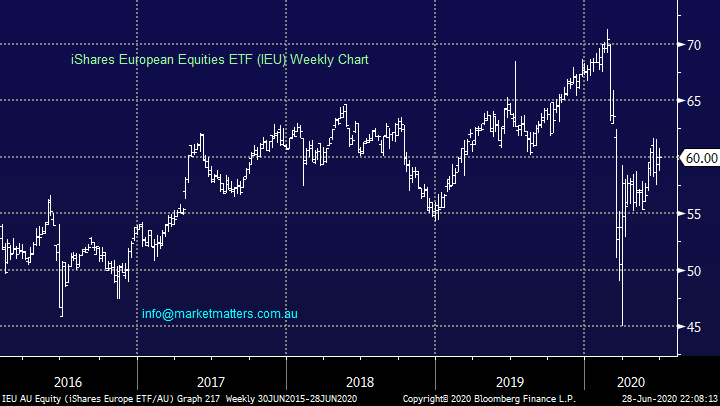
“There is typo in today’s report : “1 – we like the Australian based European equities ETF (IEM) around the 56 area, or 6% lower.” Should be IEU.” – Regards Sanjay S.
Hi Sanjay,
You are 100% correct a mistake on our part, as my teacher used to say to me “must try to do better!”.
MM likes the IEU around the 56 area.
iShares European Equities ETF (IEU) Chart
Question 15
“Hi James, I read your reports with interest trying to understand your perspective on this bewildering market. In your Weekend Report of Sunday 28 June, on the US S&P500 Index Chart, you have a note along the 2800 line, well below the line of the Index, saying “ “abc” Target at 2887.”
I am not clear on what this refers to, what it means or how it is derived. Can you please explain. I do have an additional concern on the Portfolio listings. There is comprehensive information on each portfolio page on all of the holdings including the following fields. What is not included is a $ total of the Gain or Loss For each investment, including exited positions, and the grand total values for each portfolio. This makes it impossible to see how the various portfolios are really tracking over time. Can this issue please be addressed as part of the service makeover.” –
Thanks Les M.
Hi Les,
Markets have a habit of repeating themselves as they are largely driven by human emotions of “Fear & Greed”. The “abc” target in this case is simply another leg lower of similar magnitude to the initial 268-point drop from the June 3233 high, with the starting point here being the 3155 high.
MM likes the S&P500 under 2900.
We don’t have a $$ on our portfolios because we believe a % is more relevant, we obviously have millions in both of our SMA’s which reflect our 2 main portfolios, MM feels the $$ is relevant to each individual investor as opposed to our personal investment.
US S&P500 Index Chart
Question 16
“Hi James & Team,
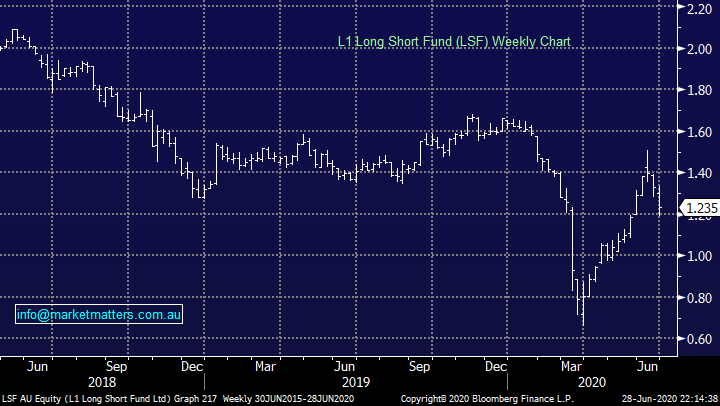
1) LSF doesn't seem to be going anywhere whether the market is up or down. Should it be cut loose even when NET TANGIBLE ASSET BACKING PER ORDINARY SHARE1 NTA before tax2 $1.7070 NTA after-tax $1.8072 is much higher than the share price.
2) Same can be said about KKC. What is the future prospects of KKC? Is the US central bank buying of corporate bonds positive on the stock?
3) Is PE1 entitlement offer worth taking up?
4) At what price is 5GN entitlement offer worth taking up given it last traded below the offer price?
Many Thanks” - Sidney H.
Hi Sidney,
Another long question Sydney, please understand my brevity in the answer”
1 – LSF: It’s been a shocker however now trades at a 27% discount to the value of its assets making it a hard one to sell at such a discount.
2 – KKC: This is a more diversified credit fund meaning that they focus across the credit spectrum, not one we liked at listing. Now however, it trades at a 17% discount to its assets, a discount that seems excessive for the sort of assets they hold.
3 – PE1: Yes, the offer at NTA ($1.26) versus the price of $1.40 is appealing. These guys have done a good job, we rate their approach.
4 – I like 5GN between $1.10 and $1.15 as an aggressive play, therefore the offer at $1.23 is unattractive.
L1 Long-Short Fund (LSF) Chart
Overnight Market Matters Wrap
• The US had given back its recent gains for the month as risk sentiment is back off the table following the US registering its largest ever daily confirmed cases of Covid-19 last Friday, now surpassing 10m worldwide
• Crude oil started to give back some of its recent gains as did copper as growth concerns were back in the agenda, while safe haven gold and treasury bills found support
• BHP is expected to underperform the broader market after ending its US session off an equivalent of -1.85% from Australia’s previous close.
• The September SPI Futures is indicating the ASX 200 open 76 points lower, towards the 5830 level this morning.
Have a great day!
James & the Market Matters Team
Disclosure
Market Matters may hold stocks mentioned in this report. Subscribers can view a full list of holdings on the website by clicking here. Positions are updated each Friday, or after the session when positions are traded.
Disclaimer
All figures contained from sources believed to be accurate. All prices stated are based on the last close price at the time of writing unless otherwise noted. Market Matters does not make any representation of warranty as to the accuracy of the figures or prices and disclaims any liability resulting from any inaccuracy.
Reports and other documents published on this website and email (‘Reports’) are authored by Market Matters and the reports represent the views of Market Matters. The Market Matters Report is based on technical analysis of companies, commodities and the market in general. Technical analysis focuses on interpreting charts and other data to determine what the market sentiment about a particular financial product is, or will be. Unlike fundamental analysis, it does not involve a detailed review of the company’s financial position.
The Reports contain general, as opposed to personal, advice. That means they are prepared for multiple distributions without consideration of your investment objectives, financial situation and needs (‘Personal Circumstances’). Accordingly, any advice given is not a recommendation that a particular course of action is suitable for you and the advice is therefore not to be acted on as investment advice. You must assess whether or not any advice is appropriate for your Personal Circumstances before making any investment decisions. You can either make this assessment yourself, or if you require a personal recommendation, you can seek the assistance of a financial advisor. Market Matters or its author(s) accepts no responsibility for any losses or damages resulting from decisions made from or because of information within this publication. Investing and trading in financial products are always risky, so you should do your own research before buying or selling a financial product.
The Reports are published by Market Matters in good faith based on the facts known to it at the time of their preparation and do not purport to contain all relevant information with respect to the financial products to which they relate. Although the Reports are based on information obtained from sources believed to be reliable, Market Matters does not make any representation or warranty that they are accurate, complete or up to date and Market Matters accepts no obligation to correct or update the information or opinions in the Reports. Market Matters may publish content sourced from external content providers.
If you rely on a Report, you do so at your own risk. Past performance is not an indication of future performance. Any projections are estimates only and may not be realised in the future. Except to the extent that liability under any law cannot be excluded, Market Matters disclaims liability for all loss or damage arising as a result of any opinion, advice, recommendation, representation or information expressly or impliedly published in or in relation to this report notwithstanding any error or omission including negligence.


