Subscribers questions (FANG, BBOZ, SCG, RWD, XRO, BHP, AEI, MQG, CSL, MVP, AWC, ETHI, Z1P, NXT, GMG, OZL, JHG, VRT, TWE, WPL, SRG, ORE, OVT, FMG, OCG)
The ASX200 is set to regain Fridays losses this morning following a recovery by US stocks in their last session of the week, during our time zone US futures were “wobbling” courtesy of comments out of the National People’s Congress in China where the communist party took an aggressive tone against the stance of Australia and the US in terms of their handling of the corona virus outbreak plus increased control over Hong Kong sent the Hang Seng index spiralling -5.5% dragging much of Asia with it. However after the early provocative words, rhetoric rapidly advanced to the need to stimulate their economy and its reliance on steel production to do so, which by definition needs Australian iron ore, an interesting conundrum – it appears even though they have no elections to worry about Chinas politicians can match the West for bluster!
As we said on Friday the market seems to be weighing up the negative influences of a COVID-19 led economic shutdown plus rising geopolitical tensions against massive stimulus from central banks and governments. At this stage central bank created liquidity is winning the battle and stocks remain firm. To MM while High Yield /Junk Bonds are constructive the indicators point to a meaningful tailwind for stocks i.e. they are extremely sensitive to liquidity hence junk bonds often roll-over first when the money tap is turned off. Hence until further notice MM remains a buyer of pullbacks by stocks but when we see the signs of liquidity dying up we will undoubtedly change our stance.
MM remains bullish equities medium-term.
ASX200 Index Chart
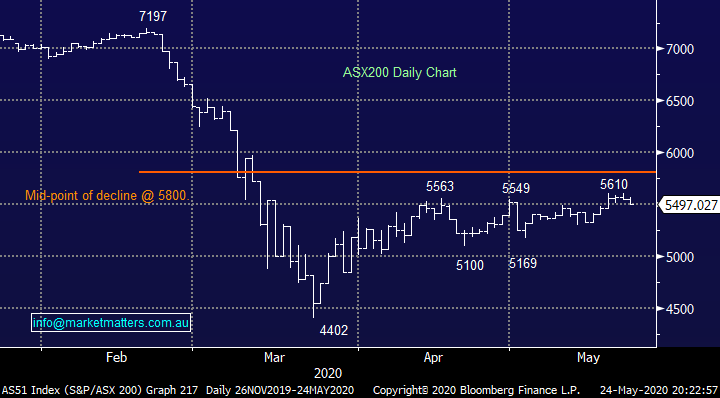
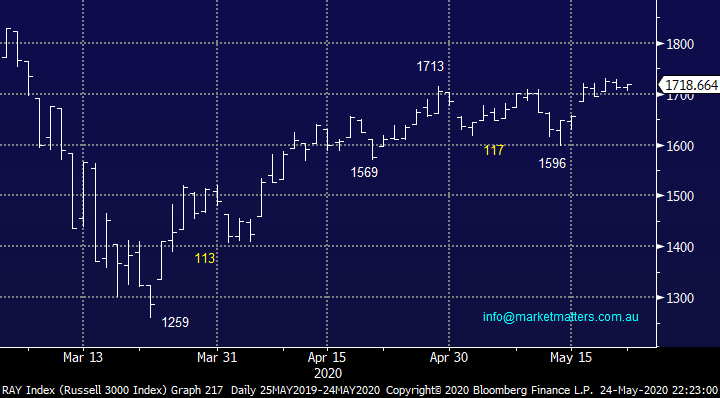
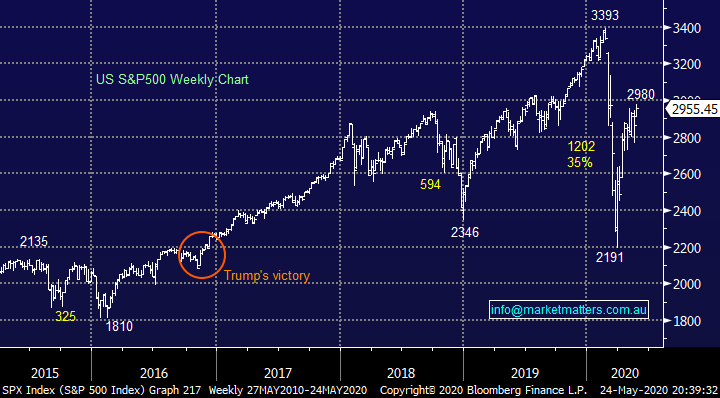
The broad-based US Russell 3000 has now surged well over 35% from its panic March sell-off, we’ve been bullish equities basically all the way but now the risk / reward feels far more balanced. The upside momentum suggests a few % higher is likely but the next 5-10% is a different matter, a pullback would not surprise at some stage in June, a move that MM would be buyers of, not panicked sellers.
MM’s is now wary of US stocks short-term.
US Russell 3000 Index Chart
Thanks again for another raft of questions this morning, please keep them coming, we simply love having engaged and educated subscribers. However please understand if the answers are short at times as we endeavour to deliver a timely as well as informed report.
Question 1
“Hi there, ASX has FANG ETF could you please do a check over.” - Leonora L.
Morning Leonora,
I actually did a webinar with ETF securities on Thursday who are the issuer of this product. While it wasn’t specifically on the FANG ETF we will send the recording out to subscribers later in the week.
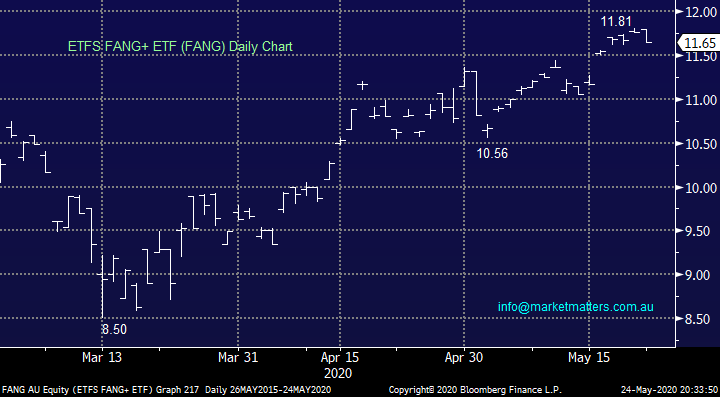
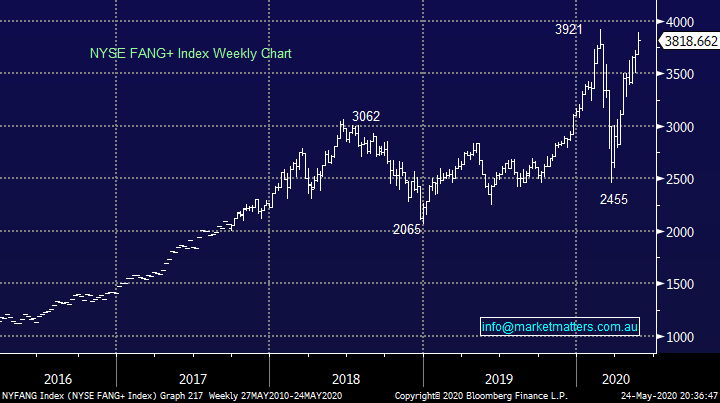
The ASX FANG is a very new ETF and as a consequence has a market cap of just $28m, its unleveraged with a goal of simply tracking the US NYSE FANG+ Index. The FANG+ index has the FANG stocks, Facebook, Amazon, Apple & Alphabet (Google), plus a bunch of other high growth technology businesses like Twitter, Nvidia, Netflix, Tesla, Alibaba and the like.
The ETF does not hedge the currency risk, hence a rising AUD is a negative, while a falling AUD is a positive and it charges an annual management fee of 0.35%.
As long as the bid / offer spread is managed well during our time zone this is a great local vehicle to play the US technology stocks.
MM likes the FANG into the weakness around $10.75.
ETFS FANG+ ETF (FANG) Chart
NYSE FANG+ Index Chart
Question 2
“Hi James, For the rookies like me out there, could you explain how this strategy mentioned below works. It was in the context of your Platinum Portfolio strategy, reducing your exposure to the market if it raises higher to 5600; Alternatively, we might simply maintain our portfolio mix and hedge via a negative facing ETF.NB The BBOZ illustrated below is leveraged by around 2x and should be used accordingly. “ - Regards, Alan P.
Morning Alan,
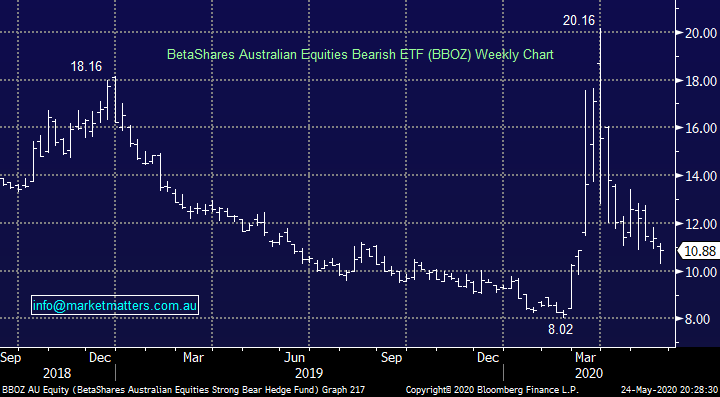
If MM had decided our current portfolio mix was “perfect” the ideal way to protect some of the downside might be through buying the BBOZ, which is a fund that rises in value when the ASX200 falls. It is leveraged by around 2x, hence a 5% fall in the market would equate to a 10% rise in the ETF, hence if we allocated 10% of our portfolio to this ETF it would effectively insulate about a quarter of our portfolio to any downside moves assuming of course the current holdings mirrored the index’s performance – this method of downside protection can also be used to manage our tax implications.
The alternative path which we eventually followed is to take off / reduce some individual positions with an ultimate goal to improve the portfolios mix at lower levels i.e. “lifting a leg”.
MM can see the BBOZ bouncing over 12 in the coming weeks / month implying a shallow market pullback.
BetaShares Australian Equities Bearish ETF (BBOZ) Chart
Question 3
“Hi MM Team, In line with the analogy, “you should always buy straw hats in winter”, at what point do you think Retail LPT’s like SCG and URW become compelling value on a long term view (especially given the discount they are trading to NTA)? Keep up the good work!” - Kind Regards, David W.
Hi David,
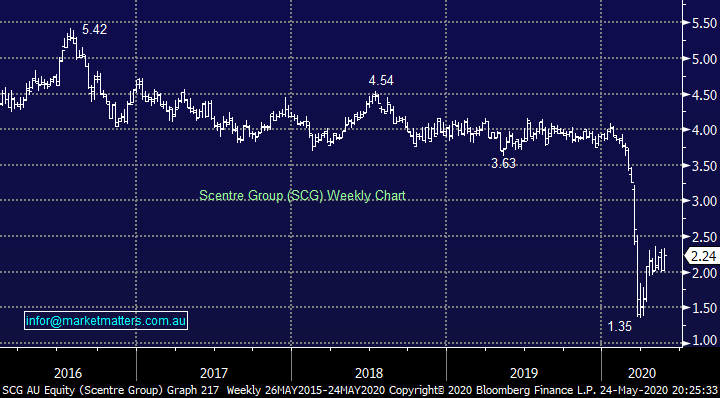
A well timed question as investors start searching for perceived value in the market, fund managers appear clearly overweight cash. Retail LPT’s (Listed Property Trust) like SCG shown below are starting to look appealing on a relative basis but their NTA depends of course on how shopping centres perform post COVID-19.
While we think from a risk / reward perspective SCG now looks good around $2 for those keen on the sector, my view is this area of the market has structural rather than cyclical challenges in the years ahead. COVID-19 has amplified a number of existing trends in the market, a move more towards on-line shopping is one them.
MM feels SCG looks good for a short term play around $2.
Scentre Group (SCG) Chart
Question 4
“Hi James and team, Just a comment or two regarding today's subscriber's questions and comments - specifically Glenn Q's comment (question 12). If Glenn Q was truly objective , he would firstly acknowledge that Donald Trump and his large cohort of advisors have handled the CV-19 issue very badly. This has not been Donald Trump or America's crowning glory. As a long standing subscriber to MM, I appreciate your thoughts, comments, position and advice . This is what I signed up for. Please do not moderate or introduce diplomatic correctness just to conform to sensitive subscribers who struggle with their own advice and opinions. Thanks for the good service.” - Cheers, Jan P.
Hi Jan,
Thanks for the thumbs up – for those interested, the comment relates to last week’s report – click here
By definition MM cannot keep all of our subscribers happy all of the time when we call things as we see them. Importantly we must convey an opinion on messages we believe may / will have an impact on stocks, especially with President Trump having an election to fight in November. For the record we believe he’s had a positive impact on stocks and has done some very good things from an economic policy perspective, but has dealt with the pandemic in very questionable fashion. I actually found myself defending Trump in a conversation with my Mum last week, which rattled me a little bit. Anyway, like all of us, he has handled some things better than others.
MM remains bullish US stocks medium-term.
US S&P500 Index Chart
Question 5
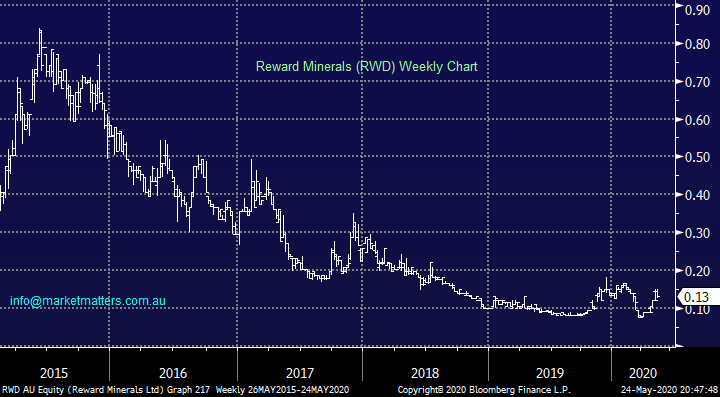
“What do you think of RWD the biggest and best potash resource in Australia right now?” – Ferdinand G.
Hi Ferdinand,
RWD has eroded shareholder value over the last 5-years and while most of the damage has probably already been done MM sees no reason to chase this $21m business at this point in time although for the trader it looks capable of bouncing towards 20c.
MM is neutral RWD.
Reward Minerals (RWD) Chart
Question 6
“Just a question on how the market values stocks like APT [$42] & XRO [$77] and many others when they are really not making a profit and no real chance for some years in paying a dividend. There are some great companies that are totally the opposite and are so much cheaper. I may be stupid but would like it if you can tell me your thoughts on why. I do know they do have potential for the future but stocks like FMG, BHP and many others are so much sounder in there balance sheet.” - Regards, David J.
Hi David,
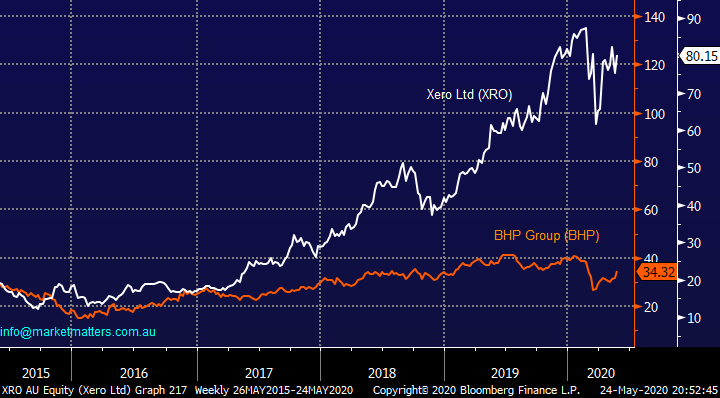
Interesting question as we own both Xero (XRO) and BHP Group (BHP) in our Growth Portfolio. In a nut shell, this largely comes down to the markets perception of future value i.e. what earnings will look like in the future. If we use XRO as an example, they are growing the business at around 30% pa at the top line, however they’re spending a lot of money on this growth by entering new markets & developing new products with the hope / expectation this will pay off in the future. Just as BHP would spend money on a mine that will be unprofitable until it is scaled up, XRO is in that scaling process. If the business reduced its focus on growth and prioritised profitability, they could certainly turn a very impressive profit right now.
The other important aspect when thinking about technology and investing in it is the concept of winner takes all. Users bring in more users, scale is incredibly important and XRO, APT and the like are creating this scale. The technology businesses that have been truly successful spent a lot of money before actually making any. Apple for example was unprofitable for many years, spent money of development and is now an extremely profitable company trading on 25x earnings.
From a macro perspective, the current low interest rate environment has clearly favoured growth as can be seen below through XRO trumping BHP on performance and it reminds me of a common investing / trading comment - “Don’t fight the tape”. At MM we believe value will regain at least some of its underperformance in the next few years but growth clearly has the momentum short-term with bond yields the probable catalyst to create a turn.
MM is bullish both BHP and XRO.
BHP Group (BHP) & Xero (XRO) Chart
Question 7
“Hi James, I’m sure SHAWS have been involved with Aeris previously. Can you comment on this stock?” - Thanks, Peter M.
Hi Peter,
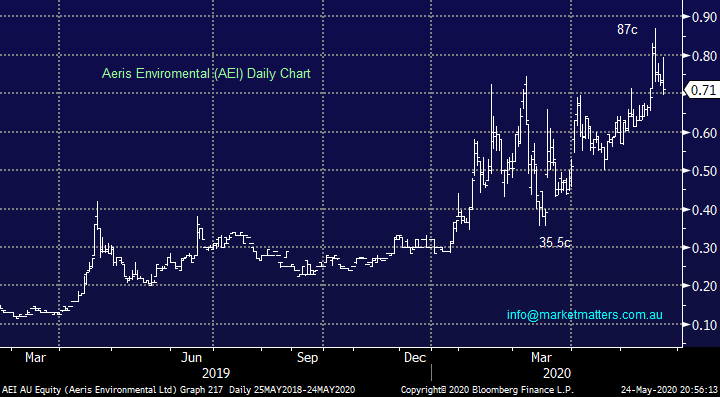
The manufacturer of water treatment systems has a current market capitalisation of $172m on revenue of $8.6m, its unprofitable but clearly gaining some traction. Unfortunately it’s not something I’ve been involved in directly Peter, so I can’t add a lot of value to this one sorry.
MM in neutral AEI
Aeris Environmental (AEI) Chart
Question 8
“Hi is the MQG Capital notes 2 worthwhile?” - Anthony B.
Hi Market Matters team, thanks for your commentary over this choppy period. It would be great to get your take on the new Macquarie Bank Capital Notes 2 Securityholder offer and how it compares to other similar raisings in the market place recently. “ – Cheers Paul A
Morning Guys,
In short, yes, the security looks attractive. We covered in the income note last week.
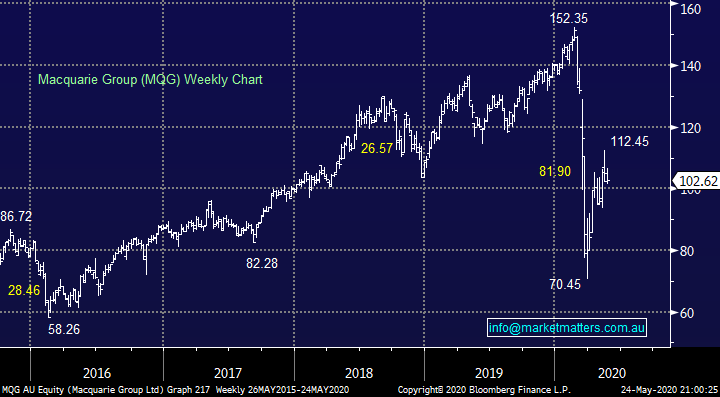
Macquarie are raising $400m in a longer dated tier 1 security, with first call in 8.5 years. Compensating for that is a solid 4.70% rate over bank bills landing the security at around 5% pa. Macquarie is a slightly higher risk issuer than a big 4 bank, and the note is longer duration hence the higher yield than many of the existing hybrids.
If you cast your mind back to early March this year, both Macquarie and NAB had new hybrids in the pipeline that were rightly pulled as credit markets went into meltdown. That security was being offered at a margin of 2.90% over bank bills meaning that the new security is costing MQG an additional 1.80% pa.
In terms of existing Macquarie Securities, they have 3 on issue:
MQGPB $101.70: 0.8 years to run paying 3.49% over bank bills
MQGPC $98.20: 4.6 years to run paying 4.62% over bank bills
MQGPD $98.00: 6.3 years to run paying 4.67% over bank bills (we hold in the Income Portfolio)
As a very general rule of thumb, we view hybrids offered with a margin of 4% as cheap and below 3% as expensive.
MM is positive the new Macquarie Hybrid
Macquarie Group (MQG) Chart
Question 9
“Hi James I just recently sold 1/3 of my CSL holdings at around $320 , I was hoping to pick them back up at $275 . I have 2 questions. 1. Should i sell the balance above $300 ? 2.Do you think we will see CSL back to $250-$275 ? I only trade my portfolio when things are volatile - to hopefully enhance the returns. Basically I mostly want to be invested.” – Michael S.
Hi Michael,
You sound like an “Active Investor” looking to add value / alpha, obviously we cannot give personal advice hence our comments are only in line with our current view on CSL.
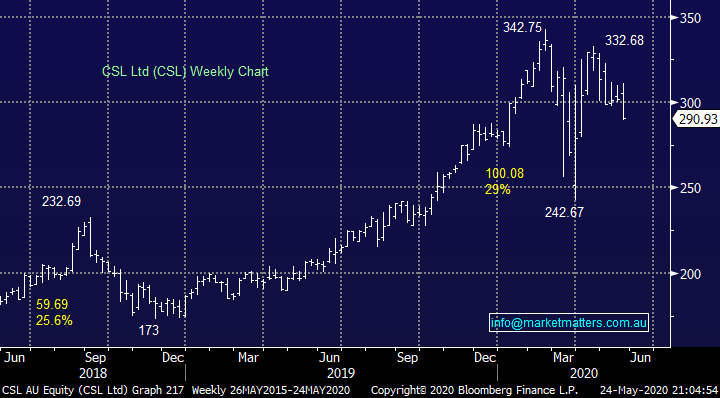
MM believes CSL is a great company but as we said in the Weekend Report our sector bias is now away from the high-flying healthcare stocks which significantly outperformed during stages of the coronavirus outbreak. Hence while we do see CSL testing $350 in the next 1-2 years our ideal buy area is initially under $280.
CSL likes CSL around $275 – over 5% lower.
CSL Ltd (CSL) Chart
Question 10
“Hi James I have been watching MVP and while it is volatile and appearing to be overpriced they have a very strong base below $7 - what are your views on this stock?” - Michael.
Hi Michael,
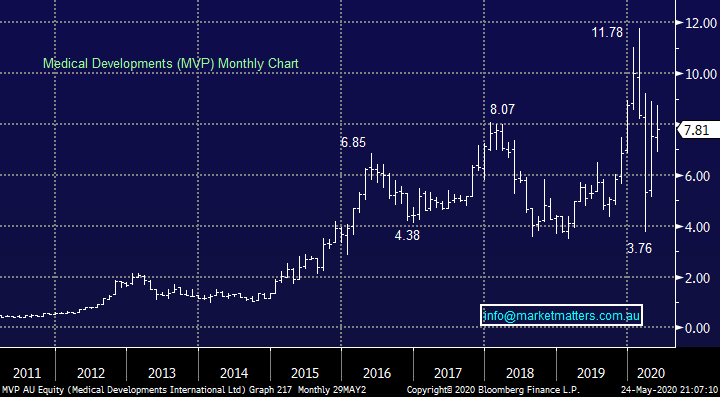
This developer and manufacturer of pharmaceutical drugs / medical equipment specialises in emergency pain relief & respiratory products, which obviously explains its recent spike towards $12. MVP does indeed look very expensive on traditional matrices which increases the risk around this $8 area, the stocks volatility over recent years underlines the risk / reward awareness investors need with MVP.
Gross revenue soared almost 20% to $21m for FY19 flowing down to a $1m profit which indeed makes this $500m business feel expensive carrying plenty of risk. We like the direction of MVP but feel news driven pullbacks are a strong possibility in the months / years to come hence we would only consider into weakness at lower levels.
MM is neutral MVP.
Medical Developments (MVP) Chart
Question 11
“James Ease up on the criticism of Australia in relation to the China matter. I don't think Australia is making all the provocations here. You need to see how 'aggressive' China is being around the world, not just towards Australia. How do you think we should respond to the boorish comments from the Chinese Ambassador??” – Phil WW.
Hi Phil,
I totally get your thoughts, it feels like we’ve touched a couple of nerves between your question and Jan’s / Glenn’s earlier, I can assure you that was not the intention, we write our reports with both eyes on financial markets and those factors which impact them. Hence we cannot ignore news that can potentially move markets and at times its inevitable our feelings will surface at times.
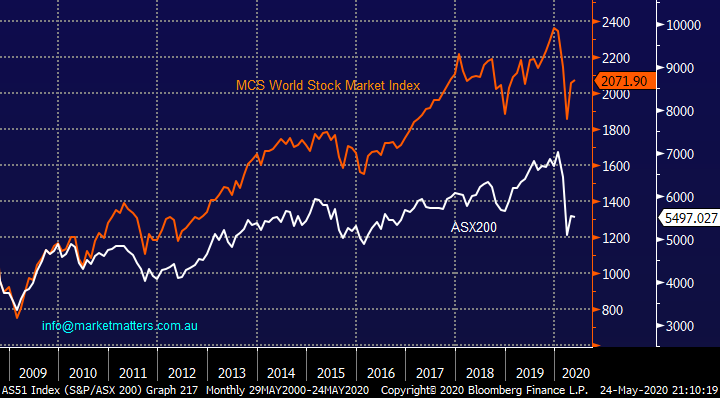
I simply feel there’s a smarter time to pick a fight on the political level, especially with larger adversaries, and as we look to get our economy back on its feet does not feel opportune, even if China “started it”. As the chart below illustrates our stock market needs all the help it can get on the global scale.
We feel the ASX is poised to regain some of its underperformance in H2 2020 and 2021.
ASX200 v MSCI World Index Chart
Question 12
“I am a novice with income securities and am interested in how you calculate the expected income and the income received for CBAPG when the latest quarterly distribution (franked) is about 70 cents per security which if you multiply the payment by 4 is about 2.8% plus franking. I have obviously got it wrong but don't understand how you reached your numbers. “ - Thanks Ram.
Hi Ram,
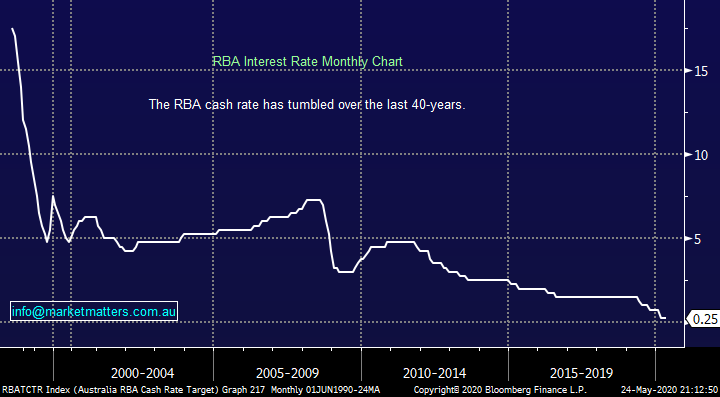
When we consider income securities like hybrids we / the market quotes income inclusive of franking so it’s a fair playing field when comparing to other income investments like bonds and cash. We also factor in the yield curve i.e. the markets current expectation of where interest rates will be in the future. If the security is trading below face value ($100) we would also include the annual capital gain benefits as the security moves from current prices back to its $100 face value (in the context of hybrids). There’re there are a few different calculations.
Cash yield: = cash dividends as you have outlined
Running yield = cash dividends plus franking benefit. For a dividend franked at 100%, divide the dividend by 70%. i.e. 70c/0.70 = $1.00 inclusive of franking *4
Yield to first call = cash dividends plus franking benefit, plus capital gains calculated to the first call date of the security.
MM remains bullish CBAPG
RBA Cash Rate Chart
Question 13
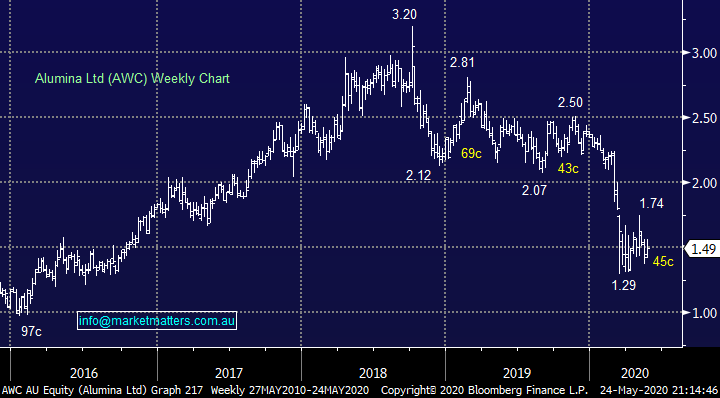
“Hi James, I bought AWC some time ago at $2.80. What do you or Peter O'Connor think about buying AWC at present so I can reduce my average price? What is happening in the aluminium market at present?” - Best wishes John K.
Hi John,
MM bought AWC 10-days ago so we’re on the same page! However I would point out we only took a small position to enable us the flexibility to average at lower prices should they unfold – the trend is clearly down and a test of $1.20 should not be ruled out. Peter O’Connor has a buy and $1.80 price target. The consensus price target for AWC is $1.74, 6 buys, 6 holds and 1 sell.
MM likes accumulating AWC at current levels.
Alumina (AWC) Chart
Question 14
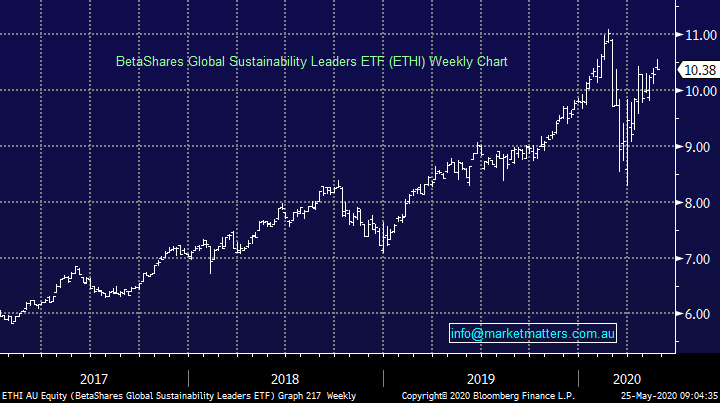
“Hi James and crew, As always thanks for your great market updates! I have noticed an increasing number of large investors deciding not to invest in oil on ethical grounds - it seems like an emerging trend. Could you suggest some ASX listed companies in the renewable energy space, and any general opinions you have on these companies?” - Thanks again, Richard H.
Hi Richard,
Ethical investing is very much at the forefront of many people’s minds on all levels from huge sovereign wealth funds to people like ourselves. At this stage with new companies / technologies vulnerable to failure I would consider more diverse ETF’s like the BetaShares Global Sustainability Leaders ETF that invests in a portfolio of global businesses that are identified as ‘Climate Leaders”.
BetaShares Global Sustainability Leaders ETF (ETHI) Chart
Question 15
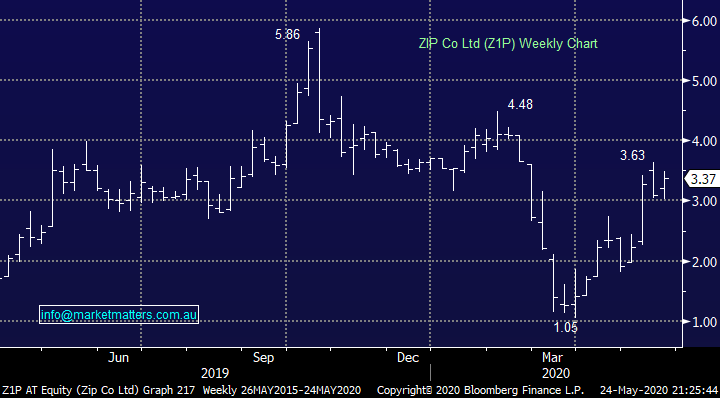
“Hi James and Team , I subscribed a few weeks ago and really enjoy your commentary - thank you. Two of the major themes that are increasing important in the technology space are cloud and data/ payments In this context , which two quality ASX listed stocks would you like to buy / add to and at what price” - Cheers David P.
Hi David,
You are indeed correct, these are 2 very “Hot Sectors” at present with 2 local standouts below, I haven’t gone to the sector leader APT because I have donned my risk / reward hat but their alignment with Tencent (700 HK) is impressive.
1 – Zip (Z1P) – we have discussed Z1P over recent months and MM likes this digital payment service with an initial target ~$4 but the bigger picture also looks good.
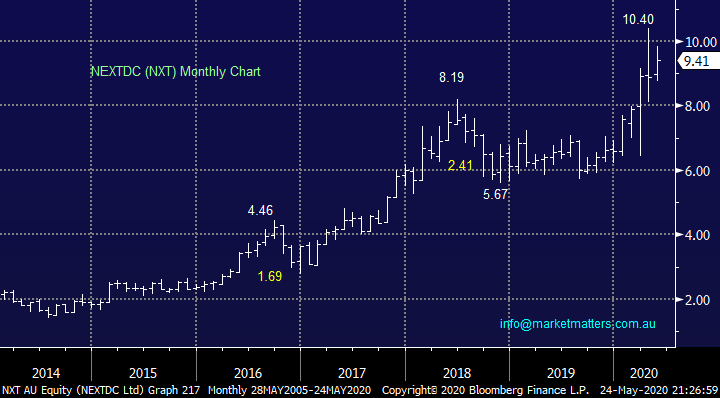
2 – NEXTDC (NXT) – Data centre operator NXT has enjoyed strong growth over recent years and the company comfortably raised $672m for growth in April, we feel fresh all-time highs are not too far away - our Telcos are missing the bus here badly. A cheaper option in the datacentre space is the 360 Capital Digital infrastructure Fund (TDI).
Zip Co. Limited (Z1P) Chart
NEXTDC (NXT) Chart
Question 16
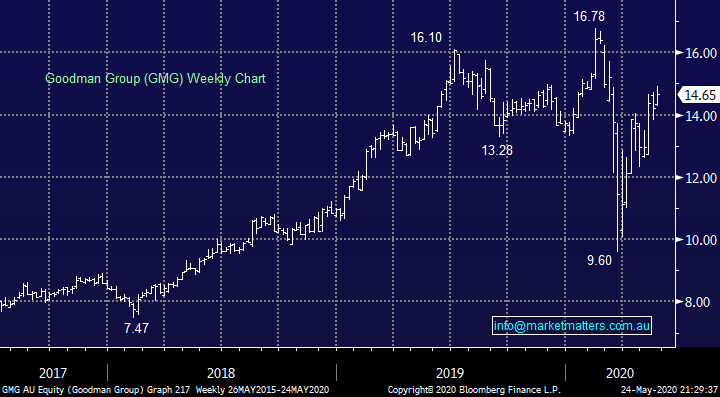
“Guys, I am a recent subscriber to MM. You have mentioned GMG a few times recently and see them as a buy into weakness. At what price do you see them as a buy?” - Thanks Colin H.
Hi Colin,
GMG as is often the case with quality companies rarely gives optimum buying opportunities – the buyers are lined up for weakness. We think the stock is an ideal candidate to simply accumulate on the backfoot because its likely to hold up well, while our ideal area is around $13.50, sub $14 will catch our attention, or 4-5% lower.
MM’s optimum buy area for GMG is now ~$13.50.
Goodman Group (GMG) Chart
Question 17
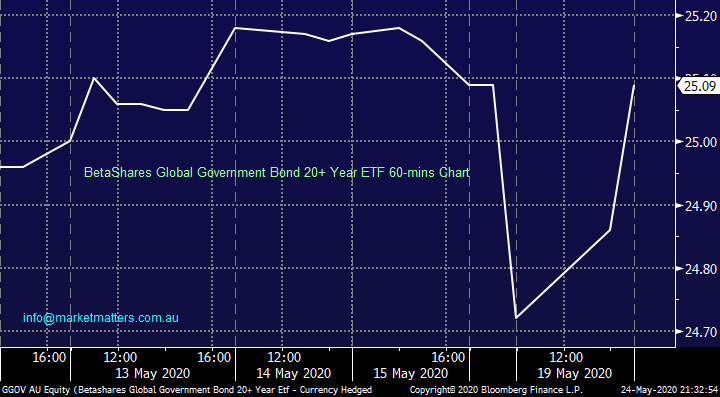
“Hi thanks for the opportunity to ask a question, the new ETF GGOV can you give me a MM view on this product further to the information from BetaShares, to me it seems like it may have a place in a portfolio should we fall on harder times.” – Bruce J.
Hi Bruce,
It is a portfolio of long dated government bonds as the name suggests. In the short term, if the market struggles from here, this ETF will hold up, however this is not something we are at all positive on.
Buying this ETF locks in a return of 0.86% per annum for the next 21 years (modified duration of the portfolio). While this is a very secure ETF, we doubt this sort of return will keep pace with inflation.
MM has no interest in the GGOV
BetaShares Global Government Bond 20+ Year ETF Chart
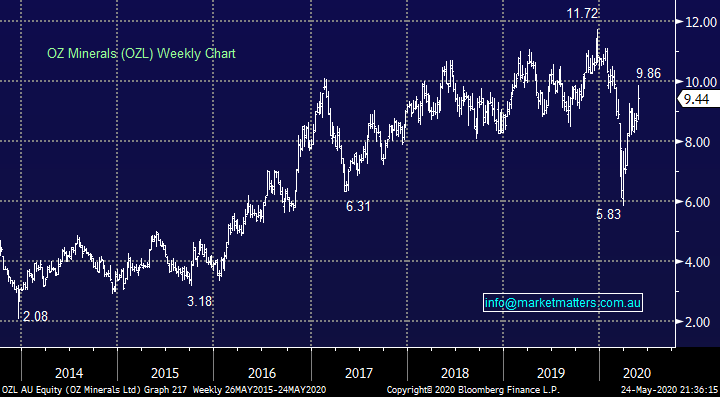
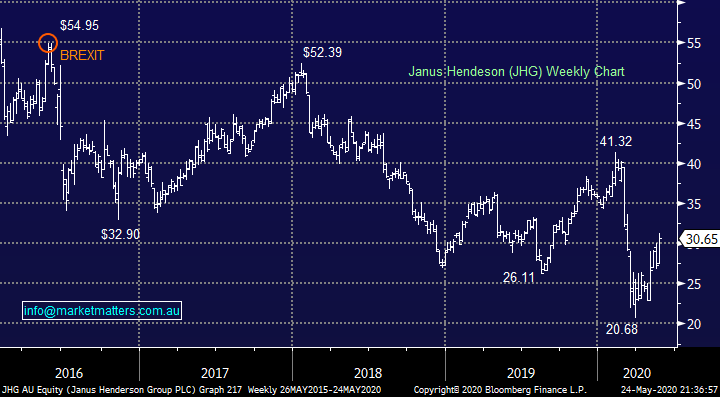
Question 18
“Can I have your thoughts on OZL & JHG please. Both have rallied hard over the past few weeks & is it time to take some money off the table.” - Thanks Ian C.
Morning Ian,
Two stocks MM have been involved in over the last 6-months, below is a quick snapshot of we see things today:
1 – MM remains long and bullish OZ Minerals (OZL) targeting fresh all-time highs medium-term.
2 – MM is bullish Janus Henderson (JHG), in line with our overall market view, with an ideal short-term buy area around $28. We hold in our international equities portfolio.
OZ Minerals (OZL) Chart
Janus Henderson (JHG) Chart
Question 19
“Hi James, reading you daily report yesterday and I just wonder if there is schedule/calendar for company announcement of business update or half year results. These announcements are price sensitive and it would be handy to have them.” -Thank you, Tony N.
Hi Tony,
We are approaching the end of our journey to take the MM website / offering to the next level, or 5, and this is one area we are looking at delivering.
Question 20
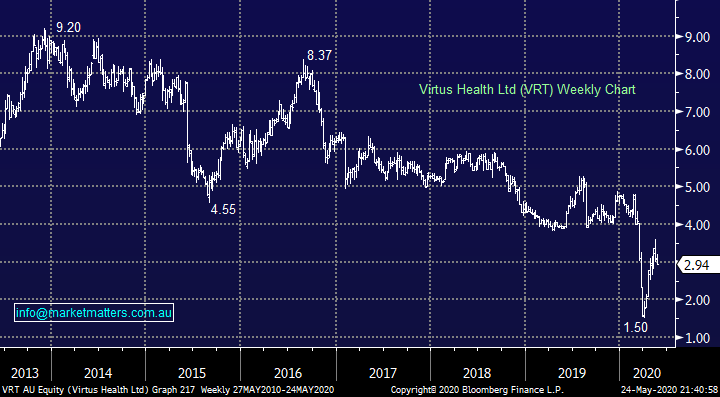
“Hi, Can you give me your thoughts on Virtus Health, VRT” – Regards Mark M.
Morning M,
VRT was struggling before COVID-19 which is not the ideal profile for stocks we’re looking to buy although as we did with AWC, hence never say never. The fertility treatment business has been delivering a solid reliable fully franked dividend which would put it on over 8% yield before franking benefits, certainly eye catching in today’s environment. Unfortunately like so many businesses the virus has stopped VRT in its tracks but back towards $2.50 the risk / reward for aggressive chasers of yield into the future is definitely interesting – on our watchlist for the MM Income Portfolio.
MM is currently neutral VRT.
Virtus Health (VRT) Chart
Question 21
“Good afternoon, recent subscriber and was encouraged to send thru questions for covering in Monday call. Lots of discussion on China and Australia and potential trade disruptions, I hold following shares (which I am still quite comfortable with as longer terms plays). Interested in own thoughts on escalating China Australia trade tensions just an opportunity to buy certain companies and sectors if they are sold off as a result. I gold following at the moment that could be impacted directly or indirectly on escalating conflict:
* BHP - china/Australia tensions could results in less shipments temporarily but cud also result in higher iron ore prices - net/ net cud cancel out? Irrespective I am still a happy long term holder of this stock at right levels (sub $30)
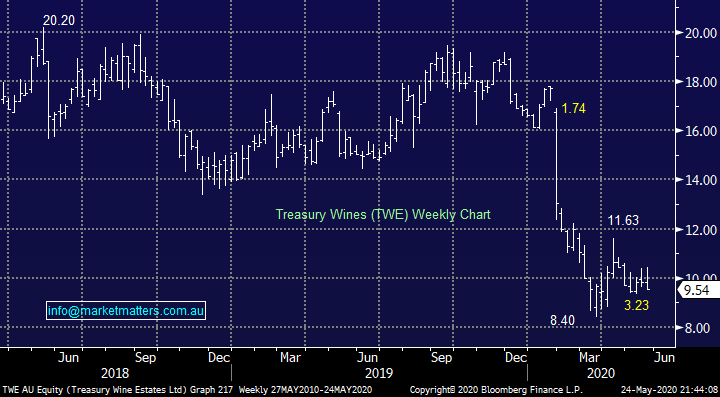
* TWE - in the news a lot of recent times but still like the business and feel that new management will get ship in order for more stable growth and less "mishaps". Could be directly impacted by China tit for tat pettiness (wine is high profile). So what do you think on this stock
* TGR - love this company - good business, growing and diversifying, lower A$ helps in export markets, stable dividends.. If China stops being a market temporarily expect other Asian markets will pick up the excess.”
Many thanks, Mark P.
Morning Mark,
Like ourselves we must simply “watch the tape” to see if the market becomes concerned with escalation of trade concerns with China, at the moment its all quiet on the western front:
1 - BHP Group – we are happily long and would consider buying more, or other sector members into weakness.
2 – Treasury Wines (TWE) – not for us at present, its struggling on too many levels not just trade concerns with China. There are a number of people I speak with who are very bullish this stock including Martin Crabb who is Shaw’s CIO, however I can’t see it.
3 – Tassal Group Ltd (TGR) – we also like this business and would be interested on a risk / reward basis around $3.50, or 8% lower.
Treasury Wines (TWE) Chart
Question 22
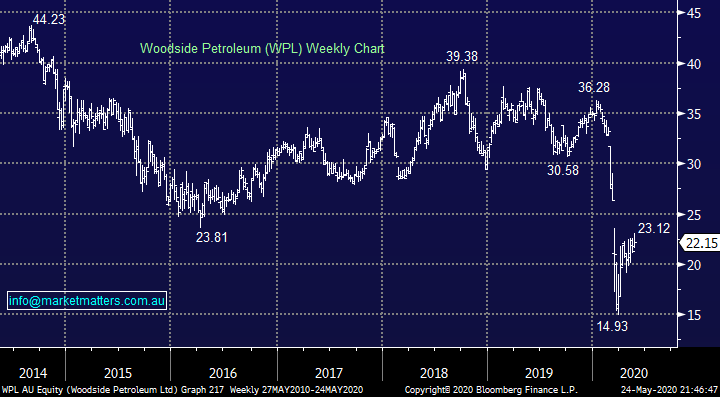
“Hi Guys, how come you didn’t include Woodside (WPL) in you Friday evaluation of the Energy / Oil Sector and choice to close out Santos please ? Cheers Steve K.
Morning Steve,
We simply focussed on stocks we held in our Growth Portfolio, Woodside resides in our income portfolio – it was nothing personal towards WPL! For the record MM likes WPL back under$20.
We chose to take our $$ on Santos (STO) on Friday for a couple of reasons – it had hit our target, MM was very overweight both the Energy Sector and Stocks hence it was an ideal place to increase cash levels as we became more neutral stocks following their strong rally.
Woodside Petroleum (WPL) Chart
Question 23
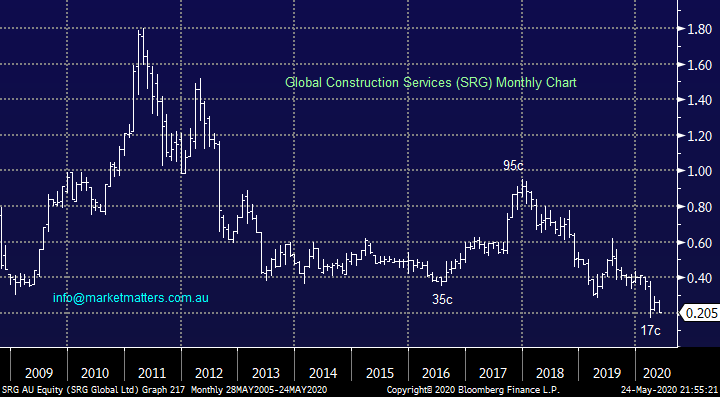
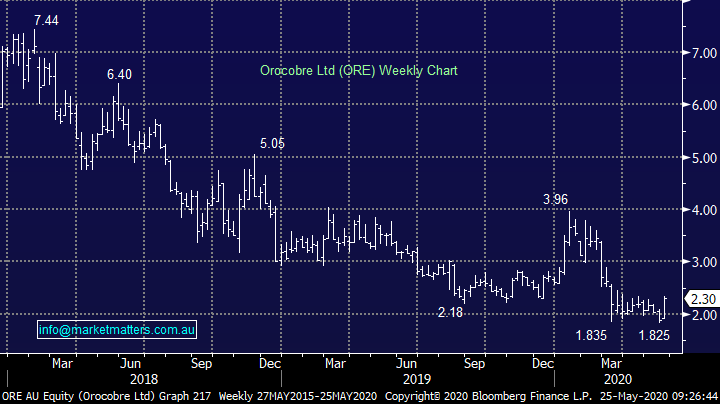
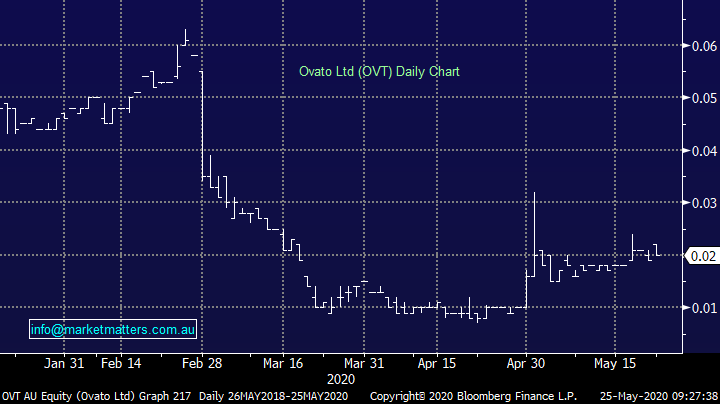
“Hi Team, please could you provide a view on: SRG, do you think they offer value at $2.05 and potentially placed to benefit from infrastructure spending? Also, ORE has generally been above $2 for most of the last 6 years is it a good time to adopt a long term position in Lithium? And finally OVT, I made a fortuitously timed entry in April, on the 1st of May the price rocketed (albeit on low volumes) to the extent that it suspended trading, do you have any view/idea what is happening with Ovato?” - Many thanks, Nick R.
Morning Nick,
The markets telling us SRG is not the ideal place to benefit from looming large infrastructure spend, I feel we should listen to them at least for now. It continues to burn cash, has a weak balance sheet on initial glance and is not one for us.
MM has no interest in SRG.
Global Construction Services (SRG) Chart
Orocobre (ORE): after an initial flurry into Lithium, the market has gotten concerned with the mismatch between actual demand and looming production. The main stocks remain in a downtrend and until we see sustained interest in the sector, we have no interest trying to pick a bottom.
Orocobre (ORE) Chart
Ovato (OVT): No idea I’m afraid Nick.
Ovata (OVT) Chart
Question 24
“Hi James & Team, Would you please advise on the following:
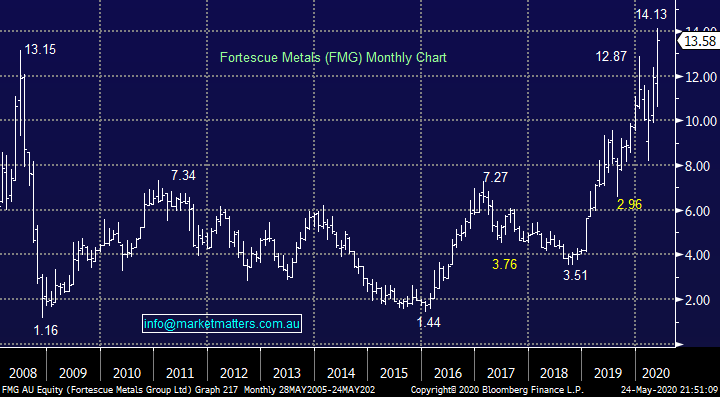
1) Is it too late to chase the mining shares especially FMG or E-commerce stocks like KGN & Amazon?
2) I have the habit of only subscribing to SPP on the day of closing via BPay. It was pointed out to me that the company may close the SPP early without warning & there is no real advantage of cutting it so fine. What do you think?
3) I am wary of a second leg down in the stock market. Are there stocks that are so undervalued at present that they can weather another leg down?
Thanks for your assistance.” - Sidney H.
Morning Sidney,
1 – No we still like mining and IT stocks as we said over the weekend but I wouldn’t go “all in” at current levels.
2 – We do the same. Its very rare for an SPP to close early, but never say never.
3 – Stocks / sectors which held up in the 1st wave are likely to do so again e.g. Healthcare and some IT. However its likely if we do get whacked again the selling will be predominantly across the board.
Fortescue Metals (FMG) Chart
Question 25
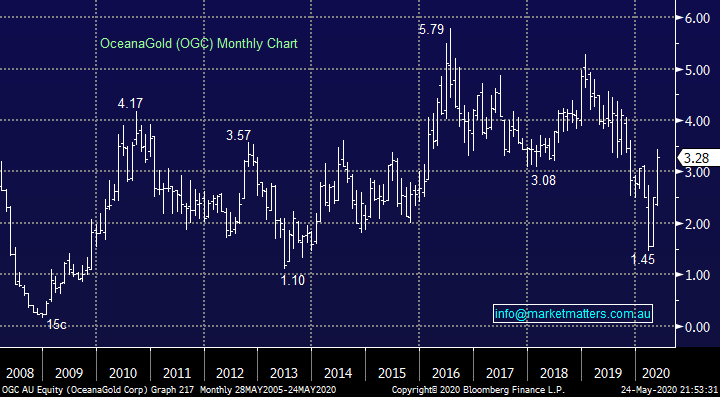
“Hi guys. Nice work during this torrid time. I would like to know your thoughts on a gold stock OGC. It moved over 30% last week and seems to be recovering from a long and slow drop. If it's mine in the Philippines gets out of its care and maintenance scenario it could make a stellar move??” – Wayne S.
Morning Wayne,
Its obviously a big if for OGC and its Philippines mine and the stocks performance has been reflective of this – not all of the local sector has enjoyed the last few years surge in the precious metal. Risk / reward back under $3 is interesting but this is clearly a news driven play (punt) but as you say the right news should be very bullish.
MM is neutral OGC.
OceanaGold (OCG) Chart
Overnight Market Matters Wrap
- A quiet session was experienced on Friday in the US, ahead of both markets in the US and UK being closed tonight
- On the commodities front, gold currently sits with little change at US$1732.02/oz. while both copper and crude oil traded lower.
- BHP is expected to outperform the broader market after ending its US session up an equivalent of 1.32% from Australia’s previous close.
- The June SPI Futures is indicating the ASX 200 to open 78 points higher, testing the 5575 level this morning.
Have a great day!
James & the Market Matters Team
Disclosure
Market Matters may hold stocks mentioned in this report. Subscribers can view a full list of holdings on the website by clicking here. Positions are updated each Friday, or after the session when positions are traded.
Disclaimer
All figures contained from sources believed to be accurate. All prices stated are based on the last close price at the time of writing unless otherwise noted. Market Matters does not make any representation of warranty as to the accuracy of the figures or prices and disclaims any liability resulting from any inaccuracy.
Reports and other documents published on this website and email (‘Reports’) are authored by Market Matters and the reports represent the views of Market Matters. The Market Matters Report is based on technical analysis of companies, commodities and the market in general. Technical analysis focuses on interpreting charts and other data to determine what the market sentiment about a particular financial product is, or will be. Unlike fundamental analysis, it does not involve a detailed review of the company’s financial position.
The Reports contain general, as opposed to personal, advice. That means they are prepared for multiple distributions without consideration of your investment objectives, financial situation and needs (‘Personal Circumstances’). Accordingly, any advice given is not a recommendation that a particular course of action is suitable for you and the advice is therefore not to be acted on as investment advice. You must assess whether or not any advice is appropriate for your Personal Circumstances before making any investment decisions. You can either make this assessment yourself, or if you require a personal recommendation, you can seek the assistance of a financial advisor. Market Matters or its author(s) accepts no responsibility for any losses or damages resulting from decisions made from or because of information within this publication. Investing and trading in financial products are always risky, so you should do your own research before buying or selling a financial product.
The Reports are published by Market Matters in good faith based on the facts known to it at the time of their preparation and do not purport to contain all relevant information with respect to the financial products to which they relate. Although the Reports are based on information obtained from sources believed to be reliable, Market Matters does not make any representation or warranty that they are accurate, complete or up to date and Market Matters accepts no obligation to correct or update the information or opinions in the Reports. Market Matters may publish content sourced from external content providers.
If you rely on a Report, you do so at your own risk. Past performance is not an indication of future performance. Any projections are estimates only and may not be realised in the future. Except to the extent that liability under any law cannot be excluded, Market Matters disclaims liability for all loss or damage arising as a result of any opinion, advice, recommendation, representation or information expressly or impliedly published in or in relation to this report notwithstanding any error or omission including negligence.