Subscribers questions (DDR, CBA, ORE, FMG)
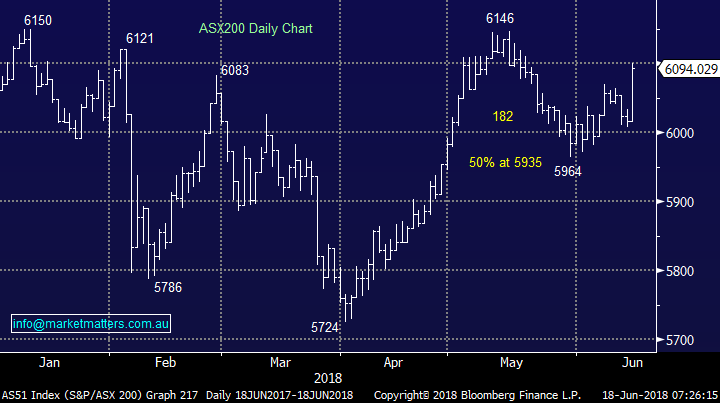
As I type this report I’m pondering whether the ASX200 can extend Friday's gains in the face of weak overseas equities and commodities, plus further trade war tensions between the US (Trump) and China. Usually I would say no, there’s simply too much negativity / risk for the bulls to push local stocks higher next week but today I’m actually 50-50.
On Saturday morning in the face of adversity, the SPI (ASX200 futures) closed unchanged, a huge effort considering BHP closed down -2.5% in the US, but with EOFY only 2-weeks away anything can happen hence my rare “on the fence stance”.
- We remain mildly short-term bullish the ASX200 while the index holds above 6060 but the risk / reward is no longer exciting for the bulls.
This week we’ve again received some excellent questions with some further nice compliments plus a couple of more “hard” comments, don’t worry we address them all and please keep them coming!
Remain open-mined has been the MM catch cry of 2017/8 and the market has already given us plenty of reasons to believe it’s a vital investment trait moving forward but the sporting front threw up a fascinating illustration on the weekend:
- In the soccer World Cup - Iceland drew with mighty soccer mad Argentina, a population of 44 million compared to Iceland’s only 337,000!
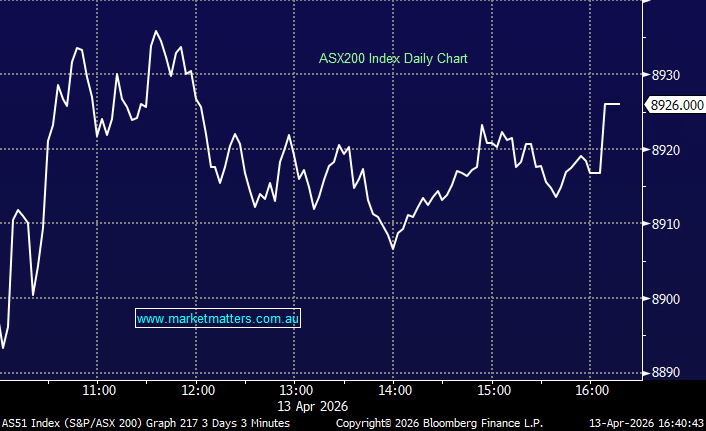
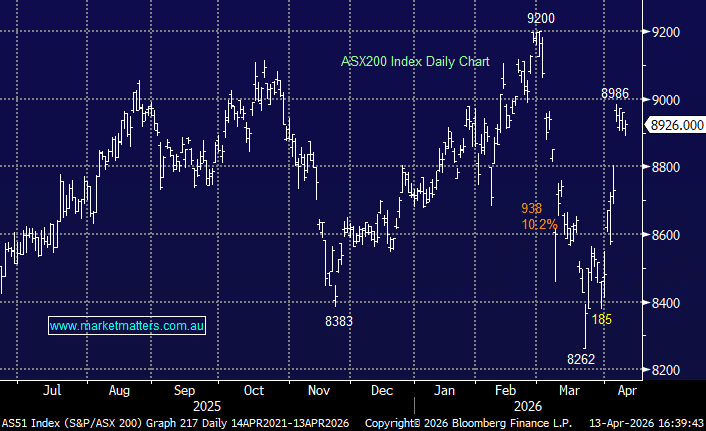
ASX200 Chart
Question 1
“Hi James, within the last year some reputable Long Short investment funds have entered the ASX via IPO's, notably so VGI (VG1) and L1 (LSF). Both entered at $2/share, but so far with somewhat differing success.
Just want to get your thoughts on this kind of investment tool and to what extent they would offer protection against a potentially very volatile or correcting market place?” - Best regards Jan.
Morning Jan, thanks for a great question! Firstly lets explain the concept of a long – short fund:
- “Long/short” is an investment strategy generally associated with hedge funds, and more recently certain progressive traditional asset managers. It involves buying equities that are expected to increase in value and selling short equities that are expected to decrease in value.
Hence in an investment of this nature is backing the fund manager more than the stock market itself i.e. they can make money in a falling market but they can also lose in a rising one.
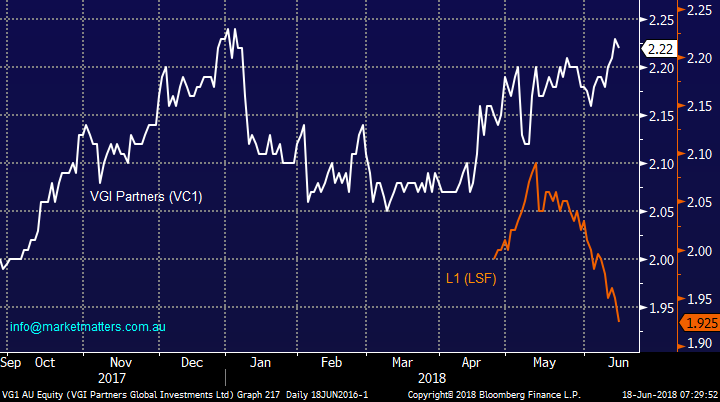
Both of the funds you quoted are investing predominantly in Australia and New Zealand but they also venture further afield and as you point out with very different results. LSF raised more money initially than VG1 although both track records are strong ones over time. Interestingly, the first full month of performance from LSF released at the end of May showed a negative return of 4.1% for the month - a terrible result really and the first time the fund has dropped by more than 2% in a month in over 4 years. The NTA post tax of this fund currently sits at $1.89 versus the stock price at $1.925. In terms of VGI, they had a better month adding 1.3% and they are up 2.2% over the past 2 months. Their post-tax NTA sits at $2.13 yet the stock price is $2.22, implying that the market is currently paying a premium over the value of the assets to get exposure to the manager – something we’re usually reluctant to do.
Hence to answer your question they can in theory offer protection against a volatile / falling market but their performance still comes down to the fund managers getting it right – something L1 Capital is yet to do since listing.
VGI Partners (VGI) v L1 (LSF) Chart
Question 2
“Hi MM, what would be your recommendations on selling either my WBC or NAB holding to switch into CBA. I'm sitting on about a 13% capital loss on both position so was thinking on selling one of these positions and buying into CBA to offset capital gains.
I know you can only provide general advice but would like to hear your opinion. Keep up the great work and transparency, I always look forward to reading the reports.” - Cheers, Mitch N.
Hi Mitch,
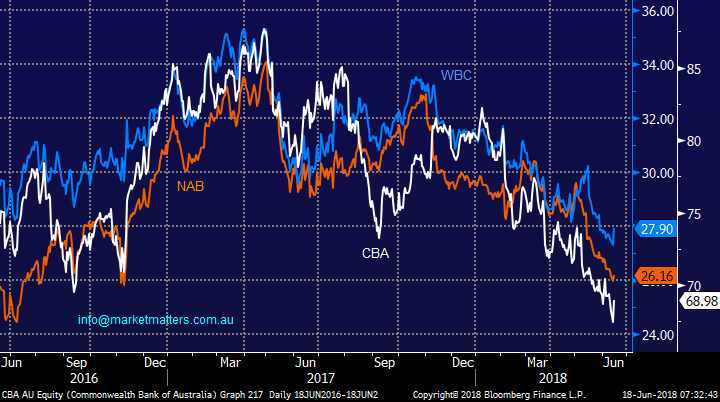
Thanks for the kind words and you’re certainly correct, we simply provide General Advice on stocks which means we don’t take into consideration a subscribers objectives or personal situation when we write. The chart below illustrates that the banks you mentioned have moved very closely over the last 2-years but over the last year there has been a ~7% difference in performance:
- Commonwealth Bank (CBA) -15.7%, National Australia Bank (NAB) -12.3% and Westpac (WBC) – 8.6%.
All 3 have endured a tough time with CBA the worst as it’s lost most of its premium over the sector – a mantle its held for many years and in our view, rightly so.
- CBA P/E 12.8x & yields 6.2% ff, National Australia Bank (NAB) P/E 11.9x & yields 7.57% ff and Westpac (WBC) P/E 11.2x & yields 6.74% ff.
As subscribers know MM hold all 3 banks, from higher levels but we are buyers into weakness with CBA now our preferred choice, ideally below $65. Unfortunately Mitch on the tax side of things that’s a decision for you!
WBC, NAB and CBA Chart
Question 3
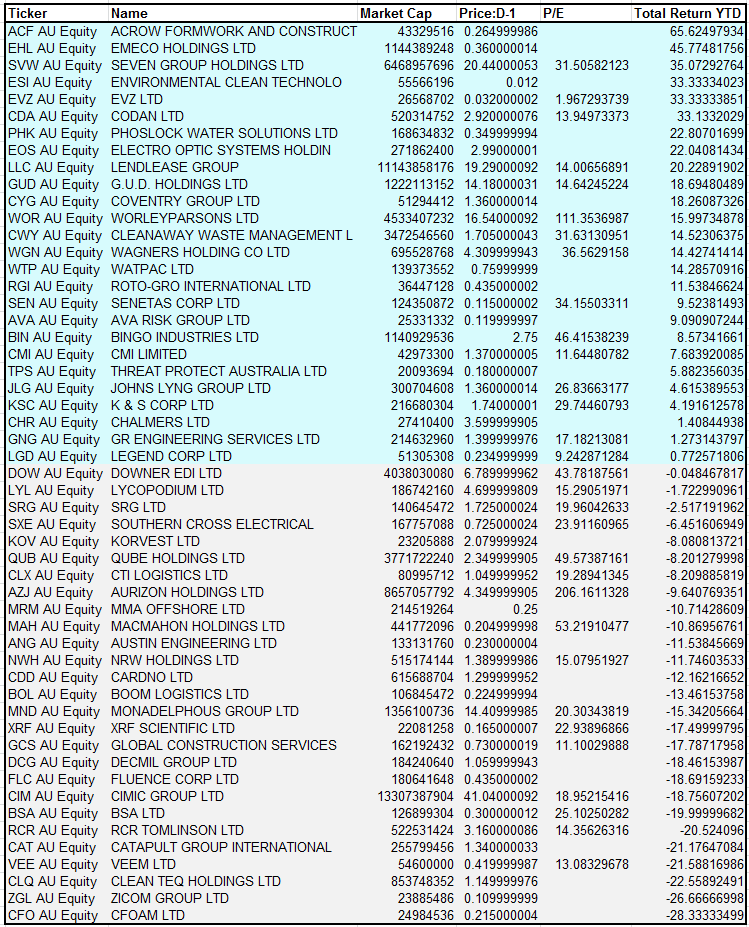
“Which companies might benefit from the $6bn of new mining projects approved in recent weeks?” – Thanks Marc.
Hi Marc,
A good question and a topic that we can expand on in a note soon. In simple terms, new mining development has positive implications for Mining Services companies mostly from engineering services providers, to form workers and waste disposal companies. Although we stay largely in the bigger cap names, below is a more comprehensive look at larger (and smaller) cap companies exposed to this area. We’ll provide some more concise views here soon.
Question 4
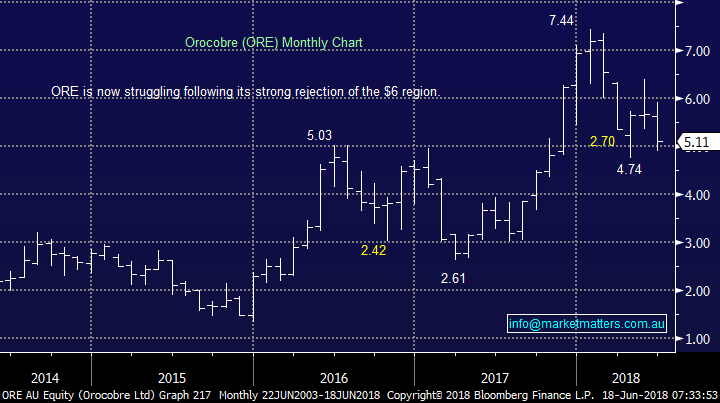
“Why didn't you sell Orocobre (ORE) - chart looks terrible and no found fundamental reasons for holding?” – Simon T.
Hi Simon,
You’ve certainly pinpointed our most uncomfortable position at this point in time, the one which we have deliberated at length during the last few weeks. There is certainly a large degree of optimism built into the sector which can always be dangerous.
The lithium producer has been on a rollercoaster ride since we re-entered in late March ~$5.79 – we’ve been both up +10% and down -18% on the position in just a few months. I assume you mean why didn’t we sell on the spike above $6 and the obvious answer is I wish we had but hindsight is a great investor. Our current view is the stock will trade predominantly between $5 and $6 over the coming months and we are likely to consider exiting accordingly. We hold no other exposure to the resources sector at present which allows us a degree of comfort although clearly ORE / lithium stocks runs their own race to a large degree.
Also, on an optimistic note, in January ORE raised money with Toyota buying a large stake at $7.50 a share, we still maintain there’s a possibility they may increase this holding into current weakness i.e. ~30% lower.
Orocobre (ORE) Chart
Question 5
“What kind of madness got into you guys this morning? Surely you know its madness to sell on open unless the sky is about to fall in. Was it the Oz article about Atlas? Please tell me as my faith in you has taken a big hit, (not to mention my portfolio as I now absorb a loss on FMG).” – Regards Bev.
“Hi MM / James, thanks for great analysis of individual stocks that are on the radar – please keep it up. Here’s one you may like to look at on Monday questions: I was a little surprised at your ‘short term’ (ultimately losing) trade in FMG over past couple of weeks. I have been trading FMG quite regularly and profitably for several years (3 profitable closed trades in the last 14 months alone) and there are two things I’ve learned about trading FMG:
(1) I will usually not be able to Buy at the periodic low point in FMG’s cycle – in most cases FMG will go lower after I have bought, sometimes considerably lower, so there’s no point in setting a stop – better to limit my position size instead to reduce risk;
(2) I will never presume to pick a time limit that I should be invested in FMG (or any stock for that matter), since the time it takes for FMG to move suitably higher (my trading plan requires at least 10% above my break-even Buy price) is totally unknowable (my last 3 hold periods in FMG between Buy and Selling profitably have been 2.5 months, one week, 4.5 months).
Thanks again for great coverage and education.” – Thanks Gil W.
Morning Bev & Gil,
We were due some tough questions and this clearly fits the bill. There’s a number of points raised above which we will address individually.
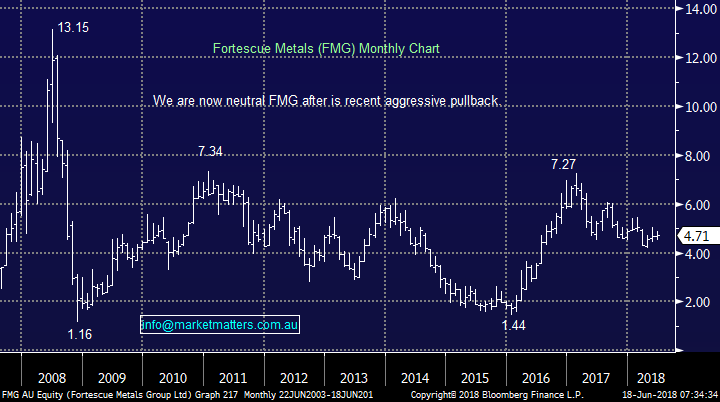
1. This is our first “trading / active position” loss in FMG on over 10 attempts, not too bad especially as the loss was only ~5% but unfortunately inevitable over the course of time.
2. We sold FMG on open because it has significant depth, this would definitely not have been our approach with a stock like Webjet (WEB).
3. With “trading / active” positions we follow our plan, in this case it was a stop on a close below $4.60, subscribers who watch the market closely could easily have exited the day prior when FMG broke $4.60 but our alert was to inform less “hands on” subscribers. We pride ourselves on providing a realistic actionable service and our plan on that ‘short term’ position was to conserve capital if FMG broke $4.60 with the view of revisiting at a later date.
4. I agree with a lot of your logic Gil but I go back to the reason / type of position this was, i.e. an aggressive play with a stop, not an investment.
Fortescue Metals (FMG) Chart
Question 6
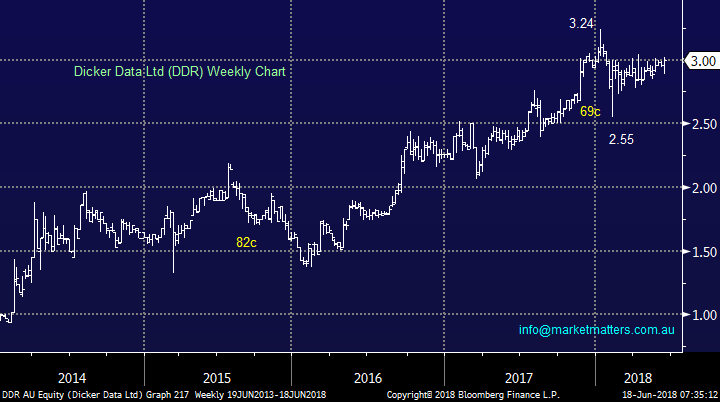
“Hi MM team, firstly I am really enjoying your market commentary and analysis, including your technical analysis which particularly interests me (please more). Also have you had a look at Dicker Data Limited – DDR. If you could give a fundamental and technical view, would they fall in the defensive group of stocks when the next correction occurs? Their dividend looks ok as well “-Thanks Tim C.
Hi Tim,
Thanks for the positive comments. Dicker Data (DDR) is a stock that the yield hungry could definitely consider - its paying 5.73% fully franked while only trading on a valuation of 16.1x Est 20-18 earnings. We have been watching DDR carefully for our Income Portfolio.
At MM we love the fact that Chairman and co-founder David Dicker who has run the company for 40-years still owns a substantial part of the business while the co-founder takes a salary of under $350k, very different from many big names we all know whose shares are falling – a great and often rare example of looking after shareholders. DDR’s a market leader in an IT hardware distribution industry which operates on tight margins and while its growth profile is moderate so is its valuation, you’re getting what you pay for!
Technically DDR looks set to make fresh highs up towards $3.30 but at these levels we would be sellers in the short-term, interestingly this fits our overall market view.
Dicker Data (DDR) Chart
Question 7
“Hello James Yes I also like your honesty it certainly is refreshing Taking the view as a subscriber to MM and we must look at performance of your newsletter against other newsletter subscriptions Which leads me to ask what if your wrong about the forthcoming correction” - Regards Alan G.
Hi Alan,
Thanks for the feedback and logical question.
As we discussed in the Weekend Report we invest from both a technical and fundamental perspective hence while we have been on the lookout for a decent correction for about a year we have remained basically fully invested in shares because the triggers to sell have not evolved – hopefully when we believe they have and we significantly increase cash / sell via ETF’s we will be correct similar to 2015 / 6.
However as you say what if were wrong? The answers simple we acknowledge it and buy back into stocks probably at slightly higher levels.
- Firstly, we are always comfortable to both miss a few % upside if the risk / reward dictates and secondly we have no ego issues buying a stock / market at higher levels than where we previously sold - we simply try to add value / make money in a prudent manner.
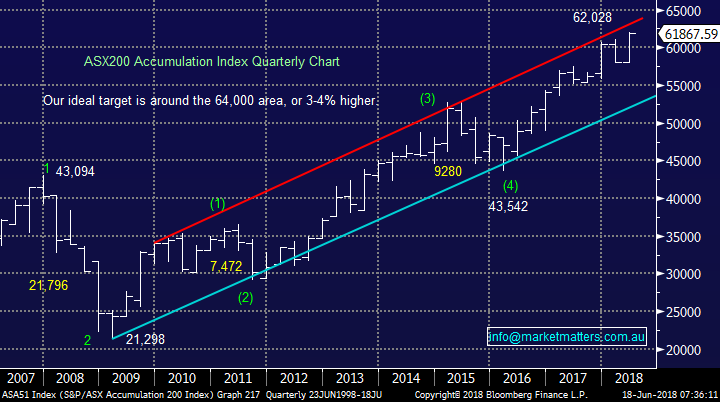
We believe a very exciting time for stocks is on the horizon so let’s all keep on our toes.
ASX200 Accumulation Index Chart
Overnight Market Matters Wrap
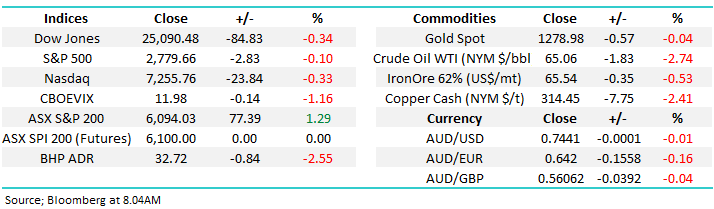
· The US markets closed marginally lower last Friday, as US-China trade tensions reignited as tariffs between both nations rise and looks to continue.
· Commodity markets suffered from the fallout of the tit-for-tat tariffs above, with across the board weakness in key base metals, copper and aluminium, along with oil and gold, with falls of between 2-3%. This saw both BHP expected to underperform the broader market after ending its US session down an equivalent of 2.58% from Australia’s previous close.
· The near term direction of the oil price, will be determined by this week’s OPEC meeting in Vienna, with increasing market expectations that the Saudis will push for increased supply levels of up to 1mmb/d to offset falling production from Venezuela and Iran.
· The June SPI Futures is indicating the ASX 200 to open with little change this morning, sitting around the 6100 level.
Have a great day!
James & the Market Matters Team
Disclosure
Market Matters may hold stocks mentioned in this report. Subscribers can view a full list of holdings on the website by clicking here. Positions are updated each Friday, or after the session when positions are traded.
Disclaimer
All figures contained from sources believed to be accurate. Market Matters does not make any representation of warranty as to the accuracy of the figures and disclaims any liability resulting from any inaccuracy. Prices as at 18/06/2018.
Reports and other documents published on this website and email (‘Reports’) are authored by Market Matters and the reports represent the views of Market Matters. The MarketMatters Report is based on technical analysis of companies, commodities and the market in general. Technical analysis focuses on interpreting charts and other data to determine what the market sentiment about a particular financial product is, or will be. Unlike fundamental analysis, it does not involve a detailed review of the company’s financial position.
The Reports contain general, as opposed to personal, advice. That means they are prepared for multiple distributions without consideration of your investment objectives, financial situation and needs (‘Personal Circumstances’). Accordingly, any advice given is not a recommendation that a particular course of action is suitable for you and the advice is therefore not to be acted on as investment advice. You must assess whether or not any advice is appropriate for your Personal Circumstances before making any investment decisions. You can either make this assessment yourself, or if you require a personal recommendation, you can seek the assistance of a financial advisor. Market Matters or its author(s) accepts no responsibility for any losses or damages resulting from decisions made from or because of information within this publication. Investing and trading in financial products are always risky, so you should do your own research before buying or selling a financial product.
The Reports are published by Market Matters in good faith based on the facts known to it at the time of their preparation and do not purport to contain all relevant information with respect to the financial products to which they relate. Although the Reports are based on information obtained from sources believed to be reliable, Market Matters does not make any representation or warranty that they are accurate, complete or up to date and Market Matters accepts no obligation to correct or update the information or opinions in the Reports.
If you rely on a Report, you do so at your own risk. Any projections are estimates only and may not be realised in the future. Except to the extent that liability under any law cannot be excluded, Market Matters disclaims liability for all loss or damage arising as a result of any opinion, advice, recommendation, representation or information expressly or impliedly published in or in relation to this report notwithstanding any error or omission including negligence.
To unsubscribe. Click Here