Subscriber’s questions (CZZ, MWR, XRO, VLW, MMI, RHC)
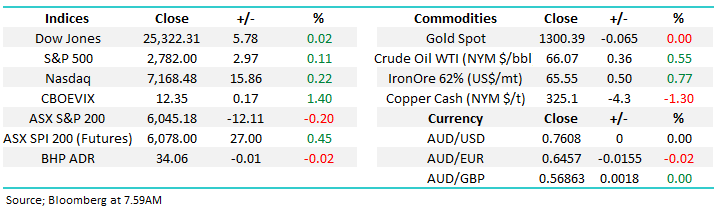
The ASX200 had a relatively poor day on Friday as investors / traders decided that prudence was the better form of valour ahead of the long weekend, but now the Dow has closed positive on the last 2-sessions, albeit in a small way. The local futures are indicating this morning we will open up round 30-points making fresh highs for June in the process. There are no clear leads on the stock / sector front with BHP looking set to open with little change, although news over the weekend in terms of Copper and Nickel may be a nett negative.
European indices are likely to offer a degree of encouragement to local stocks, with the UK market rallying strongly to close within 2% of its all-time high - remember that the ASX200 is far more correlated to the UK FTSE than the Dow.
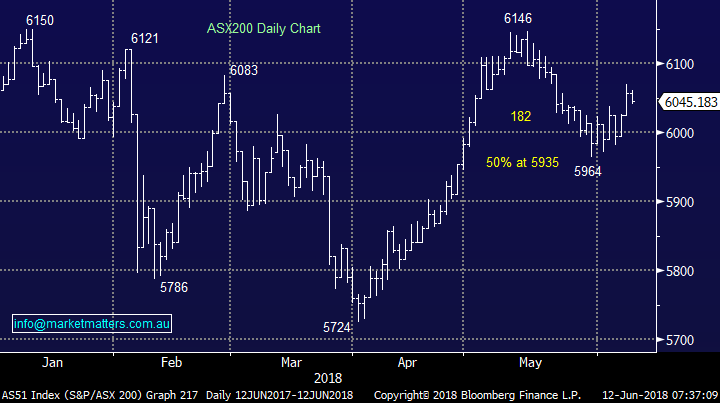
- We remain mildly short-term bullish the ASX200, but the risk / reward is no longer exciting for the bulls – especially considering our medium-term view.
This week we’ve again received some excellent questions with a few offering a degree of education, please keep them coming!
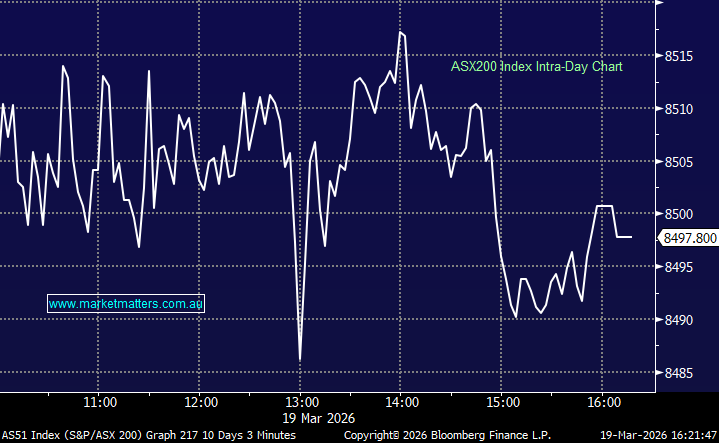
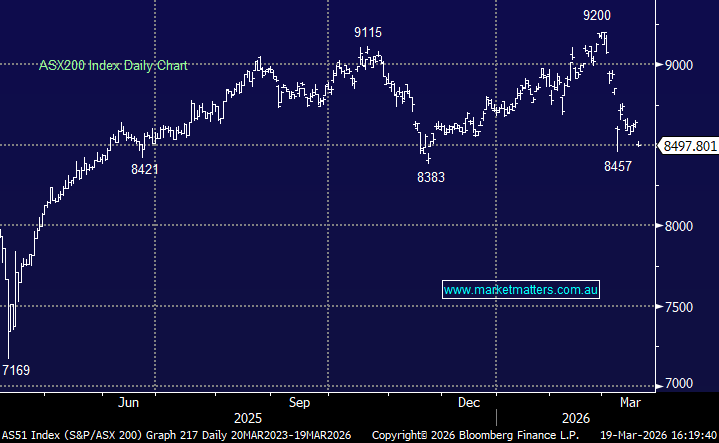
ASX200 Chart
Question 1
“Hi, can you educate those of us who are mystified why the ASX futures go negative despite a positive lead from Wall Street and usually go on to drive the ASX down? The corollary is when the futures are positive yet the ASX goes negative. What’s going on that we don’t see? Who drives the futures index?
I hold about 40% of my total investments in an Industry Super Fund which allows me to switch daily. I like this form of passive investing as it allows a quick exit if the market’s falling and the opportunity to arbitrage with a consistent pattern of falls and rises in the ASX. This is not too dissimilar to trading in ETFs but with a lower tax rates on gains.
Of late the ASX seems to be under sustained selling pressure and highly unpredictable. Understand the May/June historical trends but any insight beyond this is greatly appreciated.” - David
Hi David, a great question, one of the main insights we gained from our recent subscriber survey was the desire for education, hence thanks!
The ASX200 futures, called the SPI, is the contract over the ASX200 i.e. a basket of shares replicating the ASX200.
- The value of a single contract is a simple calculation: basis the June SPI at 6050 = 6050 x $25 = $151,250 worth of ASX200.
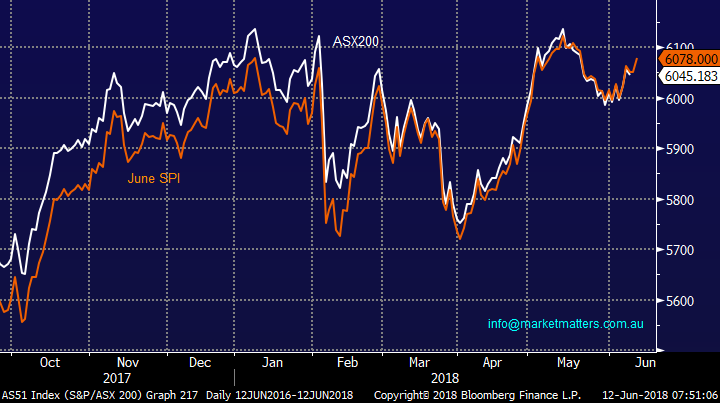
As you can see the below the SPI tracks the ASX200 perfectly courtesy of arbitrage – another subject, but briefly if the SPI trades too far above / below the ASX200 traders simply sell / buy the futures and an equivalent $$ value basket of ASX200 shares, they then sit back and wait for the futures to come into line, at the worst case this happens on expiry.
The SPI has what’s called a “fair Value” which is determined by a combination of cost of carry = interest rates, time to expiry and dividends being paid out before the end of the contract i.e. June today and fair value is about +3-points.
Coming back to your specific question(s), the futures market usually leads the ASX200 and as such often “tricks” investors watching the market just day to day. A few common scenarios:
- The classic example is our SPI may close up 50 points one day but at 4pm AEST the US S&P futures are up already 24-points.
- The next morning investors see the Dow up 150-points and think up we go BUT the US futures are actually well down on where they were at 4pm AEST.
- Also if a large capital raising occurs after we have closed this will often lead to selling in the SPI futures, ignoring offshore leads.
- Another easy one is the Dow may be up 150-points but if BHP is down say 2% the futures are likely to imply a lower open for our market.
- Lastly the SPI closes at 430, well after the ASSX200, hence it can close very optimistically /pessimistically but overseas indies disappoint in comparison the SPI can open very differently to a surface first impression.
The SPI allows professionals to quickly / efficiently change their market exposure e.g. sell 10 SPI this morning at 6078, where we closed at 730am and you’ve reduced your market exposure by around $1.52m without putting any though into specific stocks.
I agree the market tone is average at present, but it was the complete opposite in the first half of April - sentiment can change pretty quickly in equity land.
ASX200 v SPI Futures (June) Chart
Question 2
“Good Afternoon guys. Couple quick questions for you:
- The broker updates and price target quotes - where do you source this information from? I assume it's provided via a subscription service?
- Are there and short (position) ETFs that you could recommend for the major US market indices?
Cheers!” - Scott T.
Hi Scott, another question with a great education element, much appreciated.
- We use a Bloomberg professional terminal which alas costs around US$2500 a month per terminal but spending some time actively “googling” will probably yield the same result.
- Our friends at www.FNArena.com do have a more cost effective service that also tracks broker moves
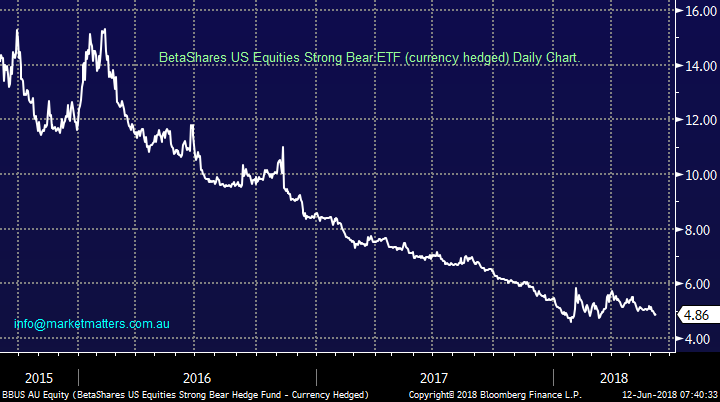
- We would probably use the BBUS but as you can see below this does exactly what it says – its negatively correlated to the US S&P500 hence it’s been a tough few years.
The ASX list of all ETF is shown below:
https://en.wikipedia.org/wiki/List_of_Australian_exchange-traded_funds
Beta Shares Strong US Equities Bear Hedge – FX hedged (BBUS) Chart
Question 3
“Thought this would be of interest. Very happy with MM your reporting is without doubt the best available on the internet. Your plain English style and willingness to recognize when you get it wrong is greatly appreciated” - David T.
Capilano Honey lose second Supreme Court judgement in 2 weeks as likely class action grows momentum: https://kangaroocourtofaustralia.com/tag/capilano-honey/
Hi David, much appreciate the positive feedback, hopefully we won’t have to put our hand up too much in the next FY when we get one wrong.
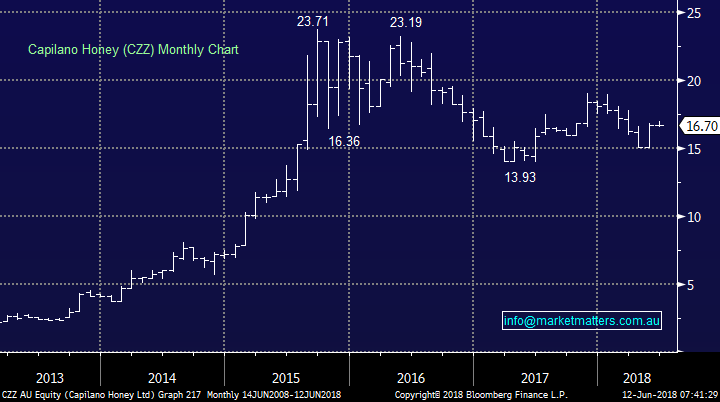
CZZ is a strange one to us but its undoubtedly had a great 5-years. There is a lot going in on the corporate level and you have to wonder if it distracts management. We would be playing the stock purely technically at this point in time:
- We could be long CZZ around this $16.70 area but would have stops at $15.80.
Capilano Honey (CZZ) Chart
Question 4
“Hi, in your report on 5th June, you discussed some health care stocks and their buy prices. Are these prices taking into account the correction you are expecting?” - Cheers John D.
Morning John, you would be referring to RHC and NAN a great question because the answers are actually totally different. Below are quotes from the said report:
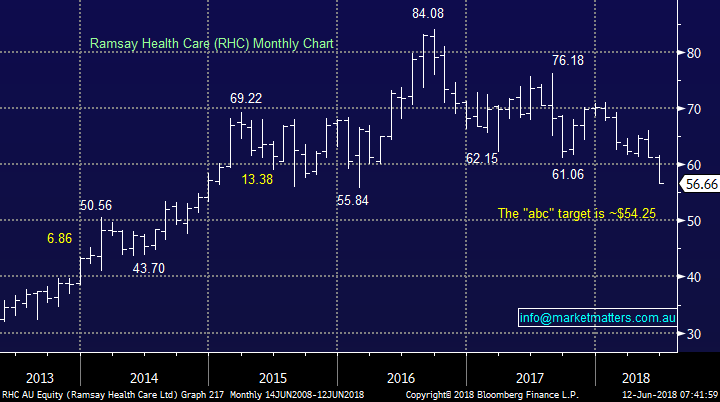
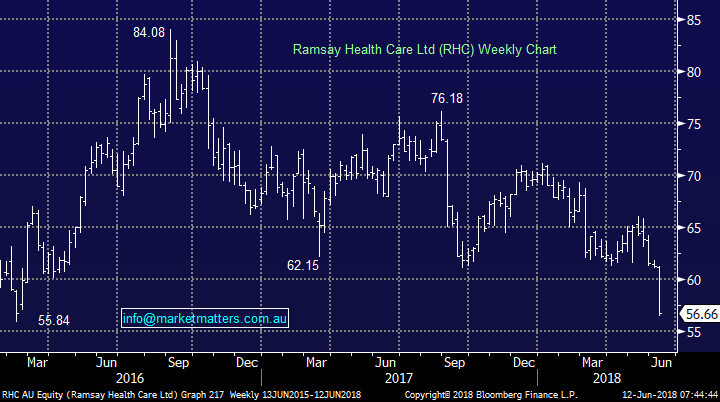
- At MM we have been bearish RHC for well over a year targeting the $55 area which is now ~8% away – MM is a buyer of RHC around $55.
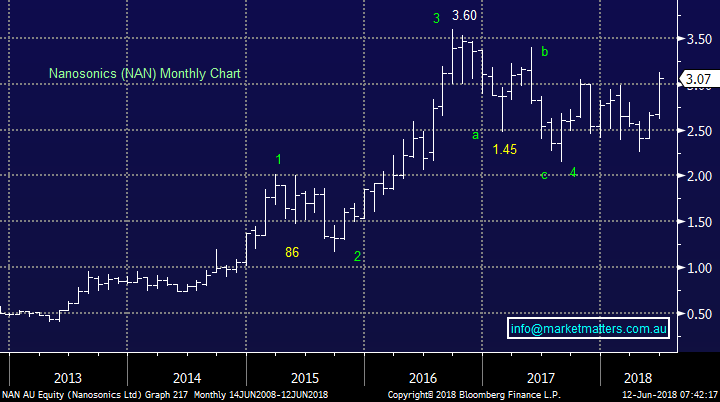
- We like NAN as a aggressive play / trade into EOFY with stops below $2.62 i.e. around 7% risk, targeting a ‘pop’ over $3
Firstly, we like RHC into weakness below $55 longer-term but because of our market view, we are likely to accumulate in a stepped manner – i.e. this does take into account our anticipated correction – a yes.
Secondly, NAN is a short-term view that’s currently working excellently as it drives higher, this call has one eye on EOFY and does not take into account a future market correction - a no.
Ramsay Healthcare (RHC) Chart
Nanosonics (NAN) Chart
Question 5
“Hi Guys, as a long-term Market Matters subscriber I would like to ask my first question for the Monday email. What view does Market Matters have on MGM Wireless Limited (MWR)? The company has no debt, $3m in the bank, is involved in a market that is set to grow, with a superior product. Does Market Matters like this company as a small cap investment?” - Matt F.
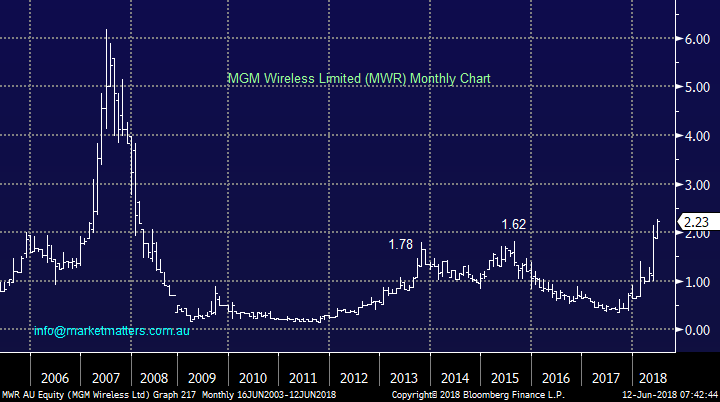
Morning Matt, for those who are not familiar MWR provides a system called “messageyou” which is designed primarily for School Attendance Management. They claim to be Australia's pioneer, leader and most trusted provider of student attendance management, school SMS, mobile messaging and other innovative software applications to schools. Those of you with younger school aged kids will appreciate the roll technology is playing in areas from attendance to library books and even in making a lunch order - this is clearly a growth area. The South Australian based company has already rallied significantly this year although its market cap is still only $26m. The guy behind the technology and the company Mark Fortunatow has launched a number of tech businesses in the past so has a track record in this space, plus he’s the largest shareholder in the company with a 14.56% stake. His latest buy was on the 29th May but only for 5902 shares.
There are no institutions on the register from what we can see, which is not uncommon given the market cap. In terms of cash which is important, they raised a bit over $1m in May at $1.00 per share adding to the $1.4m in the bank as at 31st Dec 17. On initial look, they are not ‘burning cash’ which is clearly a positive.
Not one for us given liquidity but we can certainly see the attraction.
- It’s a volatile stock with an ideal buy level currently around $1.80 with stops below $1.60, but these levels will evolve and probably be different by Friday!
MGM Wireless Limited (MWR) Chart
Question 6
“Hi Guys, I've never sent in a question to MM before so unsure if I can simply email to this address? Do MM have any interest in a buy of XRO at current levels? Another newsletter currently evaluates the stock as being overvalued however I'm not entirely certain how much to trust their opinion in this case.
My business has been a long-time user of MYOB products (20+ years) and I have to say from a user perspective MYOB has gone downhill enormously particularly over more recent years with their path to cloud. On many occasions I've considered throwing our extensive MYOB experience away and going with XERO instead but so far have found just enough reason to hang in there and hope MYOB get their shit together.
Based on our experience with customers and suppliers in the IT sector XERO adoption seems rampant and I can't see any reason why this would change given the current state of MYOB's product offering. Curious about MM's opinion.” – Regards Darren K.
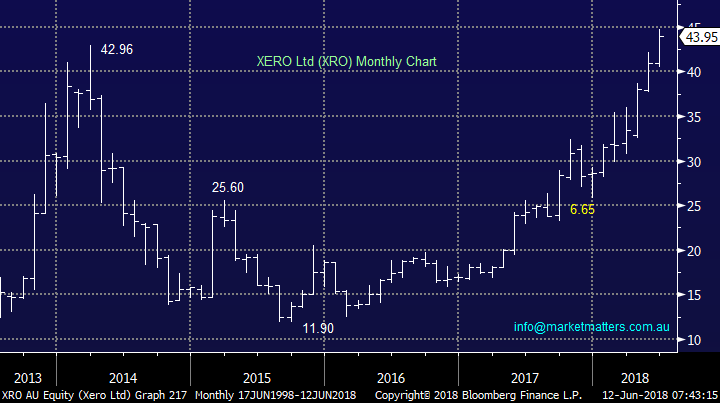
Hi Daren, you’re certainly right in your observations – we also deal with a number of accountants who sing from the mountain tops about Xero. I use it and find it exceptional. The stock price has kicked over recent months with an upgrade by UBS, but they still had a target of $42.50 which has now been surpassed.
XRO has successfully transitioned from a loss-making tech company into a self-funding one with a proven business model and scalable growth opportunities. They did have some issues rolling out in the US, and this took longer and cost more than they anticipated, however the issues seem to be sorted now Also, regulatory changes in the United Kingdom in FY 2019 may become an excellent opportunity for Xero.
XRO is clearly in the popular space at present but as such, it’s not cheap but nor should it be! Like much of the tech space, it can be volatile and chasing strength as opposed to buy one of the regular pullbacks can put pressure on investors’ minds. We are neutral here but interested into a pullback:
- We could currently be buyers of XRO below $40 and would initially use stops below $35.
Xero Ltd (XRO) Chart
Question 7
“Hi what are your thoughts on Villa World (VLW) for income I thought the last market update was OK but the price is falling am I missing something? Great work by the way keep it up its greatly appreciated.” – Bruce J.
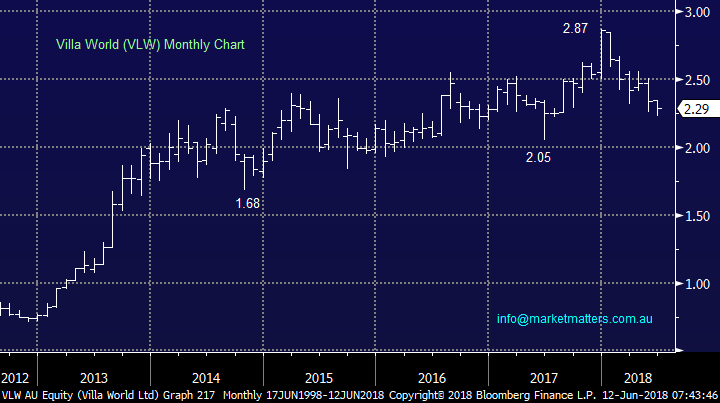
Hi Bruce, this property group is in the wrong sector for us considering we believe interest rates have bottomed. Unfortunately the stocks 8.1% fully franked yield while clearly attractive feels like a dividend trap in the making.
- We are negative VLW targeting at least a 10% fall and potentially 20%.
Villa World (VLW) Chart
Question 8
“Hi MM, how might you consider MMI with their offtake agreement and 4th shipment currently loading.” - Regards and Thanks, Phil.
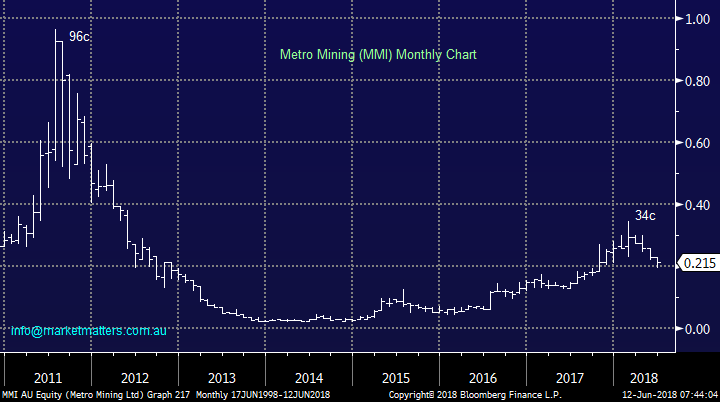
Hi Phil, Metro Mining (MMI) is not a stock we follow closely but the market does not seem keen on the news with a 30% drop over recent months. Another stock we would only consider “playing” technically:
- Not one for us but we could be buyers technically around 20c with stops under 15c – feels a touch casino like.
Metro Mining (MMI) Chart
Question 9
“Hi James, not sure if would remember that Charlie Aitken put a 2017/18 price target on RHC of $54 about three months ago.” – Regards Peter McIver
Hi Peter, you are certainly correct – Charlie came out in the last few months with a negative call on RHC. We like Charlie - you may recall he was on the MM panel at our inaugural MM Live – “Better Manage your wealth” at the Four Seasons Hotel, Sydney + I do regular videos’ with him.
Clearly Charlie’s negative call on Ramsay gave more weight to our already bearish view on the stock. I was negative back in 2017 and felt some heat over the call on TV when I suggested a $60 downside target when it was trading around $67. We then tweaked this view in February 2018 targeting $55 on the downside.
We’re happy with this call given the market collectively have remained very bullish the stock.
Ramsay Healthcare (RHC) Chart
Overnight Market Matters Wrap
· The US closed with little change overnight as investors wait for the outcome of the US-North Korea meet, currently underway.
· Markets mainly ignored trade tensions resulting from the G7 summit over the weekend with Trump criticising the Canadian PM and threatening new tariffs on imported cars.
· On the commodities front, Dr. Copper (an indicator of the health of the global economy) lost some ground, down 1.3%, while Crude Oil resumes its climb back higher.
· The June SPI Futures is indicating the ASX 200 to open 30 points higher towards the 6075 level this morning
Have a great day!
James & the Market Matters Team
Disclosure
Market Matters may hold stocks mentioned in this report. Subscribers can view a full list of holdings on the website by clicking here. Positions are updated each Friday, or after the session when positions are traded.
Disclaimer
All figures contained from sources believed to be accurate. Market Matters does not make any representation of warranty as to the accuracy of the figures and disclaims any liability resulting from any inaccuracy. Prices as at 12/06/2018.
Reports and other documents published on this website and email (‘Reports’) are authored by Market Matters and the reports represent the views of Market Matters. The MarketMatters Report is based on technical analysis of companies, commodities and the market in general. Technical analysis focuses on interpreting charts and other data to determine what the market sentiment about a particular financial product is, or will be. Unlike fundamental analysis, it does not involve a detailed review of the company’s financial position.
The Reports contain general, as opposed to personal, advice. That means they are prepared for multiple distributions without consideration of your investment objectives, financial situation and needs (‘Personal Circumstances’). Accordingly, any advice given is not a recommendation that a particular course of action is suitable for you and the advice is therefore not to be acted on as investment advice. You must assess whether or not any advice is appropriate for your Personal Circumstances before making any investment decisions. You can either make this assessment yourself, or if you require a personal recommendation, you can seek the assistance of a financial advisor. Market Matters or its author(s) accepts no responsibility for any losses or damages resulting from decisions made from or because of information within this publication. Investing and trading in financial products are always risky, so you should do your own research before buying or selling a financial product.
The Reports are published by Market Matters in good faith based on the facts known to it at the time of their preparation and do not purport to contain all relevant information with respect to the financial products to which they relate. Although the Reports are based on information obtained from sources believed to be reliable, Market Matters does not make any representation or warranty that they are accurate, complete or up to date and Market Matters accepts no obligation to correct or update the information or opinions in the Reports.
If you rely on a Report, you do so at your own risk. Any projections are estimates only and may not be realised in the future. Except to the extent that liability under any law cannot be excluded, Market Matters disclaims liability for all loss or damage arising as a result of any opinion, advice, recommendation, representation or information expressly or impliedly published in or in relation to this report notwithstanding any error or omission including negligence.
To unsubscribe. Click Here