Subscribers questions (CYB, JHG, GXL, RFG, BAP, BHP, NAB, WBC, NXT, WFD, PDL, PTM, CBA)
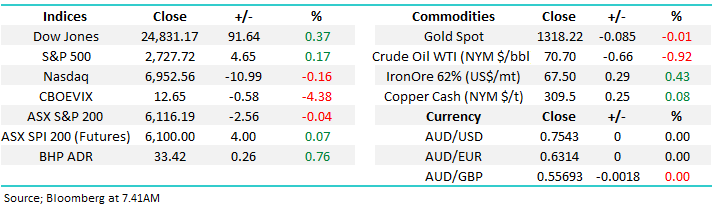
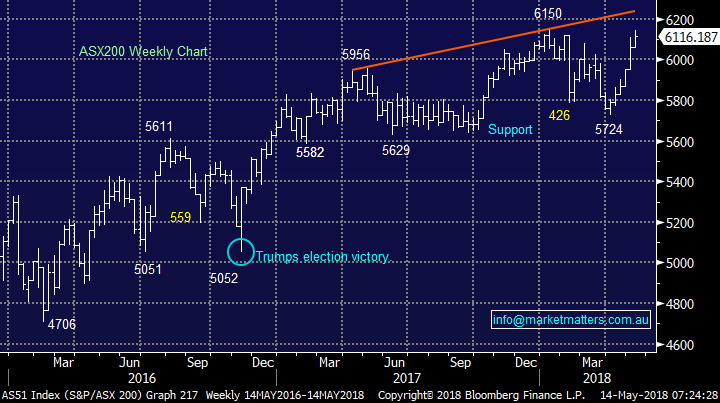
The ASX200 looks set to hover around the psychological 6100 area on Monday morning with BHP Billiton (BHP) likely to add support early on but with ANZ, NAB and Westpac all trading ex-dividend over the local market the index may struggle to push much higher after its 6-week uninterrupted 7.3% advance.
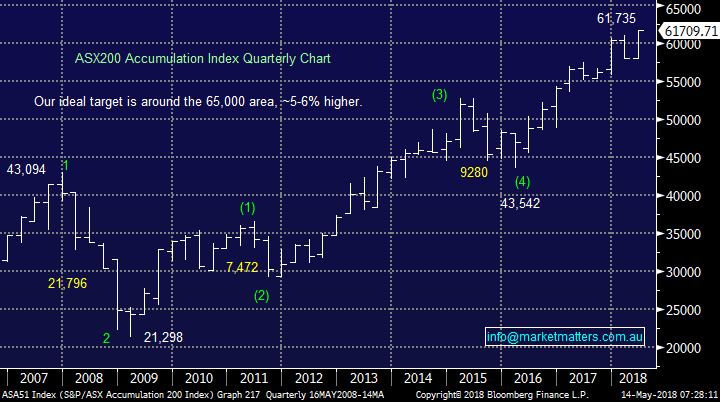
At MM we remain short-term bullish looking for a new decade high in the 6250 area - now only ~2.5% away.
- Following the ASX200’s explosive 7.3% rally we still believe any market surprises are likely to be on the upside – bears beware.
We have again received a record number of questions which is simply great, the market is clearly interesting a few people after its 6-week surge. Today I have covered well over 20 questions when you include the combined answers so please excuse any brevity – please keep the questions coming!
ASX200 Chart
Question 1
“Thoughts please on CBA” – from around 10 subscribers!
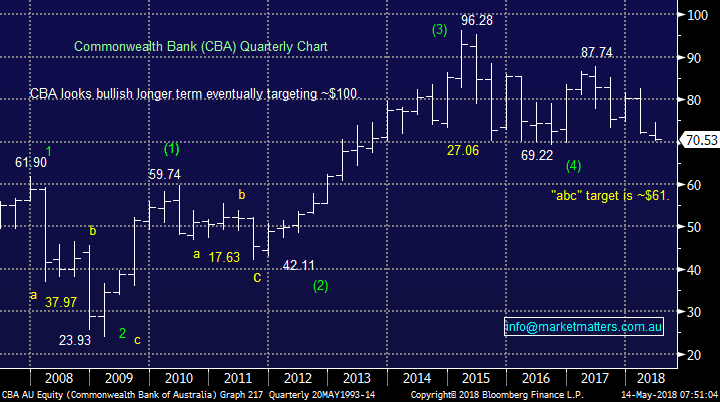
Hi All, we spent some time on CBA in the Weekend Report hence I will crystallise our thoughts in a few bullet points:
- CBA, like most of our banking sector, is suffering at the hands of the Hayne royal commission.
- While we do not expect a quick / fast recovery from the sector we do see value emerging i.e. an est. P/E of 12.9x and yield of 6.1% fully franked is not demanding.
- Since the GFC CBA has experienced two perfect “abc” style corrections, we think there is at least a 50% chance this is number 3, with a target ~$61.
However, we do not believe this is time to panic as CBA’s ~$4.30 / 6.1% fully franked annual dividend should be sustainable, assuming Australia does not slip in a recession. In fact we believe the likes of CBA should outperform during such a correction because following is 28% correction the yield is now very attractive – over the years I have done pretty well by simply buying CBA when its yielding 6% and selling ~4%.
- At MM we are happy to average our CBA position but only in an “accumulation manner” into fresh recent lows, below $69 – exact timing is likely to depend on dividends.
Also, note at some stage fairly soon the current high degree of bank bashing will need to stop because as many economists will say “banking is the single most important aspect of economic and financial health.”
Commonwealth Bank (CBA) Chart
Question 2
“Good morning James + MM Team, just a quick around your medium term holding of CYB with the group to announce its half yearly results on the 15th of May. Interesting there’s been an announcement around increase in legacy PPI costs on the 18th of April (stock fell over 5%) and subsequently there’s been an announcement today around Virgin Money (stock fell over 2%). Bullish brokers for example Bell Potter, have the stock as a buy and PT of $6.10 sighting better NIM and lower administrative expenses etc. Due to the increase in legacy PPI costs, analysts now expect a full year loss which will be revealed next Tuesday. CYB is almost exempt from the Royal Commission. Is market matters still sticking to this bullish view and ultimately targeting a break over $6. If so, what will be the main catalysts for the further upside – appreciation of $GBP against the $AUD or will the loss be narrow and FY 2019 will be much brighter. Or is the anticipation of a less exciting half yearly report already been baked into the current share price of $5.50 (14 times forward earnings). Thanking you in advance” – regards, Tianlei J.
Hi Tianlei,
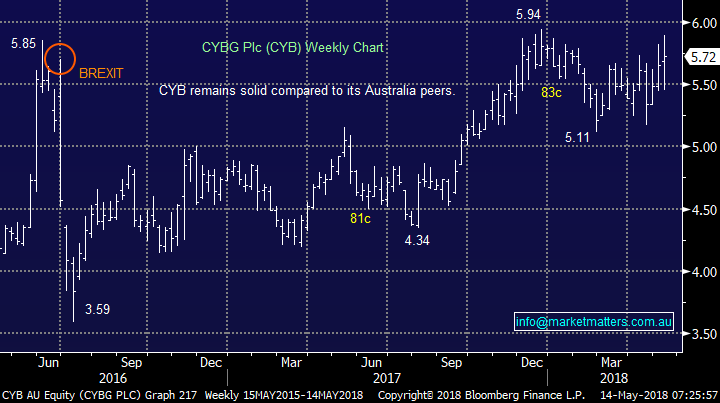
CYB has been a successful spin off from NAB and as you say its importantly insulated from the royal commission as it operates in the UK – although it is dealing with its own regulatory problems there. Firstly, yes we are still targeting above $6 with a number of potential catalysts but its only 5% away and CYB is a relatively volatile stock i.e. 3 days out of the last 6 its traded in a 3% range.
- CYB is cheap because of the markets concerns around BREXIT - a few good days for Theresa May and CYB could easily crack $6.
- The stock is trading on an undemanding 12.6x valuation so it could easily rise with the overall market if the ASX200 pops up to the 6250 area.
Obviously any forthcoming results will have a large influence on the share price but we believe the market will look ahead and eventually push the stock above the $6 area.
- MM still plan to take profit on our holding above $6 as we follow our plan to increase cash levels.
CYBG Plc (CYB) Chart
Question 3
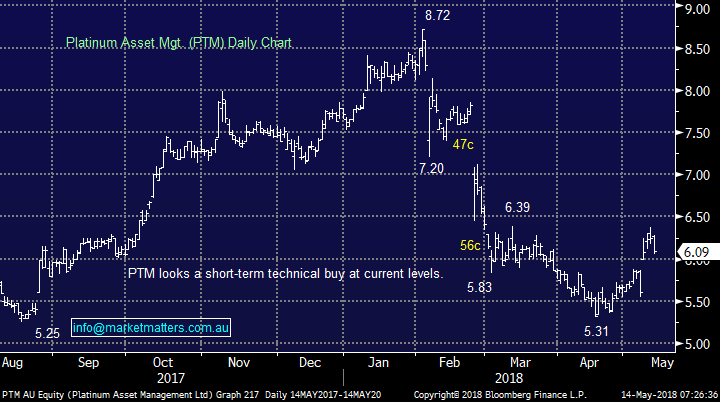
“Hi, I bought PTM at the end of March. Currently sitting on 7% profit. With PDL (formerly BTT) reporting tomorrow and likely to be sold down in my opinion (if results are anything but stellar) interested for your view on holding PTM or taking the profit.” – David H. (question on 9th May).
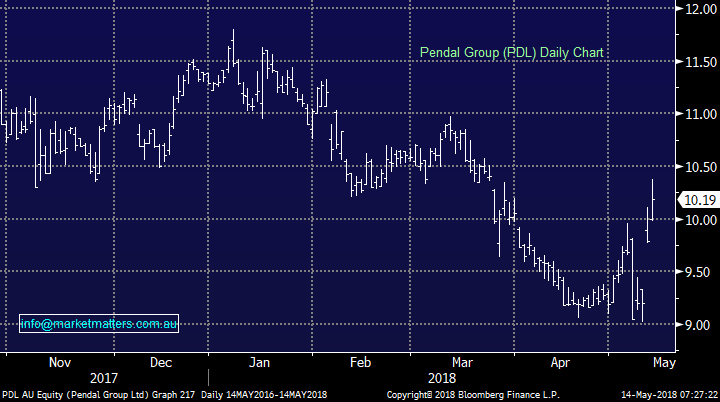
Hi David, I’m sure you’re pleased to get this one wrong! PDL rallied strongly after reporting along with other members of the sector which had a great week e.g. Janus Henderson (JHG) +8.9%, Pendal Group (PDL) +5.3% and Challenger (CGF) +3%. The sector’s become a volatile beast and we think PTM is in the “trading” category for now.
- We like PTM around $6 targeting a rally towards $6.50, another 6-7% higher.
Platinum Asset Management (PTM) Chart
Pendal Group (PDL) Chart
Question 4
“Hi there, I have recently joined MM, and have received the usual welcome pack. It mentioned if you have any questions please ask, so here is one: I am interested to invest (say $20k) in the stock market. As I would like the best possible diversification, I would like to essentially track the Aust, or even better the US or global stock market. So essentially invest in the index.
Is this possible to do? How is the best way to do that? Would that be a publicly traded asset, i.e. low fees and liquid? Downsides?” – Regards Nathan R.
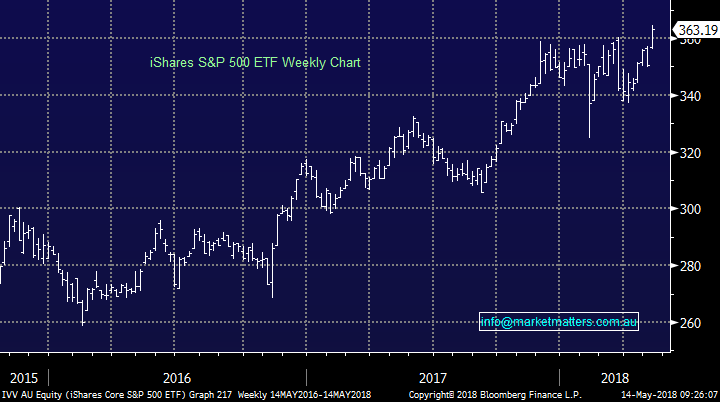
Welcome aboard Nathan – great to have you on the service. There are a number of ETF providers that offer good value that simply track an underlying index. The 3 listed products on the ASX we have used in the past are the IVV, which tracks the S&P 500 (U.S market) and is from iShares, the STW which tracks the ASX 200 (Australia) from State Street Global Advisers and the IEU from iShares which tracks the largest 350 companies in Europe. Betashares, a local provider of ETFs has just launched the BetaShares Australia 200 ETF (ASX: A200),which they are claiming as the world’s lowest cost Australian shares ETF (0.07% pa). The fund is now trading on the ASX with the code A200.
iShares S&P 500 ETF (IVV) Chart
ASX200 Accumulation Index Chart
Question 5
“Hi James, In Question 5 last week you wrote about risk occurring when stocks trade over 130% above GDP. I would like to understand this better. Could you please elaborate by giving an example?” - With thanks, Paul H.
Morning Paul, as we mentioned in a previous report:
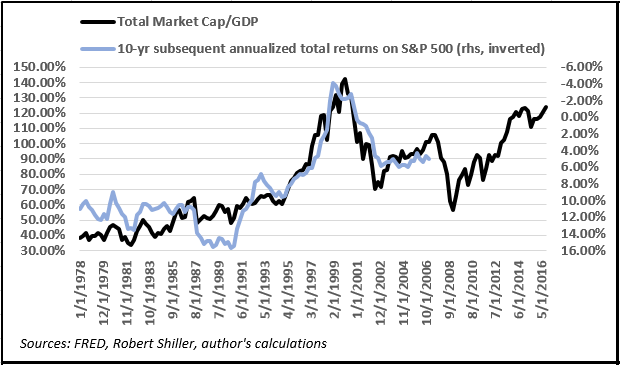
- Warren Buffett, the oracle of Omaha, has said previously it’s time to sell stocks when market cap of stocks trades above 130% of GDP, as it did just before the GFC – we are now way above that level.
Historically he has believed in the past that the US stock markets value can be measured as the ratio of the stock market capitalisation to the overall GDP of the country i.e. if its below 50% the markets cheap and above 130% the markets are too expensive – we are there now.
The below chart illustrates the correlation extremely well i.e. the future returns from shares has been poor when the ratio was above 100%.....today its close to 150%. While its always easy to say it’s different this time because of x & y reasons we believe it’s an indicator showing why investors should be cautious at the very least.
Question 6
“Hi Guys, can you tell me if there is an ETF which I can short bonds in the US or Aust markets which I can buy on the ASX.” – thanks, Daniel C
Hi Daniel – From what we can see in terms of products listed on the ASX, there isn’t anything that will provide short bond exposure listed in Australia, however there are products that give exposure to this theme which are listed in the US. The iShares Short Treasury Bond ETF is listed on the NASDAQ under code SHV which could be worth some further investigation, however holding this would require an international broking account.
Question 7
“Hello Market Matters, does Market Matters have a view of the proposed takeover by Uniball Rodamco? I am not asking for personal advice but would be interested in MM's view of whether to hold and receive the proceeds of cash and CDI's or whether selling prior to the transaction is a preferred strategy?” - Many thanks once again Kim L.
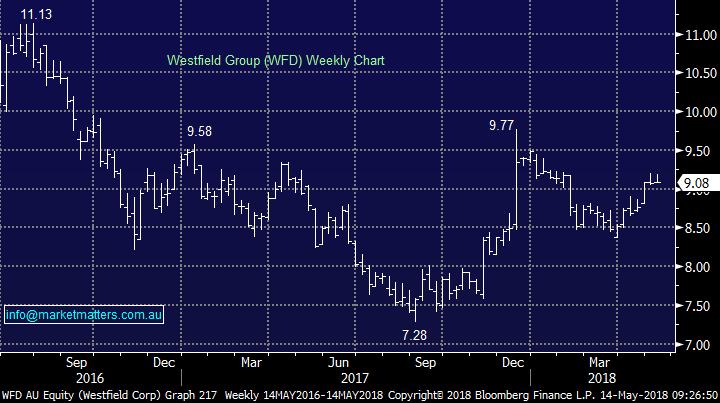
Hi Kim, we don’t own WFD however looking from the outside a few considerations we would make if we held it.
1. Total value being offered; Here’s a quick work through which highlights there is only marginal upside (+1.82%) given the prevailing price of WFD and Unibail + relevant exchange rates.
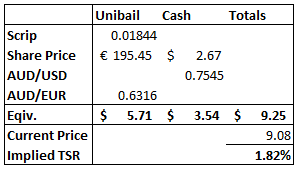
2. Furthermore, WFD is a stock held by many institutions – and funds that operate under specific mandates. Holding CDI’s of a company listed overseas may not be permitted, so even if these are held initially there is generally a time limit applied to liquidate them which could put pressure on the CDIs listed here.
3. Given the slim upside based on current metrics and recent rally in the WFD share price, if we held the stock, we would sell it on market and look for other opportunities.
Westfield (WFD) Chart
Question 8
"Hi James & the team, this indeed is a brave call:
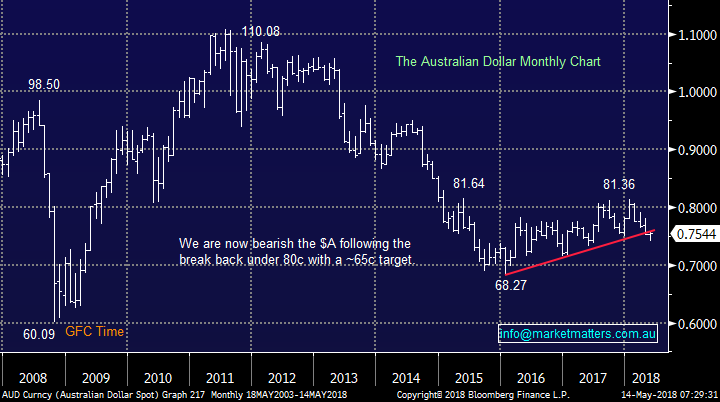
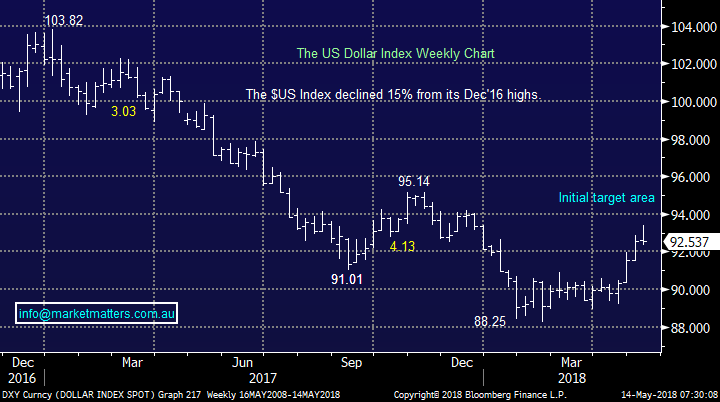
· We remain bearish the $A looking for another 15% downside.
That means 62c against the USD – this, if in the unlikely event occurs anytime soon, will do a world of good for Australia. After all, the London Economist’s McDonald Index had been calling AUD=0.64USD for many years!” - Best regards Jay
Hi Jay, unlike the London Economist we’ve been both bullish and bearish the $A over recent years actually calling it higher in Q1 of 2018 before expecting it to turn lower, in line with our $US view in the MM 2018 Outlook – so far so good. If we stand back and look at the $A since its 110c top its largest annual move was ~18c with the average closer to ~12c. Hence from a statistical perspective we don’t expect our target to be achieved until probably 2019.
We agree with you that a $A below 65c should be supportive of the local economy dramatically assisting our exporters.
Australian Dollar ($A) Chart
$US Index Chart
Question 9
“Trump’s crack down on Israel…”?? What is that about.” – regards John R.
Hi John, I’m sure you don’t expect us to have an insight on Donald Trump’s thoughts and logic but with the US mid-term elections looming in November I do expect more “Trump style” actions / rhetoric as he strives to look good in the polls.
Question 10
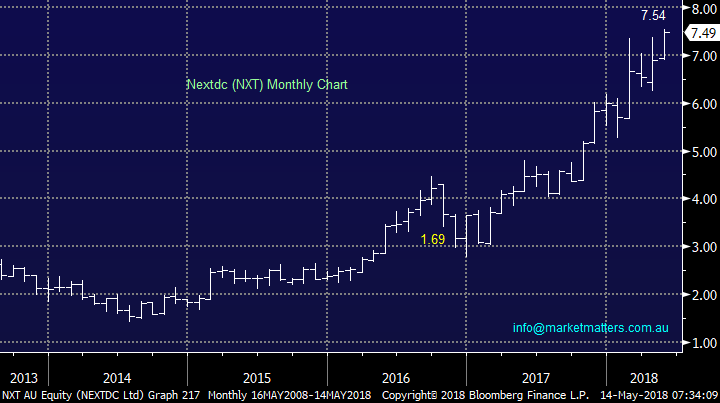
“Just wondering if you can ask someone James or someone at Market Matters about their thoughts on the company NEXTDC (NXT)? Also, the company Raiz (previously Acorns) is going to IPO soon. Just wanted to know if it's worth investing in?” - Kind Regards, Nafeez H.
Hi Nafeez, while NXT has rallied strongly and is trading on a high valuation we like the future for the cloud computing market. However, the stock like many “high performers” can be volatile as investors sometimes aggressively lock in profits.
· We like NXT and would currently be buyers ~$6.50.
Sorry at this stage we have no opinion on Raiz.
NEXTDC (NXT) Chart
Question 12
- “Is there a trend developing here of selling good companies in strong sectors and investing funds into weak companies in sectors that are struggling. Eg: Sell BHP and WPL as they start to rise and invest in NAB or finance areas that are struggling in the current market.” – thanks Merrelyn S.
- "I followed MM into WPL some time ago but when you sold I opted to stay with the Company. Fortunately, since then WPL has had a fairly strong rise and I am starting to wonder if it is time to take profits. Is there some better value in the resource stacks” - Peter H.
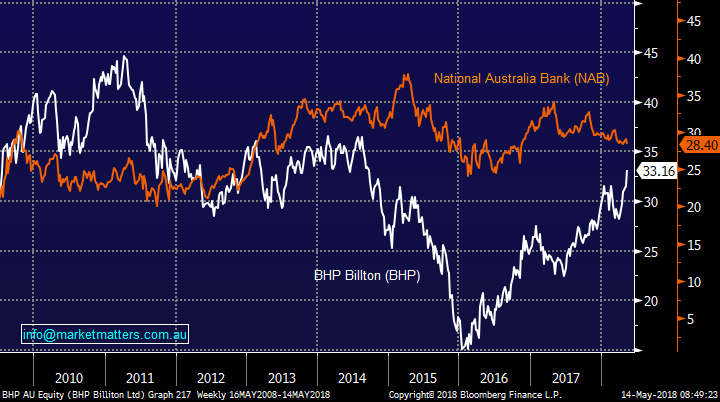
Hi Guys, yes we do try and switch between sectors / stocks when things become stretched but it can be a slow turnaround when trends become entrenched. E.g. after being out of resources for years we started “nibbling” at BHP around $20 but it fell all the way to $14…..$20 looks excellent today.
The timeframe often dictates the relative strength of a company / stock, today BHP looks great while NAB weak but:
· Since 2011 BHP is still down 28% while NAB is up ~28%, plus NAB has paid more dividends.
We believe the current bull market for resources is maturing while our banks are in the eye of the negative royal enquiry storm, remember the below, it feels easy to buy BHP today and not banks, agreed?
· Warren Buffett once said that as an investor it is wise to be “Fearful when others are greedy and greedy when others are fearful.”
BHP Billiton (BHP) v National Australia Bank (NAB) Chart
Question 13
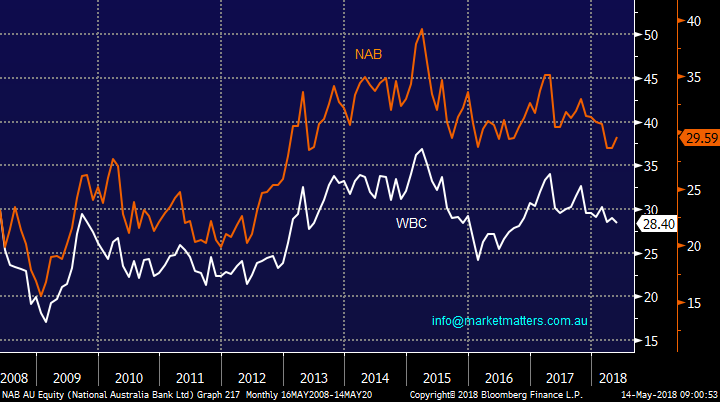
“With regard to NAB, its current and forecast growth is in negative territory and its stock price has been falling while (most) others have been on the rise. Given the royal commission, I understand the headwinds for all the banks, however, would it not be a better choice to exit NAB and if staying with bank stocks, and move into WBC or ANZ (for example) that have decent growth figures??” – Thanks Wayne S.
Hi Wayne, an excellent question however this is very dependent on the time frames of investment. Shorter term, divergence can occur which creates opportunity, however looking longer term the correlation below between NAB and WBC is clearly very strong. The banks generally push in one direction and can usually correct any short-term misgivings
National Australia Bank (NAB) v Westpac (WBC) Chart
Question 14
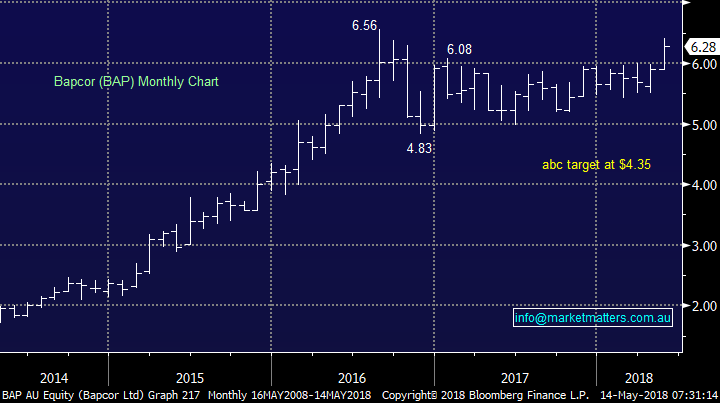
"Hi MM Team, I have 2 questions: 1. Your technical and fundamental view on Bapcor (BAP) 2. In regards to the weakening $A against the $US, your thoughts including versus the Euro, thanks very much” – Thanks Tim C.
Hi Tim,
· Technically BAP looks bullish targeting ~6.75 – strong earnings growth, reasonable PE when considering the trajectory of those earnings.
We’ve touched on our thoughts on the $A earlier, with regard to the EURAUD we are bullish targeting ~8% upside for the European currency.
Bapcor (BAP) Chart
Question 15
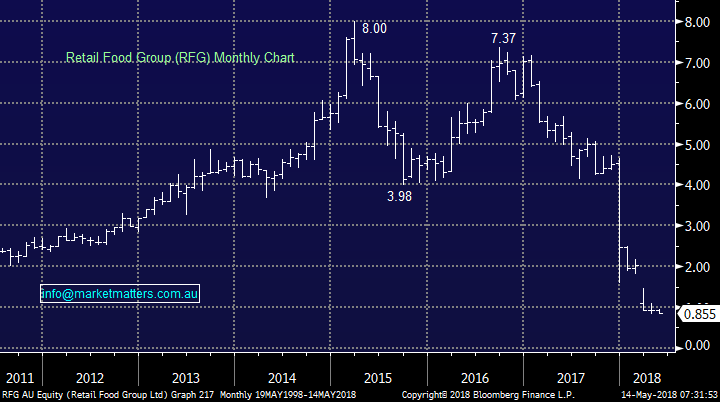
“What would MM do if it still held RFG like me. I sat on my hands when it fell off the cliff and have watched it fall to current level in the vague hope some miracle might rescue it. Would you cut your losses, hang in hoping for a recovery or some other sign of future life or walk away wiser? Guess I can use the loss to offset other CG but it still hurts.” – Thanks Stuart H.
Hi Stuart, we had a similar experience with Vocus (VOC) a few years ago……..when we too took our largest ever loss at MM, but still we’re better off for doing it.
With regard to RFG it could easily bounce strongly but to us it’s in the too hard basket.
Retail Food Group (RFG) Chart
Question 16
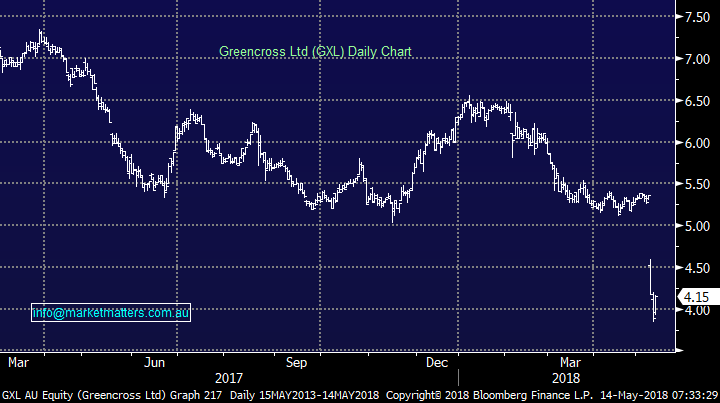
“Interested in MM’s assessment of GXL as “no interest” (May 9) as it is 35% down on its YTD high; has a PE of 11%; and at $4.15 (May 9) is trading at a 30% discount to MS’ FV of $6.00 with MS 5-star rating.” – thanks Chris G.
Hi Chris, we believe the aggressive fall in the share price (GXL) is justified for the FY18 result, It’s very hard to gauge what Greencross’ longer-term growth prospects are after this update hence as we say “we have no interest”.
Time will tell if this logic makes sense but we have no concerns going against other brokers with our views, as people say “that’s what makes a market”.
Greencross (GXL) Chart
Question 17
“Hi James, good commentary which I enjoy. A number of Livewire contributors and others are suggesting a strategic medium/long term position in uranium could prove profitable given restricted supply from Russia and increased demand as Japan commences to ramp up its usage. With ERA winding down, PDL on a care & maintenance basis and TOE with approvals but no construction does MM have any suggestions or is it too early to move in your view?” - Thanks Peter W.
Hi Peter, uranium is a bit tough for us at present but definitely worth keeping an eye on.
Question 18
“When you do decide that 20% downturn is about to happen are there some sectors that you are more likely to keep or alternatively some sectors that will sell early.” - Nick A.
Hi Nick, a great question, as we said earlier we would not be surprised to see our embattled banks out-perform along with Telstra (TLS), historically high valuation stocks are likely to pullback strongly and if it’s an interest rate driven decline - healthcare stocks would be a standout for selling.
Question 19
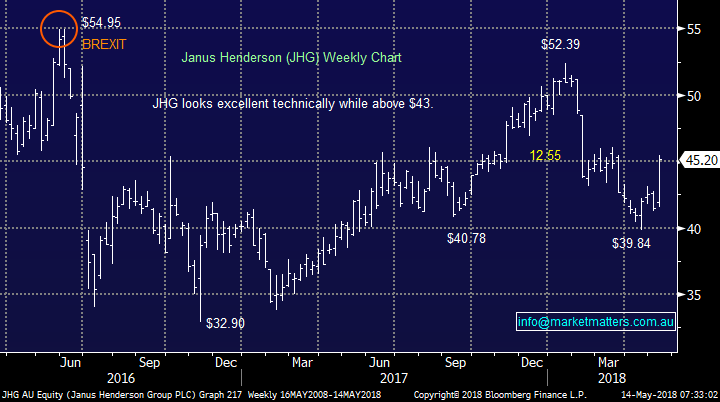
“Hi M&M, can you please give me an update on where we are with JHG I notice it has started increasing in value. Cheers love your work.” – Tony.
Hi Tony, we are finally enjoying some positive price action in JHG, ideally we will exit our position in the high $40 region.
Janus Henderson (JHG) Chart
Overnight Market Matters Wrap
· The US markets closed with little change, but broadly biased to the upside last Friday as investors weigh up on trade tensions easing along with a less aggressive interest rate rise play.
· The defensive names outperformed the broader US market, led by the Telco and Health Care sector while IT and Real Estate fared worse.
· Crude Oil eased, however still above the US$70/bbl. Level and we still expect BHP to outperform the broader market after ending its US session up an equivalent of 0.72% from Australia’s previous close.
· The June SPI Futures is indicating the ASX 200 to open marginally lower, testing the 6115 level this morning.
Have a great day!
James & the Market Matters Team
Disclosure
Market Matters may hold stocks mentioned in this report. Subscribers can view a full list of holdings on the website by clicking here. Positions are updated each Friday, or after the session when positions are traded.
Disclaimer
All figures contained from sources believed to be accurate. Market Matters does not make any representation of warranty as to the accuracy of the figures and disclaims any liability resulting from any inaccuracy. Prices as at 14/05/2018. 7.41AM
Reports and other documents published on this website and email (‘Reports’) are authored by Market Matters and the reports represent the views of Market Matters. The MarketMatters Report is based on technical analysis of companies, commodities and the market in general. Technical analysis focuses on interpreting charts and other data to determine what the market sentiment about a particular financial product is, or will be. Unlike fundamental analysis, it does not involve a detailed review of the company’s financial position.
The Reports contain general, as opposed to personal, advice. That means they are prepared for multiple distributions without consideration of your investment objectives, financial situation and needs (‘Personal Circumstances’). Accordingly, any advice given is not a recommendation that a particular course of action is suitable for you and the advice is therefore not to be acted on as investment advice. You must assess whether or not any advice is appropriate for your Personal Circumstances before making any investment decisions. You can either make this assessment yourself, or if you require a personal recommendation, you can seek the assistance of a financial advisor. Market Matters or its author(s) accepts no responsibility for any losses or damages resulting from decisions made from or because of information within this publication. Investing and trading in financial products are always risky, so you should do your own research before buying or selling a financial product.
The Reports are published by Market Matters in good faith based on the facts known to it at the time of their preparation and do not purport to contain all relevant information with respect to the financial products to which they relate. Although the Reports are based on information obtained from sources believed to be reliable, Market Matters does not make any representation or warranty that they are accurate, complete or up to date and Market Matters accepts no obligation to correct or update the information or opinions in the Reports.
If you rely on a Report, you do so at your own risk. Any projections are estimates only and may not be realised in the future. Except to the extent that liability under any law cannot be excluded, Market Matters disclaims liability for all loss or damage arising as a result of any opinion, advice, recommendation, representation or information expressly or impliedly published in or in relation to this report notwithstanding any error or omission including negligence.
To unsubscribe. Click Here


