Subscribers questions (CSL, FMG, DHG, NEC, PLS, WHC, NHC, VOC)
The potential influential market news was interesting on the weekend, especially on the domestic level with 3 things catching my eye:
1 - For the first time since I can remember the AFR (Australian Financial Review) is not calling Mays Federal Election a forgone conclusion quoting the Ipsos poll at 51-49 in favour of Labor but I caution the bulls who would simply love a Liberal victory that the bookmakers still have Labor at 1.20 compared to the Coalition at 3.8, perhaps the AFR are trying to sell papers (subs these days) but 3-months can be a long time in politics.
2 – Housing is arguably the key dynamic to the Australian economy and it may be showing glimmers of hope to many with first home buyers replacing investors at auctions and buyers looking for value in the Sydney’s western suburbs, perhaps a bottom is closer than many believe.
3 – Also President Trump is apparently getting closer to a 2020 election win, sorry but I have no idea how markets will take this one!
Our view is that Sydney / Melbourne’s property markets will bottom / level off way before the consumer starts enthusiastically buying the likes of a new couch and TV again i.e. I reckon the average Aussie understands depreciation far more than they are often given credit for! Hence we still only have interest in retail stocks from a general perspective further down the track.
MM remains in “ buy mode” with our elevated cash levels but we are currently not planning to chase strength.
Thanks again for the questions.
ASX200 Chart
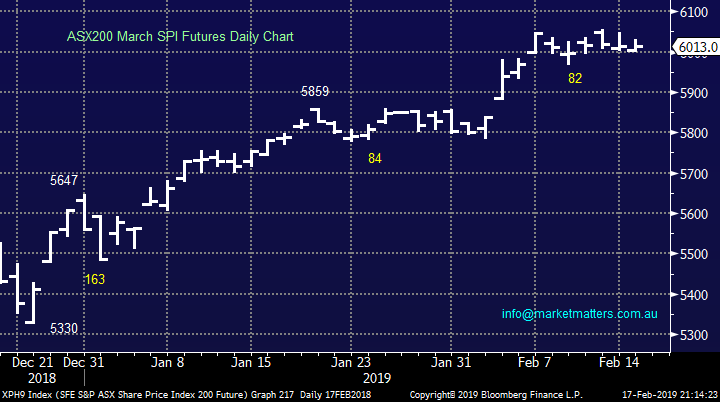
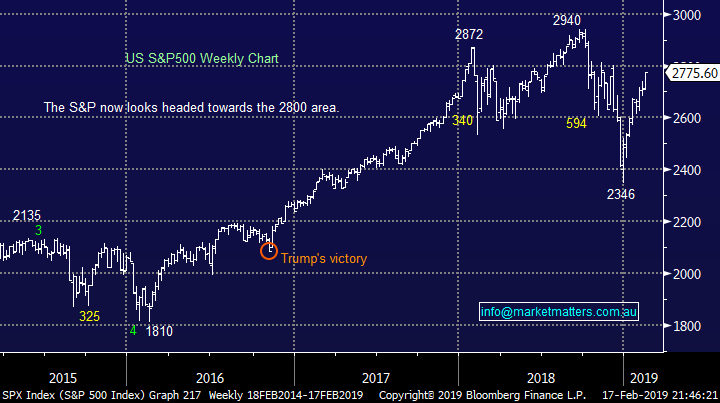
No major change, we believed US stocks will trade higher in the months ahead but a consolidation / pullback feels close at hand.
1 – Medium-term we see the current bounce reaching the 2850 area, now only ~3% higher.
2 – Short-term we anticipate a correction to the strong rally since late December, ideally ~5% lower but its alluded us to-date.
US S&P500 Index Chart
Question 1
“Hi James, thanks for your weekend report. Any views on CSL and if you view the current drop as a buying opportunity or is it anticipated that there is likely to be a greater fall.” – Mike D.
Hi Mike,
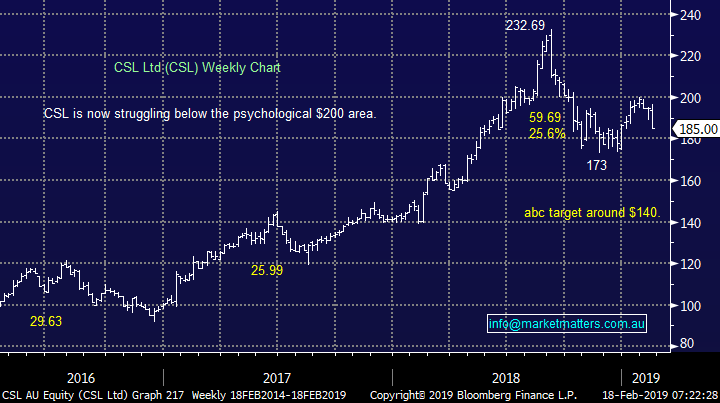
Blood plasma business CSL is undoubtedly a great company the only question is what’s a fair / good entry price to buy the shares. As you say the stock is currently well below its 2018 high, over 20% in fact.
Up until December 2015, CSL consistently traded on around 20 times earnings. From then on, we’ve seen exceptional earnings growth and delivery from the company and the market has happily paid up for it reaching a crescendo in early September 2018 where someone paid 37.4x for the stock. The average over the past 5 years is 25.7x and today the stock is trading on a 1 year forward P/E of 31.08 dropping to 27.65x in 2020 and 24.78x in 2021 if they meet consensus earnings numbers.
When the business was growing at 30%, as it did last year, paying nearly 40x probably made sense as long as the 30% growth would continue, which it hasn’t. This is a maturing business – it’s a phenomenal one of the highest quality however I think you’ll be able to buy the stock cheaper in the months ahead.
CSL seems to be entering a transition period as it cycles off the top of peak optimism. Believe me, this is a business that everyone loves, they feel comfortable in it and its clearly delivered in spades. Markets / stocks can often move in the direction of most pain and in the case of CSL, this is down. While a very simplistic measure, on a P/E of 25.7x which is the its 5 year average, CSL is worth $165.11, rising to $184.92 next year.
In short, a fall of another +10% would however have us running our numbers again however at this stage we are comfortable to have taken profit on our CSL at higher levels and are not considering re-entering for now.
CSL Ltd (ASX: CSL) Chart
Question 2
“Hi team, a question regarding Iron Ore. Iron Ore prices have surged recently, due mostly to Vale dam issue. 62%FE is up 34% since November 30 last year but BHP and RIO share price has lagged despite their break-even cost being much lower than most. A couple of the juniors (MGX and GRR) are up (33% and 46% respectively) but that difference could be attributed to a 65%FE product or a pelletised haematite and magnetite offering. The standout however is FMG with a 57% rise in its share price despite a 58%FE and 60%FE blended product offering. Is this solely due to demand for a lower price product and if so how long will it last given China’s push for lower emission “cleaner” steel plants? Prices are predicted to rise a further 16% to US$100 per tonne, do you see this moving everybody upwards or are there some who’ll potentially do better than others? I own BHP, GRR and MGX” – Regards David H.
Hi David,
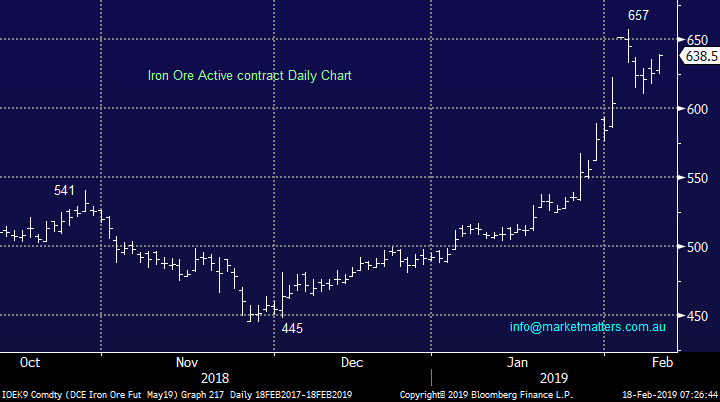
The iron price has undoubtedly been on a vertical ascent closing last week ~40% above the lows of late 2018. The smaller / junior iron companies have earnings that are far more leveraged to the iron price as opposed to the international goliaths BHP and RIO who have interests in the likes of copper and coal hence diluting the impact of the iron price on their earnings from a percentage perspective and this has been reflected in share price gains.
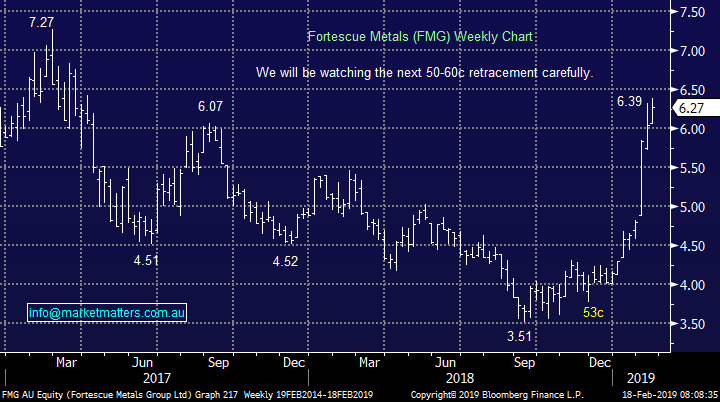
Fortescue (FMG) is a slightly different story because the market was penalising the shares because of their lower grade “dirtier” ore. The gap between high grade and lower grade ore had been stretched too far to the downside and now its snapping back. I listened to the BHP and RIO CEO’s who called this a structural change while FMG said it was cyclical. All were talking up their own book however FMG seems to have been proven correct to date and have played catch up.
Generally, when Iron Ore prices are rallying, FMG will do better than the majors, and when its falling it will do worse. It’s an edgier play!
Iron Ore Chart
Fortescue Metals (ASX: FMG) Chart
Question 3
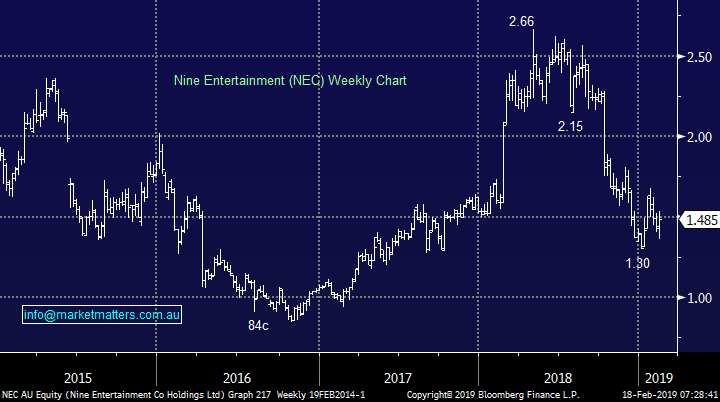
“Good morning James & MM Team, My question is around Nine Entertainment (NEC) having merged with Fairfax Media Limited back in Christmas 2018 will report it's first combined earnings on Thursday 21st of February. Since the merger was completed, (NEC) shares are down around 30% and this drop was largely due to the uncertainty of Domain's earnings as result of slowing listing appetite especially around both Sydney and Melbourne. Now that we received confirmation from Domain last Friday that both markets are cooling off but the 20% plus surge was more warranted given the shares were priced for negative earnings. (NEC) owns half of Domain, will this confirmation of earnings have a positive impact on (NEC) shares and have the market shift focus towards the combined entities and delivering synergies and potential sale of former Fairfax Media Limited non - performing assets. Also, can you share your quick view on (JHG) as it is poised to open above $33 on Monday which is a 20% plus surge from the Boxing Day lows. Do you share the same view it will re-test $35 as a minimum.” Thanks - regards, Tianlei.
Hi Tianlei,
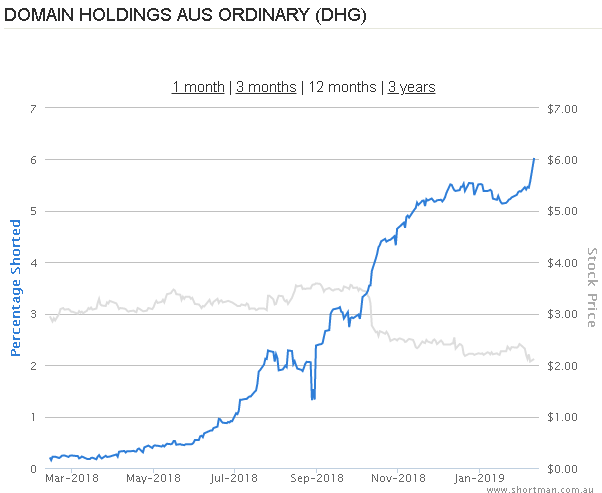
The Domain Group (ASX;DHG) result on Friday was better than the market had feared however I’m not yet convinced it simply wasn’t short covering. This is a company that doesn’t enjoy the dominance that its main competitor REA Group does, and therefore doesn’t have the pricing power. Our concern at this stage of the property cycle is the lack of listing volumes. Prices have come down, and time on market has increased which is positive for DHG, as is the potential for increased marketing spend however I think that’s a questionable one, however we’re not yet seeing forced selling given employment remains strong. In short, I think DHG has some obvious headwinds from here relative to REA.
Short interest in DHG
Domain Group (ASX:DHG) Chart
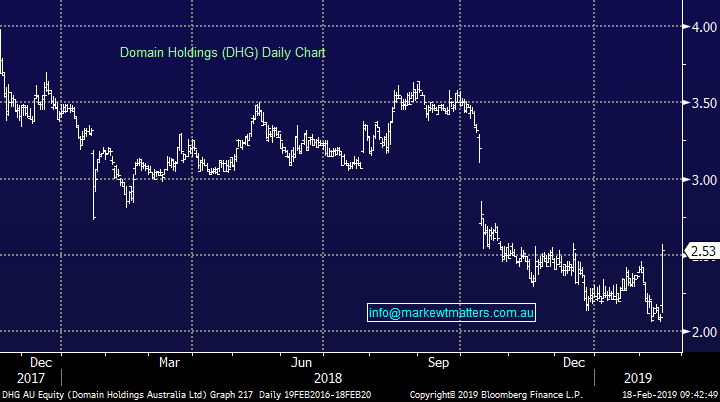
NEC is clearly cheap and their 50+% holding in DHG obviously helped them on Friday. If we were ‘playing this theme’ we would do it through NEC as the market now searches for value as things become more expensive.
Nine Entertainment (ASX: NEC) Chart
Question 4
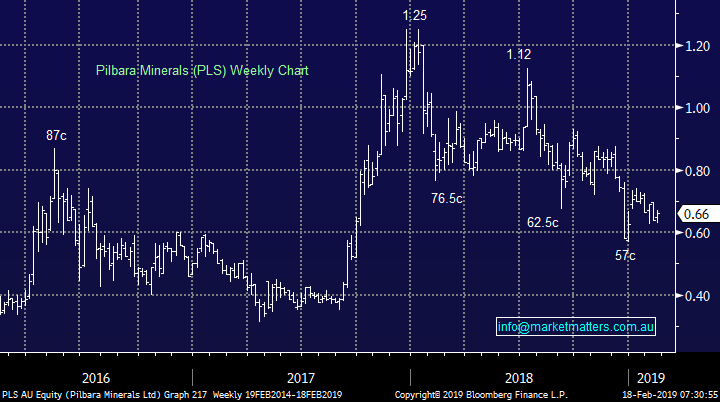
“Thanks for all the great insight and info at MM . my Question here relates to the "Trade of the week " section in Sunday reports. Let’s take PLS as an example 2 weeks back. The lithium sector has been a tough space for more than a year now, however this ones for Hans! PLS generated an excellent risk / reward buy signal on the close last week. We are bullish PLS initially targeting 90c with stops below 62c – excellent 3-1 risk / reward. MM likes PLS here with stops below 62c. Pilbara Minerals (ASX: PLS) Chart As their may be many who take on these trades.... What is the time frame here? Is the Technical picture still in play or has that past? Also referring to any of the "trade of the week" stock as general guidance.” - Thanks Simon.
Hi Simon,
The ‘Trade of the Week’ is generally a technically driven trade idea simply highlighting a short term opportunity in the market. At times we’ve added it to the Growth Portfolio if we had available cash and the trade made sense from a portfolio perspective. We’d be interested to hear thoughts from subscribers about building out our coverage of shorter term trade ideas and the tracking / updating of these ideas more regularly. These would not necessarily be in a portfolio, but rather an ideas area on the site where ideas are provided and levels updated. Please email us any thoughts.
In the case of PLS ….we use a weekly chart below and the trade is still in play. Stops remain below 62cps with last weeks low of 63cpos holding. We remain bullish PLS targeting 90c
Pilbara Minerals (ASX: PLS) Chart
Question 5
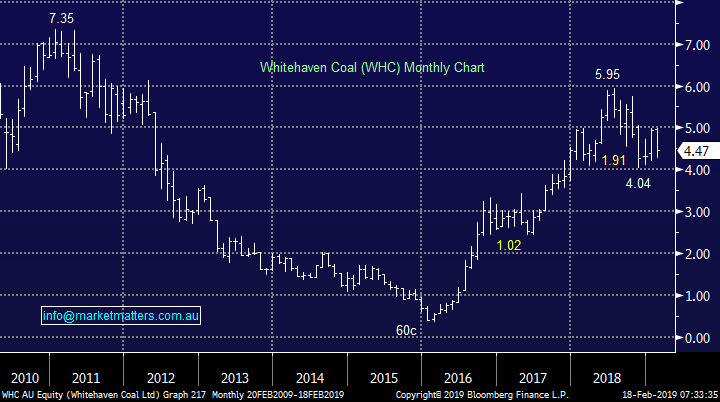
“Hi James, is WHC good to buy, after 10% drop?” – Regards Sanjay.
Hi Sanjay,
They had a poor operational start to FY19 and the thermal coal price has been soft of late. If those two themes continue, then the share price will continue tracking lower. The capital management initiatives were a positive with a big unfranked dividend of 20 cents per share to shareholders, comprised of an interim dividend of 15 cents and a special dividend of 5 cents – putting the stock on an attractive ~4.5% yield for the half.
While it does look interesting here, its hard to get excited here when they miss expectations so sharply (mainly due to operational issues) and the price of the commodity they are mining is softening.
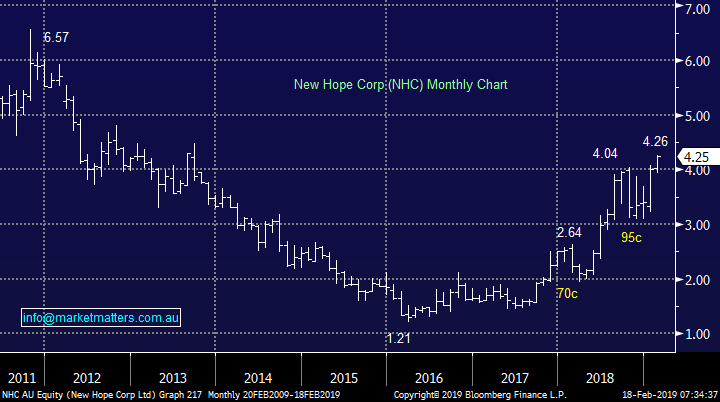
We think catching this falling knife is too risky for now. We prefer NHC is the sector
Whitehaven Coal (ASX: WHC) Chart
New Hope Corp (ASX: NHC) Chart
Question 6
“Good morning, Good Morning If Labor gets in and removes the refundability of franking credits then what with that and other similar hybrids for SMSFs in pension mode?” – Regards Frank F.
Hi Frank,
Since Labor announced plans to toy with cash refunds on franking credits there has been an impact on the hybrid market – more so when the news was announced but still spreads are trading wider by about 60bp, or in other words, when buying a hybrid now you’re getting an extra 0.60%pa for the trouble. Right now we’re seeing a lot more institutional money go into hybrids – that’s certainly the experience we’re having through the Shaw income desk – while UniSuper for instance weighed in $200m into the most recent NAB deal unfazed by the potential change in Govt. Also, the fact banks have raised over $5bn since the proposed change was announced also suggests the market isn’t too worried about it. The vast majority of investors pay tax – about 90% from what I understand – and therefore they’re unlikely to be impacted by the change in policy if it was to actually happen. The sad reality is that this policy initiative is flawed – it targets the wrong group of people, however I don’t think the change will have a meaningful impact on the market from here.
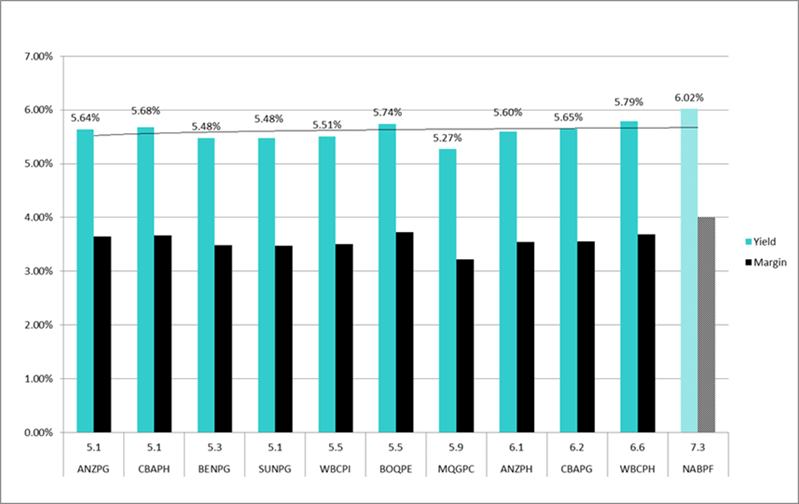
Here’s a quick look at longer dated financial hybrids that would be most impacted by the change – however at a margin of 4% as the NABs were, I doubt there is much more downside (upside in terms of yield) on that number.
Question 7
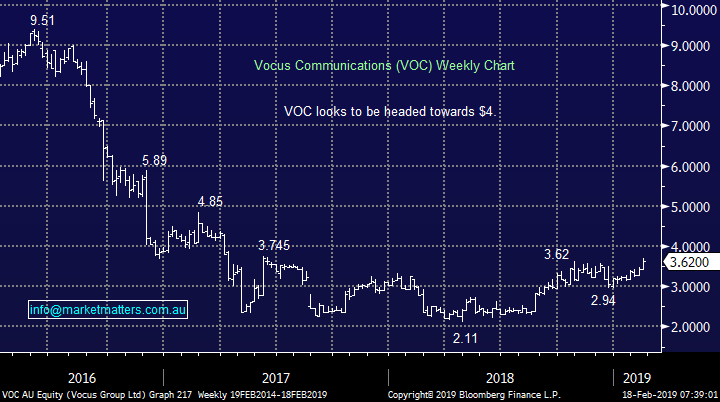
“Hi, a couple of weeks ago you suggested VOC could run to $4. Now it’s run up to $3.53 which seemed to be a resistance level in the past. What’s going to drive it higher? Shorts covering or anticipation of a good earnings report in two weeks.” – David H.
Hi David,
Potentially, although there are now only ~26m shares short on VOC versus ~76m less than a year ago. Like the other Telco players in Australia, VOC have experienced a tough few years however the rationalisation in the sector is a positive for all involved and that’s prompted shorts to cover. The market remains negative the stock with not a lot of upside built in. We like scenario’s where the market is positioned negatively and there is a catalyst (i.e upcoming earnings report).
Our $4 target remains in play.
Vocus (ASX: VOC) Chart
Overnight Market Matters Wrap
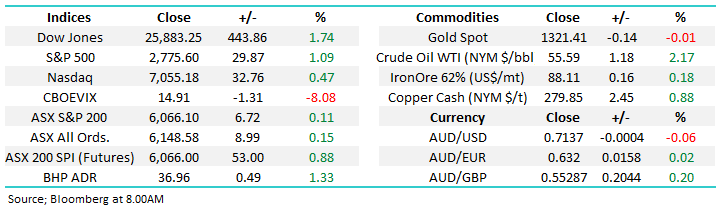
· The local market is set to begin the week on a positive note boosted by solid gains on global equity and commodity markets over the weekend, following positive reports on the progress of US-China trade talks, which are due to move from Beijing to Washington this week.
· Financial and cyclical stocks led the markets higher boosting the 30 stock Dow in particular 450 pts (+1.7%), ahead of the long weekend, with markets closed tonight for the President’s Day holiday.
· It was also a strong night for commodities with oil jumping 2.5%, hitting its highest level of the year so far, with the Brent benchmark above US$66/bbl on reports of deeper OPEC supply cuts. Gold and base metals were also stronger on the news, with gold 0.8% higher, copper +1.5% to over US$2.80/lb, and iron ore 0.2% higher at US$88.16/tonne.
· European markets were likewise, strong across the board on the US-China trade talks progress led by the French and German gains of about 1.8% and 1.9% respectively, while the UK market lagged (+0.6%) as Brexit talks continue to make little progress ahead of the March 29th deadline. The A$ has firmed to around US71.3c.
· The March SPI Futures is indicating the ASX 200 to open around 0.9% higher around the 6115 level.
Have a great day!
James & the Market Matters Team
Disclosure
Market Matters may hold stocks mentioned in this report. Subscribers can view a full list of holdings on the website by clicking here. Positions are updated each Friday, or after the session when positions are traded.
Disclaimer
All figures contained from sources believed to be accurate. Market Matters does not make any representation of warranty as to the accuracy of the figures and disclaims any liability resulting from any inaccuracy. Prices as at 18/02/2019
Reports and other documents published on this website and email (‘Reports’) are authored by Market Matters and the reports represent the views of Market Matters. The MarketMatters Report is based on technical analysis of companies, commodities and the market in general. Technical analysis focuses on interpreting charts and other data to determine what the market sentiment about a particular financial product is, or will be. Unlike fundamental analysis, it does not involve a detailed review of the company’s financial position.
The Reports contain general, as opposed to personal, advice. That means they are prepared for multiple distributions without consideration of your investment objectives, financial situation and needs (‘Personal Circumstances’). Accordingly, any advice given is not a recommendation that a particular course of action is suitable for you and the advice is therefore not to be acted on as investment advice. You must assess whether or not any advice is appropriate for your Personal Circumstances before making any investment decisions. You can either make this assessment yourself, or if you require a personal recommendation, you can seek the assistance of a financial advisor. Market Matters or its author(s) accepts no responsibility for any losses or damages resulting from decisions made from or because of information within this publication. Investing and trading in financial products are always risky, so you should do your own research before buying or selling a financial product.
The Reports are published by Market Matters in good faith based on the facts known to it at the time of their preparation and do not purport to contain all relevant information with respect to the financial products to which they relate. Although the Reports are based on information obtained from sources believed to be reliable, Market Matters does not make any representation or warranty that they are accurate, complete or up to date and Market Matters accepts no obligation to correct or update the information or opinions in the Reports. Market Matters may publish content sourced from external content providers.
If you rely on a Report, you do so at your own risk. Past performance is not an indication of future performance. Any projections are estimates only and may not be realised in the future. Except to the extent that liability under any law cannot be excluded, Market Matters disclaims liability for all loss or damage arising as a result of any opinion, advice, recommendation, representation or information expressly or impliedly published in or in relation to this report notwithstanding any error or omission including negligence


