Subscribers questions (CBA, NCK, OZL, MQG, ANZ)
The post-election and RBA euphoria is probably mostly behind us but the fact that bond yields and interest rates are continuing to grind lower, regularly making fresh all-time lows, remains a very health tailwind for the Australian share market. Considering the index closed on Friday over 19% above its December panic low is testament to the influence on stocks of lower bond yields but the rate of ascent feels unlikely to continue without a fresh catalyst e.g. healthily resolved trade talks.
On the sector front we continue to look for some outperformance from the Resources sector following its current pullback while feeling the healthcare and more defensive plays are looking tired. For our thoughts on the high flying Australian IT stock like Appen (ALX) and Afterpay Touch (APT) see question 4 later in today’s report.
MM is considering trimming our overweight banking exposure into any significant strength as the EOFY approaches.
Thanks as always for the great questions, there’s evidently nothing like a favourable election result for equities to generate some engagement in the market. Sorry if some of today’s answers are touch short but we would rather cover more ground in a concise fashion and still have time to focus on today’s market!
ASX200 Index Chart
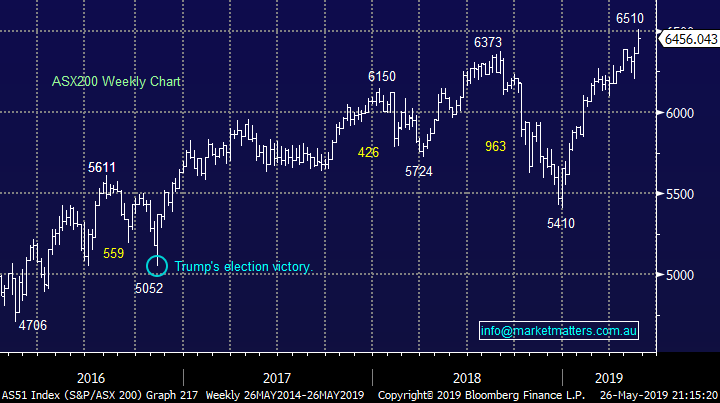
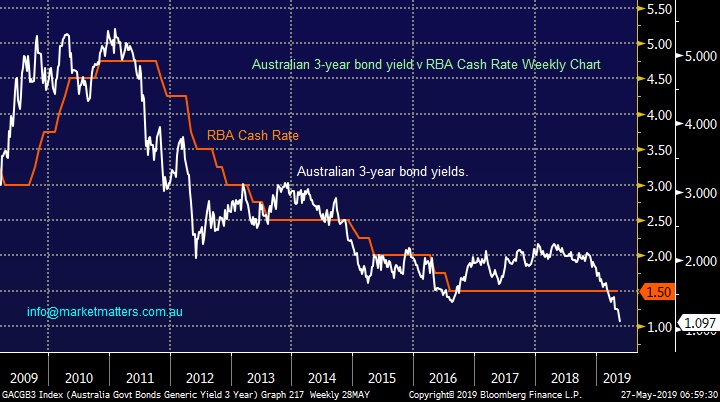
Following last week’s statement by the RBA markets are now looking for a rate cut next month plus a further 1-2 rate cuts over the next 12-months, it’s starting to slowly feel like things are as good they can get for the dovish followers. However there’s no reason why these low rates cannot hang around for a long time, remember we’ve now had the RBA Cash Rate at a previously unheard of 1.5% for around 3-years.
Stocks are revelling in the major tailwind of falling bond yields, moving forward we must look out for any reversion here.
Australian 3-year bond yield v RBA targeted Cash Rate Chart
Question 1
“Hi James, 'How wrong can polling be', ........ correct. And you forgot to mention how wrong you can be. I read many of your daily emails in which you went along with the consensus opinion from the polls, gambling agencies and wherever else you gained the spoken opinion from. MM and yourself being a proclaimed contrarian I found your view that we should all accept that Bill Shorten 'would be' the next Prime Minister rather disappointing. I can tell you now that I was never of this belief, I'm perhaps more on the ground than you are and I found the growing ground swell of people that were not voting Labour quite convincing that Labour would not win. I don't think after reading your daily emails on the subject that you were quite in touch with the amount of real people out here that would not vote Labour due to the proposed tax changes which would take money from their pockets. They were not prepared to just accept those losses and move on as you indicated. If you don't think your non contrarian view was displayed go back and look in your daily emails. I appreciate the work that Geoff Wilson was doing to take up the fight against some of these changes, I didn't see Shaw and Partners in there.
It would be my view that you would not have voted for Labour but you just accepted the rubbish put forward by polls and gambling agencies and put that view forward in your emails, very disappointing I thought.” - Thanks Steve Shanks.
Hi Steve,
We feel at MM that it’s not our job to be opinionated in politics, but instead work hard to deliver returns for our investors / subscribers based on probable outcomes from the information we have at hand. I’ll absolutely put my hand up and concede that I was of the opinion that Shortens Labor Government was a likely winner – I wasn’t alone in this opinion – but ultimately it was wrong. When we quoted consensus or betting agencies or other sources in our notes we’re simply trying to provide an insight in how the markets positioned around an event – in this case, the election.
While we may have thought the probable outcome was for a Labor victory, we also thought that it was priced into particular sectors leaving the risk to the upside – you might call this contrarian positioning. This is shown through overweight holdings in banks along with NIB Holdings (NHF) which was ultimately a big loser under Labor policy (so a net beneficiary on the off chance the Coalition won).
All in all, I’m glad the election is over, I’m glad franking credit policy remains unchanged along with CGT and negative gearing. In terms of Geoff Wilson, he ran a solid campaign & should be applauded with the election outcome a significant positive for the LIC structure of his funds.
Question 2
“James, now that the risk of losing taxation concessions on franked dividends appears to have receded, what are the medium to long-term implications of holding shares in the major banks? I am aware there is a lot more to holding bank shares than franking credits, but it seems the pressure is now off for the time being, allowing a more objective assessment of the circumstances.” - Kind Regards, John W .
Morning John,
Obviously as you say there a number of moving parts in this equation but there are 2 aspects which we believe are dominating at this stage and look likely to continue to do so over the foreseeable future:
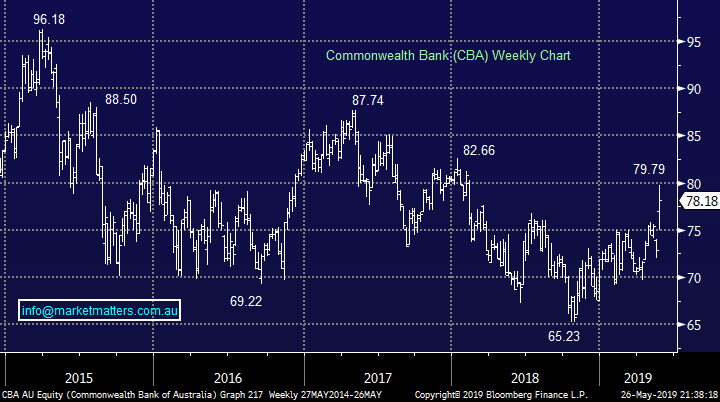
1 – The banks currently have no meaningful growth factored into prices, however the regulators have now shown a willingness to ‘tweak’ the availability of credit which has been a clear hand brake on lending. Further changes to promote the availability of credit is supportive of bank earnings.
2 – With few term deposits paying more than 2.5% pa the fully franked dividend yield on offer from our banks are becoming increasingly attractive as the RBA looks set to further cut rates e.g. Westpac (WBC) 6.69% and National Australia Bank (NAB) 6.43%.
While we remain comfortable that the Australian bank dividends are sustainable its hard to look past their yield, especially as fund managers appear to be very underweight the sector e.g. Westpac is set to pay $1.88 in fully franked dividends over the next year insulating investors for a ~7% fall in the stock before paper losses will be incurred.
MM remains bullish the Australian Banking sector.
Commonwealth Bank (CBA) Chart
Question 3
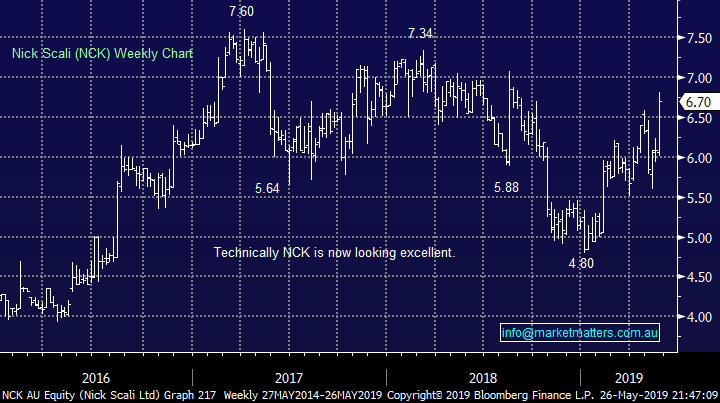
“Good note (last Fridays note on Consumer Discretionary stocks) a key retailer I would add to consider is Nick Scali (NCK) The Yield is 7.5% for FY19 .... grossed up is nearly 10% .... 10 year high and still on only 12x” – Rodney F.
Hi Rodney,
Your correct Nick Scali (NCK) definitely requires a mention, like the above mentioned banks the retailer fully embraced the positive tailwinds from the election and RBA last week. The solid yield and relatively low valuation does offer a healthy buffer to investors if the Australian consumer does again bunker down and address its large household debt issue – this burden still remains but lower interest rates clearly helps.
Unfortunately we cut this quality retailer from the Income Portfolio back in January on a risk / reward basis but so far the company has performed strongly in the face of adversity. Technically the stock now looks good with stops below $6.40.
MM is now bullish NCK with ~10% upside looking on the cards.
Nick Scali (NCK) Chart
Question 4
“Hi MM Team, just your opinion on entry to OZ Minerals (OZL) or is there other copper plays on your radar (SFR ? BHP??). Also I have traded Macquarie over the last several years over the last several years $50 to $120 (I know I exited too early last year) over various times and it has been a great “trading stock”, my concern is and I never hear about how much debt they have?? Your thoughts on their debt levels.” Thanks Tim C.
Hi Tim,
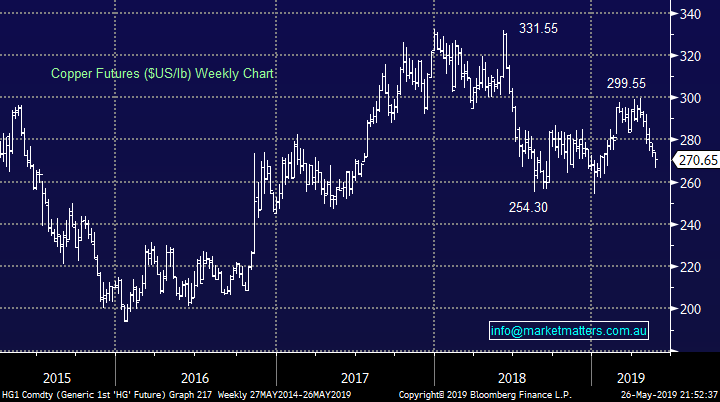
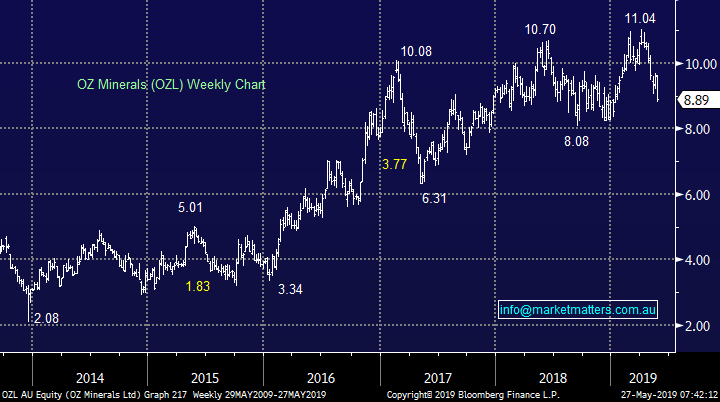
Copper looks pretty average at the moment as investors weigh up the potential impact of a protracted trade war between the US and China. However by definition the weakness in copper has brought the sector lower e.g. OZ Minerals (OZL) which has corrected over 20% from its 2019 high.
MM likes OZL into weakness and is considering accumulating below the $8.50 area, importantly leaving room to average in case we see any further surprises from President Trump.
Copper Chart
OZ Minerals (OZL) Chart
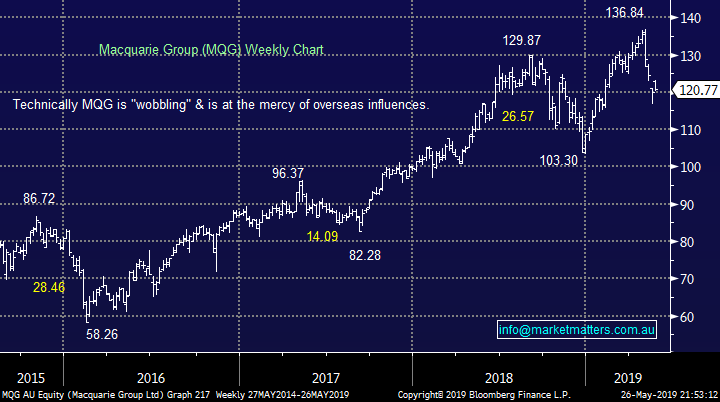
MM recently added MQG to the Growth Portfolio following its ~15% correction as it continues to track US indices relatively closely. In terms of debt, that’s not an issue at the moment with total debt to equity at low levels (for MQG)
Macquarie (MQG) debt to equity
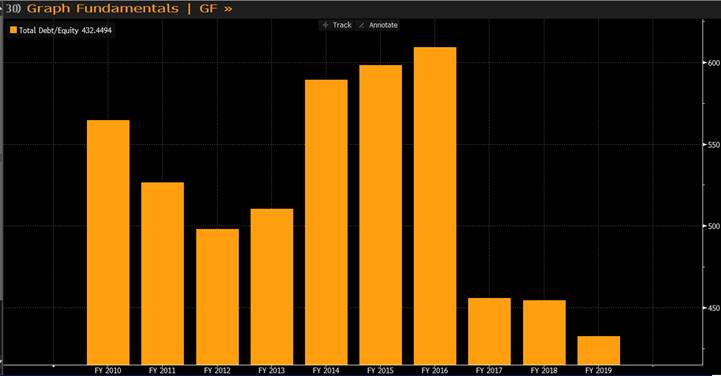
While their outlook for FY20 was below what we’ve grown to expect from MQG hence the decline in share price, they also often under promise and over deliver. Our feeling is its cheap on an Est P/E of 12.9x and yield of 4.76% part franked but we will take nothing for granted in this increasingly fickle market.
MM likes MQG while we remain positive global stocks.
Macquarie Group (MQG) Chart
Question 5
Hi Team, I read this article in “The Canberra Times” this morning. I wondered how you felt about Mr. James Holt analysis? A small group of high-flying tech stocks are creating a market bubble on Australian Securities Exchange, echoing the conditions before the dot-com crash and the global financial crisis, investment house Perpetual has warned. Wisetech, Afterpay, Altium, Appen, and Xero have been market darlings on the ASX, with their share prices doubling on average over the past 12 months. But James Holt, senior investment specialist at the $27.4 billion fund manager Perpetual Investments, on Monday said that the group of companies should be a "red flag" to investors that "at some point we're going to get a serious sell off". They also included NEA which I hold.” – Regards Richard S.
Hi Richard.
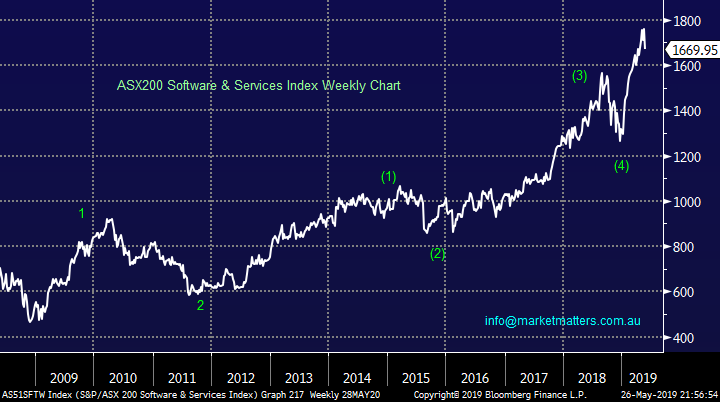
A contentious issue of momentum v valuation, these stock have enjoyed a stellar run in 2019 but MM unfortunately got off the train too early after buying perfectly in late 2018. Investors should remember the savage correction in late 2018 with many of the factors in existence then looking apparent today, especially the lemming like buying of momentum funds, they will sell on mass when things turn sour and the pullback may again be extremely disorderly.
The reasons we sold still apply i.e. the risk / reward at these elevated valuations is not exciting but MM may again consider 1 or 2 of the sector into weakness.
MM is currently very cautious on these high valuation stocks.
ASX200 Software & Services Index Chart
Question 6
“Hi Guys, Can you please outline your criteria for the income portfolio and how/why it differs to your criteria for the growth portfolio. I know you have explained it before but I have forgotten.” – Regards Cameron A.
Hi Cameron,
The portfolios look at investments from a different perspective but at times they do have overlapping positions because after all we are looking for optimum returns with acceptable risk / reward.
Growth Portfolio – This is a high conviction portfolio which looks to add value / alpha to an investors funds. This agile portfolio can move from fully invested to largely out of the market in cash or even short via ETF’s. We hold a maximum of 20 positions and regularly will hold zero exposure to individual sectors where we perceive economic / valuation headwinds lie ahead. This is a total return portfolio where income is secondary.
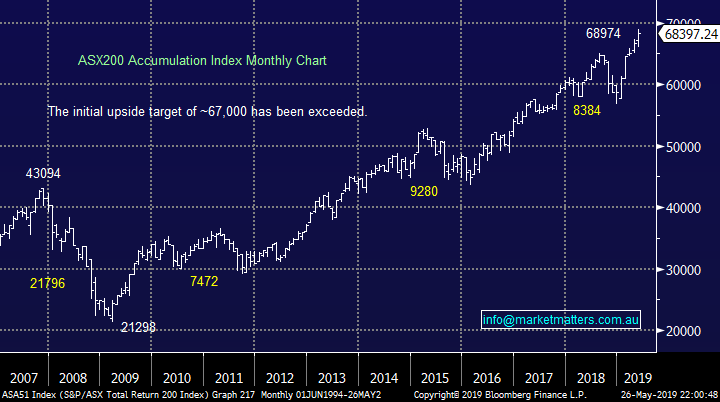
Income Portfolio – This portfolio focuses on income / yield with conservative capital preservation hence we hold a number of hybrids & income funds. The ASX200 Accumulation chart below illustrates the importance of dividends when compared to the underlying ASX200 which remains well below its pre-GFC highs. Obviously this portfolio is unlikely to enjoy any of the relatively quick highs returns that the Growth Portfolio has e.g. Bingo (BIN) where we are up ~30% in a few months but remember with big winners comes the occasional sharp loss.
ASX200 Accumulation Index Chart
Question 6
“Hi James and M&M, besides CBA, WBC, NAB, I also hold ANZ and now that all 3 banks are getting closer to the levels that M&M purchased at, could you include a sell price target for ANZ? Thank you, keep up the good work.” – Tony P.
Hi Tony,
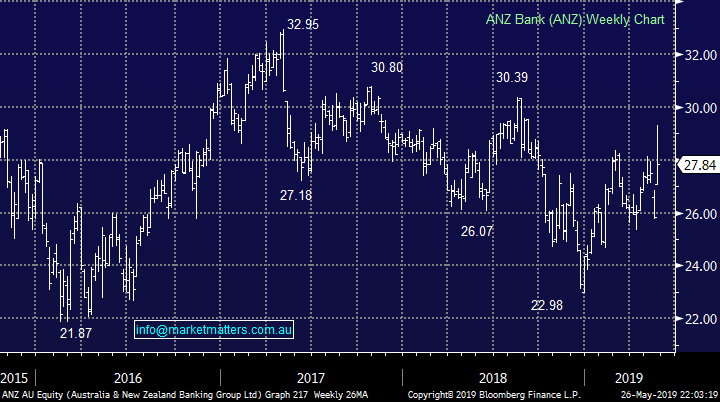
ANZ Bank (ANZ) is unfortunately our least preferred of the “Big Four” at this stage hence we have no holding but as a sector they continue to move in a highly correlated manner.
However, all things being equal if we owned ANZ the $30 resistance area is where we would consider reducing our exposure – similar to our thoughts around CBA, NAB and WBC.
ANZ Bank (ANZ) Chart
Question 7
“Subscriber Question Hi! thanks for your input, have a question, think I know the answer but can u clarify. This regards the 45 day period re franking credits. Say for instance I held 5000 ANZ shares for six months and then purchased another 5000 shares one week before ex dividend. If I sold 5000 shares one week after ex would it be deemed that I sold the first 5000 shares I purchased and hence receive full franking credits on 10000 shares or the last and receive franking credits on only 5000 shares. Sound like a stupid question but one never knows.” - Tom A.
Hi Tom,
The only stupid question is the one not asked!
While we don’t provide tax advice and it’s always best to check with your accountant, the first in, first out method is commonly used, meaning that shares purchased first are the ones that are sold first from an accounting perspective. Worth remembering the 45 day rule is 45 plus the day of purchase and the day of sale.
Question 9
“Hello, thanks again for your service it is my top3 and I have used literally hundreds since around 1975 or so like most I took some cash off the table b4 the election not so smart perhaps. Could you comment please about a few stocks on my watch list are they buys in your opinion: MQG, PPT, GMA, Costa And FMG” - Thank you Paul A.
Hi Paul,
A relatively long list which I have sorted them in order of my preference at today’s levels FMG, MQG, CGC and PPT /GMA.
Overnight Market Matters Wrap
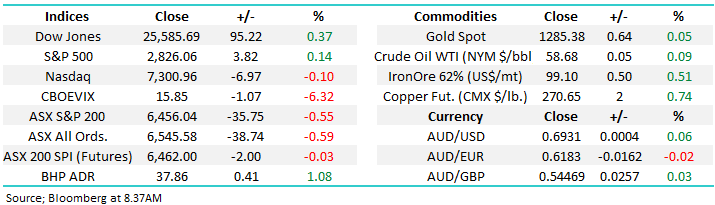
· Global markets steadied on Friday ahead of the US and UK markets being closed tonight - The US markets are closed tonight for the Memorial Day holiday and the UK for a bank holiday.
· There were however further signs that the US economy is slowing, with durable goods orders falling 2.1% as a result of a slowdown in exports and a build-up in inventories. Investors remain concerned that the economy will be further weakened by the ongoing US-China trade war, with no further signs of a near term resolution, despite President Trump saying that negotiations could be over quickly.
· Commodities firmed after a difficult week, with the oil price in particular recovering over 2%, taking back to US$58.68/bbl, however was 6.58% lower for the week. Iron ore firmed, while base metals were also slightly stronger. Resource stocks recovered some lost ground and we expect BHP to outperform the broader market after ending its US session up an equivalent of 1.08% from Australia’s previous close.
· The June SPI Futures is indicating the ASX 200 to open with little change, testing the 6460 level this morning.
Have a great day!
James & the Market Matters Team
Disclosure
Market Matters may hold stocks mentioned in this report. Subscribers can view a full list of holdings on the website by clicking here. Positions are updated each Friday, or after the session when positions are traded.
Disclaimer
All figures contained from sources believed to be accurate. Market Matters does not make any representation of warranty as to the accuracy of the figures and disclaims any liability resulting from any inaccuracy. Prices as at 27/05/2019
Reports and other documents published on this website and email (‘Reports’) are authored by Market Matters and the reports represent the views of Market Matters. The MarketMatters Report is based on technical analysis of companies, commodities and the market in general. Technical analysis focuses on interpreting charts and other data to determine what the market sentiment about a particular financial product is, or will be. Unlike fundamental analysis, it does not involve a detailed review of the company’s financial position.
The Reports contain general, as opposed to personal, advice. That means they are prepared for multiple distributions without consideration of your investment objectives, financial situation and needs (‘Personal Circumstances’). Accordingly, any advice given is not a recommendation that a particular course of action is suitable for you and the advice is therefore not to be acted on as investment advice. You must assess whether or not any advice is appropriate for your Personal Circumstances before making any investment decisions. You can either make this assessment yourself, or if you require a personal recommendation, you can seek the assistance of a financial advisor. Market Matters or its author(s) accepts no responsibility for any losses or damages resulting from decisions made from or because of information within this publication. Investing and trading in financial products are always risky, so you should do your own research before buying or selling a financial product.
The Reports are published by Market Matters in good faith based on the facts known to it at the time of their preparation and do not purport to contain all relevant information with respect to the financial products to which they relate. Although the Reports are based on information obtained from sources believed to be reliable, Market Matters does not make any representation or warranty that they are accurate, complete or up to date and Market Matters accepts no obligation to correct or update the information or opinions in the Reports. Market Matters may publish content sourced from external content providers.
If you rely on a Report, you do so at your own risk. Past performance is not an indication of future performance. Any projections are estimates only and may not be realised in the future. Except to the extent that liability under any law cannot be excluded, Market Matters disclaims liability for all loss or damage arising as a result of any opinion, advice, recommendation, representation or information expressly or impliedly published in or in relation to this report notwithstanding any error or omission including negligence.


