Subscribers questions (BHP, EVN, ORE, KDR, GMA, A2M)
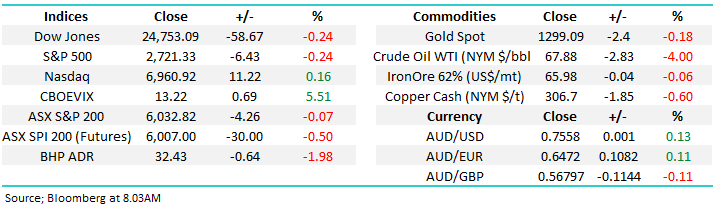
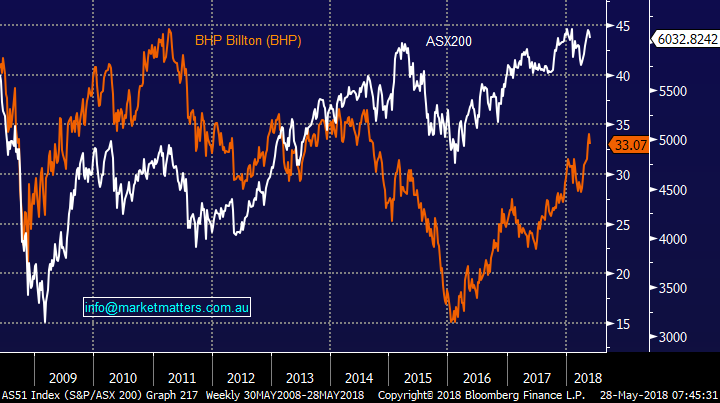
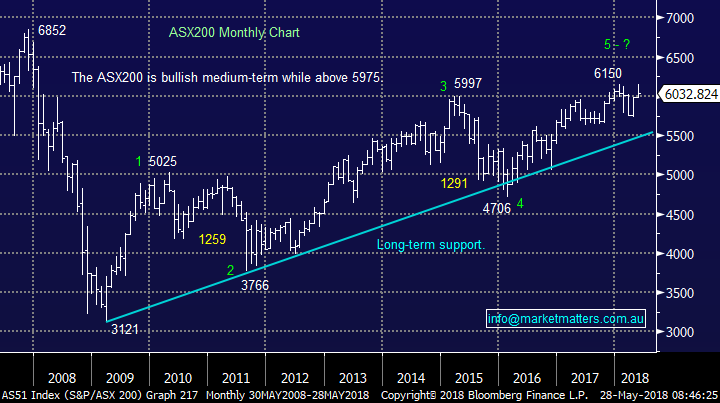
What a difference a few days makes, 9-trading days ago the ASX200 was a mere 4-points away from a new decade high but on Monday after a slow but sure deterioration in market sentiment we’re back at the psychological 6000-area. This week’s market weakness looks set to initially be led by the resources with oil tumbling 4% and BHP slipping close to 2% in the US, its suddenly over $2 / 6.2% below its high for the month.
As we discussed in the Weekend Report we maintain our short-term bearish stance towards the resources sector with our ideal target and buy zone for BHP around $29, another ~7% below where the stock looks set to open this morning. Hence if were correct the banks simply must regain some “mojo” for the ASX200 to make another meaningful assault on fresh decade highs e.g. market heavyweight CBA is down over 12% for the year while the broad market is up almost 5%.
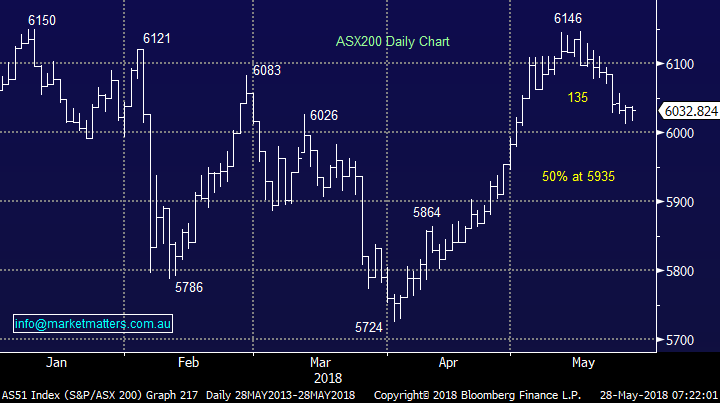
- We remain mildly short-term bullish the ASX200 but the risk / reward is no longer exciting for the bulls – especially considering our medium-term view.
ASX200 Chart
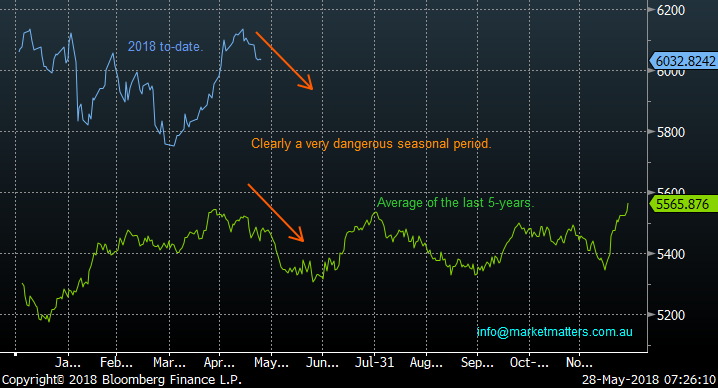
Also, we could not start our subscriber’s questions with again paying attention to the “horrible” seasonality statistics for this time of year, especially since the GFC:
- The average pullback from top to bottom is just over 10%.
- If we take out the 5 times the markets corrected over 10% the average is still almost 6%.
- So far, we’ve only corrected 2.2% from the May 6146 high, with a 6% pullback targeting ~5775.
As we often say statistics can be painted in lots of different ways but this is undoubtedly a dangerous period to be aggressively long stocks.
ASX200 Seasonality Chart
This week we again received an excellent group of questions which is fabulous, the volatility in a lot of popular stocks is clearly interesting many people. Today I have again answered more than 10 when you include the combined answers - of course please keep the questions coming!
Question 1
“If you are bearish medium-term why is MM considering buying BHP into weakness?” – Chris B.
Hi Chris, an excellent and logical question.
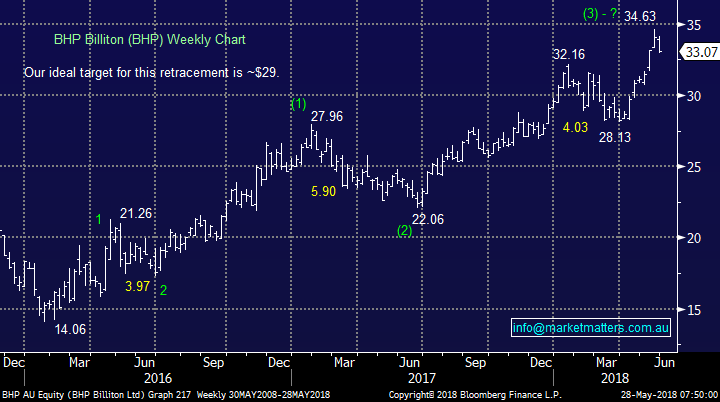
As you know we are targeting the $29 area to buy BHP, following the recent exit of our position ~$34. In the last 2-years BHP has already corrected significantly 3 times, our targeted buy area is only in-line with a similar % pullback. I will answer this question in 2 parts:
- There are a number of reasons to like BHP at the correct price, moving forward the pure value and looming capital management are the 2 most important to us.
- BHP is very happy to run its own race ignoring the ASX200, the second chart below illustrates the relatively low correlation between the two since the GFC.
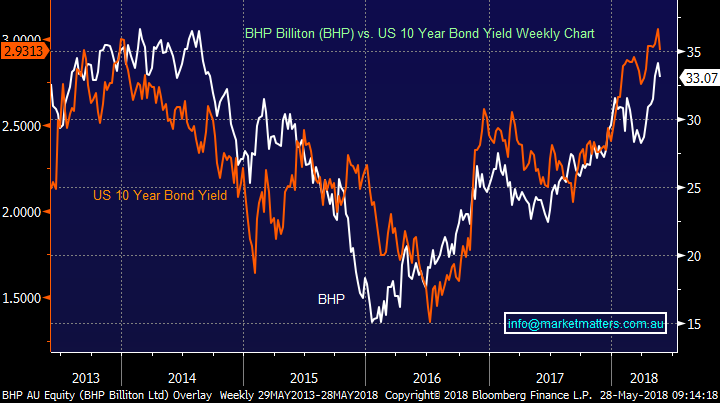
- On the flipside, BHP tracks US interest rates very closely – if we believe US interest rates are going higher, as we do, then BHP is a way of playing it.
Hence we’re happy at MM to be active in BHP with an overall positive bias even when / if we are bearish the ASX200.
BHP Billiton (BHP) Chart
BHP Billiton (BHP) v ASX200 Chart
BHP Billiton (BHP) v US 10 year bond yields
Question 2
“Hi, you mentioned in your daily report about the potential of Gold popping in price. Would you consider a position in GOLD ETF as a way to capture this?” - Thanks, Glen
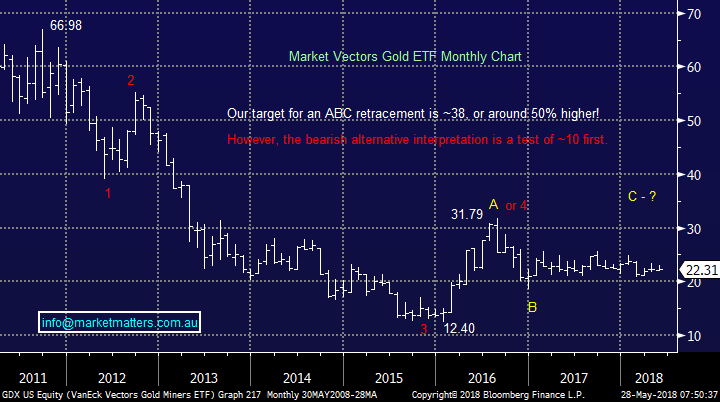
Hi Glen, in short, yes is the answer although presently due to the weakness of the $A in 2018 local gold stocks are significantly outperforming gold ETF’s:
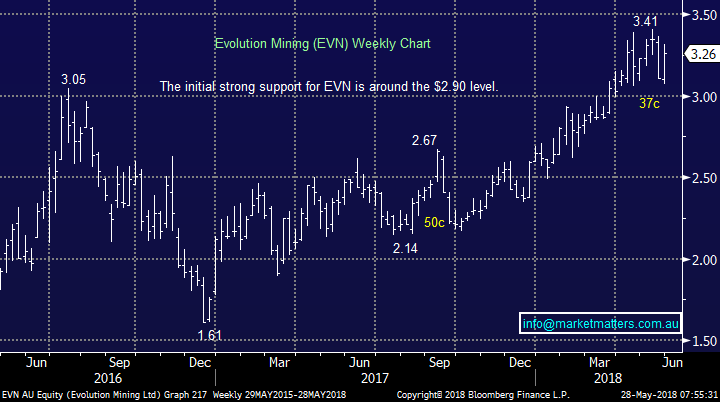
- As you can see below the Market Vectors gold ETF has hardly moved for the last 18-months whereas Evolution Mining (EVN) has basically doubled.
Hence assuming we maintain our bearish opinion on the $A at MM we are more likely to buy Australian gold stocks than global facing ETF’s – we particularly like EVN below $3.
Vaneck Vectors Gold ETF Chart
Evolution Mining (EVN) Chart
Question 3
“Thanks for the advice on A2M which we previously wanted and missed. Regarding Lithium: Thanks also for the heads up on ORE and KDR.
How does MM consider the recently published opinions of Howard Klein and his forecast growth figures? Have you done any calculations on what Lithium supply and mining might it be like in 12 or 24 months, (When might you take profit)? Do you agree with the 5-year production delay parameter, plus the preference for the various supply resources, Hard Rock, Brine and Spodumene? For the ASX listed lithium mines, which ones currently fall into each resource category? Does MM consider increasing their investment percentage in Lithium? How about some of the other electric vehicle minerals, such as Cobalt (ARL) and Graphite (SYR)? Is there a time delay when these more speculative battery mineral stocks might appear in your comfort zone? Today as we race towards the new financial year, how does MM expect that the ASX market might change or develop. (I recall some years ago when the market rallied in May.)
Thanks for your help in this difficult market.” – Phil B.
“I am interested in investing in companies presently mining and producing lithium and hydrogen for the battery market.” – Thanks Barry D.
Thanks for the questions guys, yours’ Phil is particularly comprehensive so please excuse any brevity in my answer(s).
As subscribers know we like the lithium / battery space but acknowledge the market has enjoyed a phenomenal 2-year rally which has understandably become extremely volatile on a week to week basis. A few thoughts:
- Global analysts are coming out with contradictory reports around lithium supply / demand numbers almost weekly – a theme I discussed briefly in a short recording on Friday.
- We believe its time in the cycle to stay with quality names and not to be over committed due to the abovementioned volatility – having the capacity to buy weakness (and not be shaken from longs) remains key.
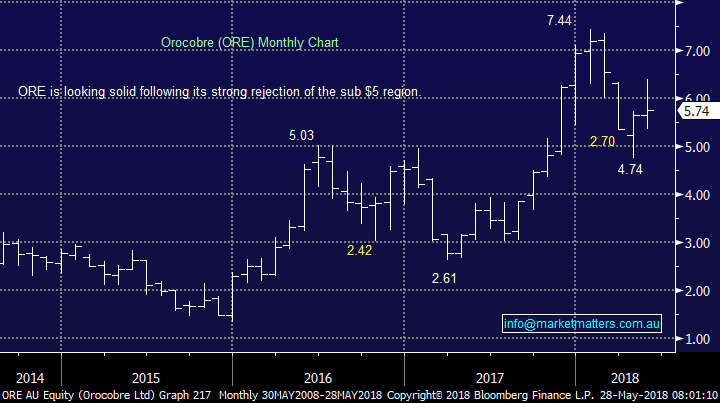
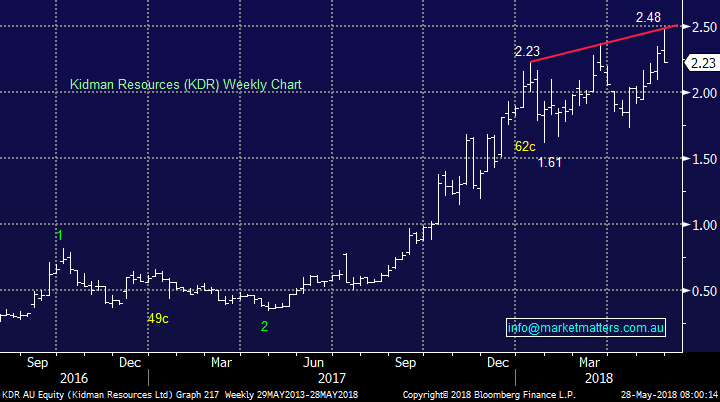
- We currently hold ORE and would consider adding / switching to KDR at attractive levels but only in a relatively conservative manner.
- We believe the stocks are almost in a trading phase as they drop / pop ~10% almost weekly hence we remain happy to take profits when they present themselves, just as we have already done on more than one occasion recently.
- We are not keen on heavily shorted SYR at present but think ARL is interesting for the aggressive investor.
As for the end of financial year we simply believe it’s a time to remain open-minded and wide awake as opportunities often present themselves both to buy, and sell.
Orocobre (ORE) Chart
Kidman Resources (KDR) Chart
Question 4
“Hi Team, I was interested to get your thoughts on KAR - Karoon Gas. Quick facts: Has circa 5.8% of its stock shorted Market Cap is circa $285 million - at current price of $1.16 It has cash of $333 million (as at 31 December 2017) 245 million shares on issue - this equates to a share price of $1.35 only taking into account the cash balance Recently announced a reserves downgrade and share price got whacked (understandably), but current valuations have these reserves as basically worthless anyhow. Negatives: revenue streams are sporadic at best, and hence they are burning through cash. Positives: they are looking at establishing their own production facilities to provide steady income streams. Also, there will be an increasing need for new projects / extra production capacity i.e. supply (worldwide) in the very near future. This enables them to potential sell or materialise value from their identified reserves. As oil price rises, and / or stabilise (especially if we see a flattening of the forward price curve) - new projects will become more commercially viable / attractive. Hope to get your insights.” - Regards Scott
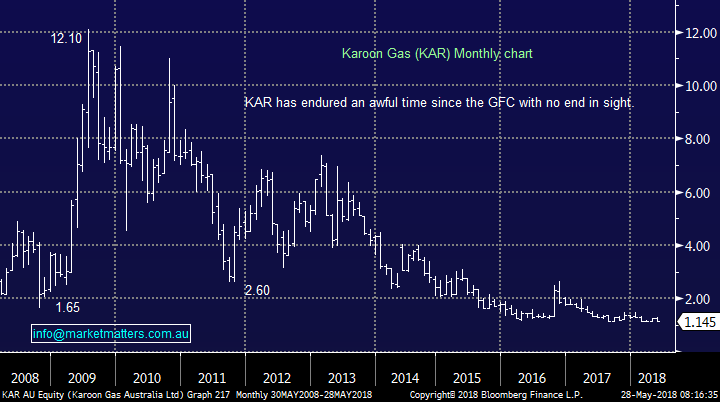
Hi Scott, I think you’ve almost answered your own question above……we believe KAR is simply too hard and MM sees better opportunities elsewhere and for now the market agrees with the stock basically unchanged for ~2-years.
Karoon Gas (KAR) Chart
Question 5
“Please advise on GMA’ s pull back after today’s news. You did suggest to consider selling around $2.65 several months ago. Since the buyback has stopped, do you think the price will drop below $2.55 – A2M has done well today after the bad day yesterday.” - Regards John.
Hi John, The stock closed down 1c at the end of last week so recent news flow is clearly of little impact.
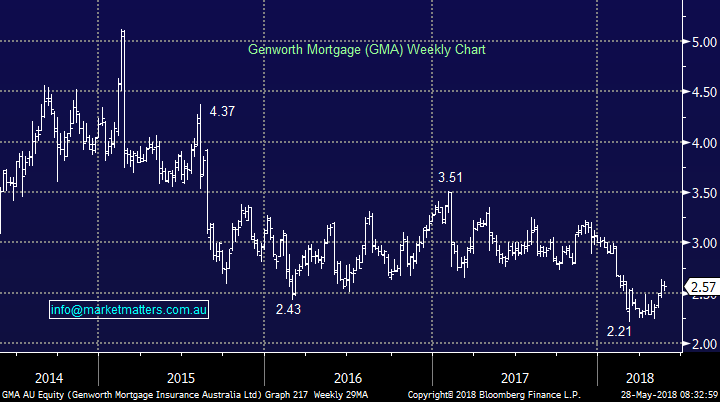
GMA is cheap with a lot of negative news flow built into the share price, while its paying a very attractive dividend. The issue is clearly around the negative trajectory of their earnings given the demand for mortgage insurance has fallen as banks tighten lending standards, however than means GMA has high amounts of excess capital – and that means share buy-backs and other capital management initiatives, which is why we hold it. The current (new) buy back has only really just started with the most recent announcement showing $2.77m worth of shares bought back, out of a total announced buy back of $96.5m
We remains comfortable to hold GMA in our Income Portfolio and technically the stock is looking solid around current levels.
Genworth Mortgage (GMA) Chart
Question 6
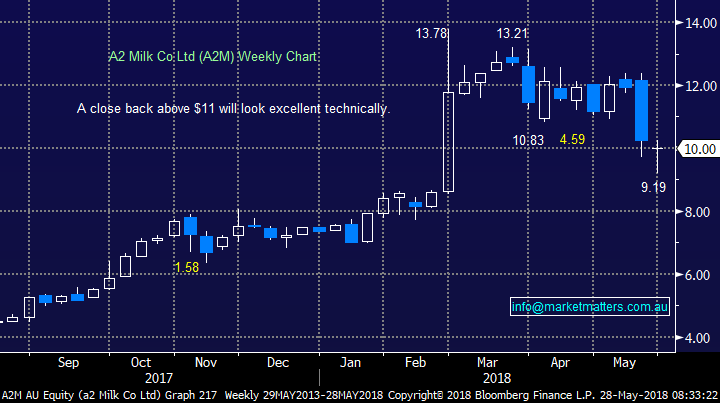
“Hi James, what are your thoughts on A2M after its recent rollercoaster ride” – thanks David
Hi David, it certainly has been volatile but it was nice to see the stock close almost 9% above Wednesdays low on Friday. We’ve recently warned about the risks in high valuation stocks especially considering the stock markets mature bull market position and rising bond yields, nonetheless the recent 25% plunge by A2M was pretty ruthless.
It felt to me that we’ve seen a decent holder selling out considering the huge volumes exchanging hands and aggression in the selling on down days, no news at this stage but I’ll keep a look out and will write about it if the selling starts to dry up / and or we see some substantial notice changes.
We remain comfortable with our position in A2M although it’s never nice to be down, in this case ~5% - technically a weekly close back above $11 will look excellent.
A2M Milk (A2M) Chart
Question 7
"Hi James, I know MM has a bearish view on bonds / higher interest. Looks like we need to build more shorts into our portfolios as I think you have discussed from time to time referring to various ETFs. Maybe you could expand on this theme? thanks for all your great work,” - Rob J.
Hi Rob, you’re correct we do believe that interest rates are positioned to keep rallying and eventually the market will suffer another decent pullback – a test of ~5000 is our bold call for the ASX200.
Firstly, we would not consider holding classic “bond proxies” that many regard as defensives e.g. Sydney Airports (SYD) and Transurban (TCL).
Secondly, on the ETF front I will look to write a piece in a morning report this week specifically looking at 5 ETF’s we may use in 2018 because they are highly likely to become more important instruments for MM in the coming years.
ASX200 Chart
Question 8
“Hi James, brilliant, I love reading someone being humble and admitting to making mistakes in the market, because is not easy. More credits are earned from being honest and admitting to mistakes than just blowing your own trumpet and masking failures, well done and keep on making your calls. – Regards Frank.
Hi Frank, thanks for the thumbs up!
Unfortunately we don’t have a crystal ball and do make mistakes, every one of them frustrating but one of the things we pride ourselves on at MM is total transparency, we have no hesitation raising our hand when were wrong and this will not change as the service evolves.
Overnight Market Matters Wrap
- The US markets closed mixed last Friday, with President Trump’s cancellation then reversal of the US-North Korean summit planned in 2 weeks.
- Losses were led by energy companies as oil tumbled after Russia and the Saudi’s said that they may increase output to slow the rise in oil prices. Trump had previously tweeted accusations that OPEC had artificially stimulated prices.
- BHP is expected to underperform the broader market yet again, after ending its US session off 1.98% from Australia’s previous close.
- The June SPI Futures is indicating the ASX 200 to open 31 points lower testing the 6000 resistance level this morning.
Have a great day!
James & the Market Matters Team
Disclosure
Market Matters may hold stocks mentioned in this report. Subscribers can view a full list of holdings on the website by clicking here. Positions are updated each Friday, or after the session when positions are traded.
Disclaimer
All figures contained from sources believed to be accurate. Market Matters does not make any representation of warranty as to the accuracy of the figures and disclaims any liability resulting from any inaccuracy. Prices as at 28/05/2018. 8.31AM
Reports and other documents published on this website and email (‘Reports’) are authored by Market Matters and the reports represent the views of Market Matters. The MarketMatters Report is based on technical analysis of companies, commodities and the market in general. Technical analysis focuses on interpreting charts and other data to determine what the market sentiment about a particular financial product is, or will be. Unlike fundamental analysis, it does not involve a detailed review of the company’s financial position.
The Reports contain general, as opposed to personal, advice. That means they are prepared for multiple distributions without consideration of your investment objectives, financial situation and needs (‘Personal Circumstances’). Accordingly, any advice given is not a recommendation that a particular course of action is suitable for you and the advice is therefore not to be acted on as investment advice. You must assess whether or not any advice is appropriate for your Personal Circumstances before making any investment decisions. You can either make this assessment yourself, or if you require a personal recommendation, you can seek the assistance of a financial advisor. Market Matters or its author(s) accepts no responsibility for any losses or damages resulting from decisions made from or because of information within this publication. Investing and trading in financial products are always risky, so you should do your own research before buying or selling a financial product.
The Reports are published by Market Matters in good faith based on the facts known to it at the time of their preparation and do not purport to contain all relevant information with respect to the financial products to which they relate. Although the Reports are based on information obtained from sources believed to be reliable, Market Matters does not make any representation or warranty that they are accurate, complete or up to date and Market Matters accepts no obligation to correct or update the information or opinions in the Reports.
If you rely on a Report, you do so at your own risk. Any projections are estimates only and may not be realised in the future. Except to the extent that liability under any law cannot be excluded, Market Matters disclaims liability for all loss or damage arising as a result of any opinion, advice, recommendation, representation or information expressly or impliedly published in or in relation to this report notwithstanding any error or omission including negligence.
To unsubscribe. Click Here


