Subscribers’ Questions – (BBOZ, XARO, AAPL US, NBL, CSL, SEA, RFG, MCHI US, RHC, TGP)
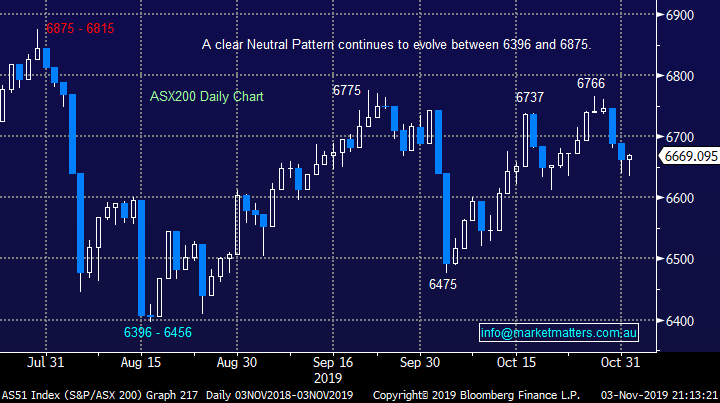
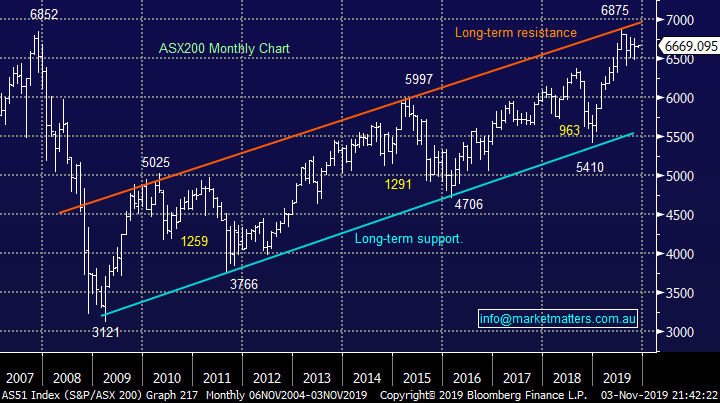
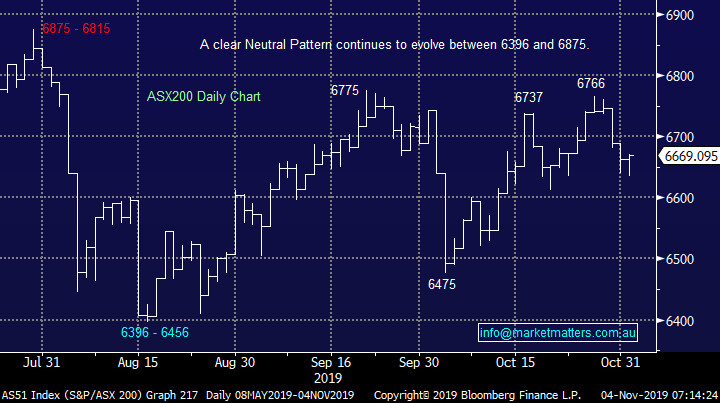
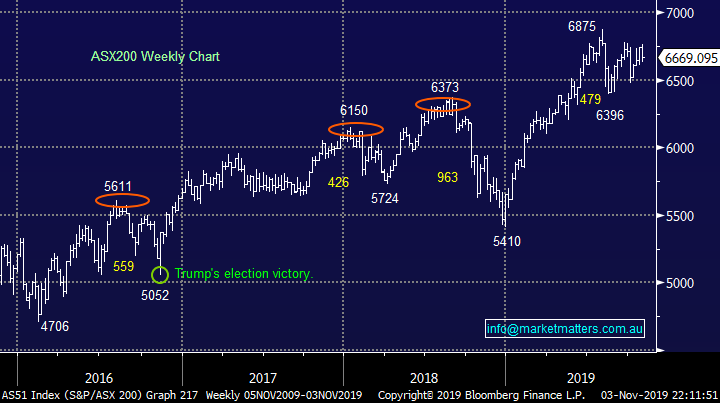
Last Monday we felt the ASX200 was well positioned for a breakout to the upside while the 6700 area held but true to recent form the current choppy stock market did indeed break back below 6700 and headed back down towards 6600, in other words to MM the “Controlling Pattern” is the Neutral Pattern between 6875 and 6396. The classic characteristic of such a Neutral Pattern is choppy, random and largely unpredictable price action, this certainly sounds on the money at present.
MM remains comfortable being relatively defensive at this point in time but we have skewed portfolios towards the value stocks, as opposed to growth.
The major piece of news which caught our eye over the weekend was the confirmation that the listing of the world’s most profitable company Saudi’s Aramco has finally been given the green light. Their domestic listing date is December with an anticipated valuation of between $US1.5 & $US2 trillion, a huge number but they did make a phenomenal $US111bn in 2018. This is a company that pumps 10% of the world’s oil hence the question I ponder “will fund managers sell other oil & gas holdings to fund purchases of Aramco?” or have they kept $$ to one side, after all they do appear to be sitting on plenty of cash but are they confident with investing it in a very economic sensitive sector – watch this space for an opinion as the week unfolds.
I wont give a Melbourne Cup tip this morning – never really have much success - but I do think the RBA will choose to watch the race this time around leaving the next change in policy until 2020 i.e. no rate cut on Tuesday is our call.
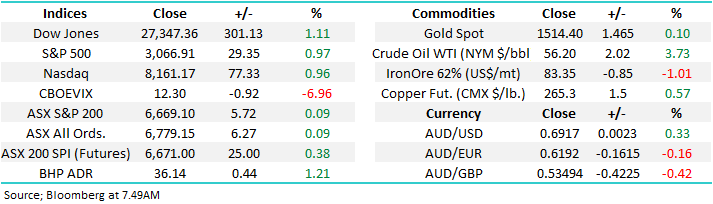
On Saturday morning the SPI futures were pointing to the ASX200 opening up 25-points taking the index back towards the 6700 level as the rotation continues - BHP closed up +1.2% implying the resources will spearhead gains today while the banks will get hit following news this morning that Westpac (WBC) will raise 2.5bn in fresh equity. Westpac also announced a larger than expected cut to the dividend, which will be taken down to 80cps from 94cps for the half. We thought they would cut it, however we did not think by this magnitude. From what I could see last week, there was only one analyst expecting a dividend of 80c with the market around 90cps.
Westpac also announced a 15% drop in profit to below $7bn, however that was largely excepted by the market. The stock is in trading halt this morning so more detail will be provided in todays afternoon note on the actual underlying numbers, however the other banks will be under pressure this morning. As we said in the Weekend Report we liked CBA below $76, that feels a strong possibility this morning.
Thanks for the questions as always, a solid volume which MM finds extremely encouraging, we want an engaged subscriber base that interacts almost like a mini investing community, thanks!
ASX200 Index Chart
As we touched on in the MM Weekend Report many of the US S&P500 indices made fresh all-time highs on Friday, we regard this as a bullish short-term indicator for US stocks but similar to our market this interpretation is on a knife edge. Remember stocks trade sideways ~85% of the time hence there’s nothing unusual with what were experiencing today.
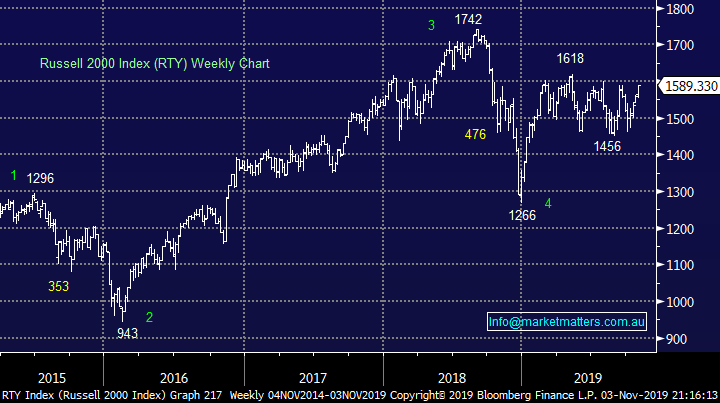
1 – The small cap Russell 2000 looks to be eventually be headed over +10% higher but how its does it remains the million dollar question, a pop up towards 1650, followed by failure back down towards 1450 before then rallying would probably be the “path of most pain” but at this stage we have no attractive risk / reward short-term view.
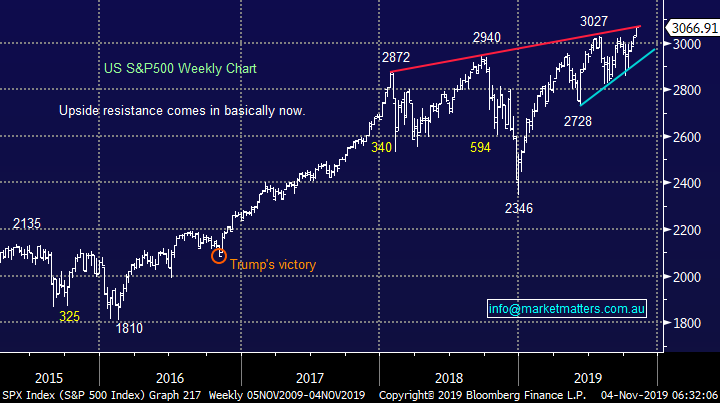
2 – The more widely followed S&P500 continues to make fresh all-time highs but with almost zero impulsive momentum, at this stage its technically bullish while 3025 holds, ~1.3% lower.
Hence overall we currently have the US market in the too hard basket but that’s usually just when it shows its hand!
US Russell 2000 Index Chart
US S&P500 Index Chart
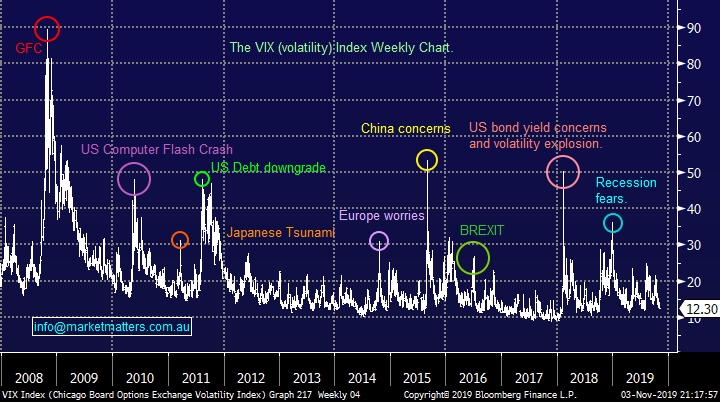
Another quick look at the VIX “Fear Gauge” below shows markets are continuing their return to a relaxed mood although a few other indicators suggest it’s not a great time to go long – sounds like our market, more choppy action ahead where opportunities to buy weakness keep presenting themselves.
For the next few weeks / months stocks look positioned to squeeze higher sending the VIX back down to its more historically dangerous 10% area.
MM believes US equities are again slowly but surely becoming complacent but were not there yet.
US Fear Index / Volatility (VIX) Index Chart
Question 1
“Hi, should I still be holding BBOZ, or not?” - Regards Luke M.
Morning Luke,
Thanks, the best questions are often the simplest and most direct. This takes us to an important area where we’ve been before. Importantly at MM, we write about / cover what we are doing – it is general commentary only based on our own approach and does not take into consideration any subscribers personal circumstances
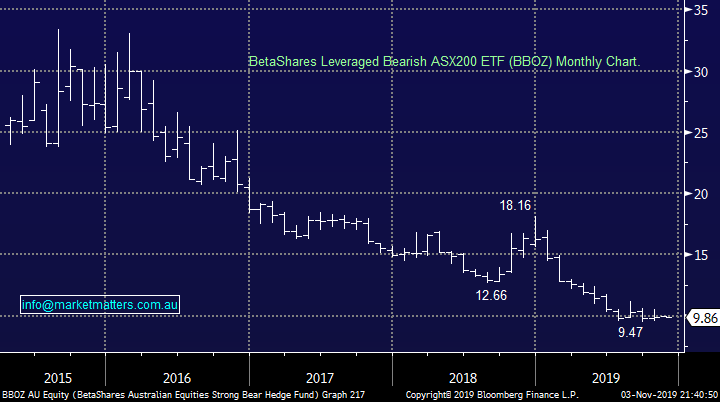
Each position MM is holding in our portfolio’s is just that, part of a mosaic of positions, as opposed to a stand-alone entity. Obviously by definition each position in these portfolios we like and they have their own validation but we would not necessarily hold them if they were considered as a one off position. For example with the BBOZ the markets underlying trend is neutral hence not an optimum time to buy this ETF but we like it as a hedge against our relatively large market exposure – should help today with any weakness in the banking sector.
MM is neutral the ASX200 today thus would not buy the BBOZ outright – we have it as part of our portfolio mix..
ASX200 Chart
BetaShares Leveraged Bearish ASX200 ETF (BBOZ) Chart
Question 2
“Hi guys, hope all is well. Are you paid to promote any of your suggested investments suggestion? For example when you suggest the fund XARO is that a purely objective call. I don't mean to insult with this question but I'm new to this so thought I'd ask. Cheers Tim
Hi Tim,
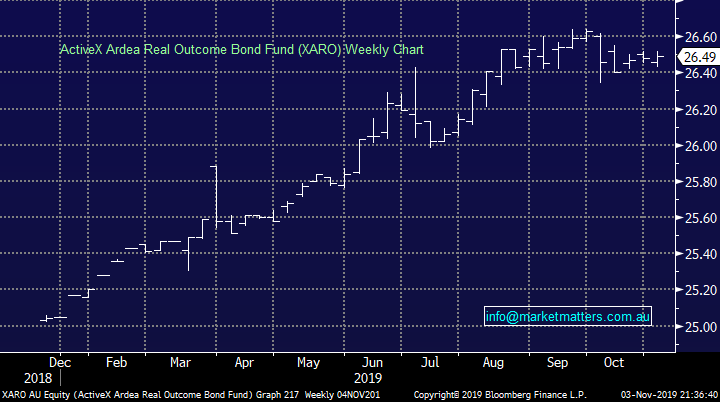
An extremely logical question - no offence taken and very much a topic worth covering. I bet you’re not alone with these thoughts! In short, no, totally objective call - never paid to make any particular recommendation in this newsletter. We simply write about the things we are buying / things we like / things we don’t, how we’re positioning our portfolios.
I do have a role at Shaw and Partners, and Shaw do earn fees for placements, corporate actions etc however if that is the case, I will say so at the time we are writing about the offer - it’s rare however funnily enough, we got a question this morning on a deal Shaw was involved in. It provides a good example of how we would cover that off.
Active Ardea Real Outcome Bond Fund XARO) Chart
Question 3
“would run stops on longs below $” -.MM Monday 28. I have never understood this phrase and it’s probably about time I did. Can you amplify the meaning and describe how to do it.” - Thanks Chris G.
Hi Chris,
A great question and one which can best be answered with a couple of examples / illustrations. Firstly a strong market and an ideal one for an investor to be long is simply making both higher swing highs and lows.
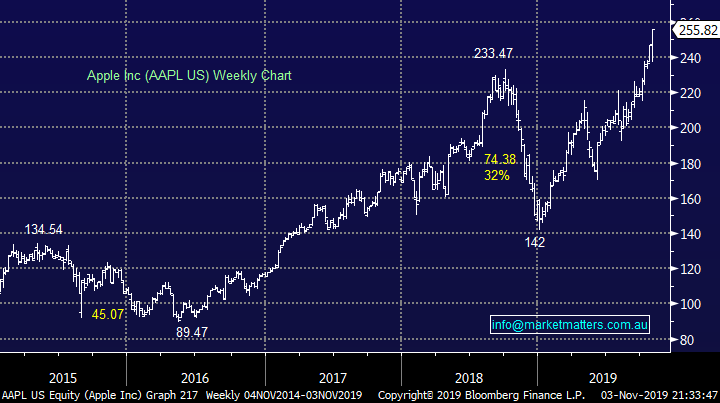
1 – Apple (AAPL US): Below we can see Apple has been trending up nicely since its 2015 / 2016 pullback, which happened to coincide with a major market correction. The sharp correction in 2018 failed to penetrate the $US134 swing high in 2015 confirming the stocks excellent bull trend. Now in 2019 its broken out to fresh all-time highs meaning to maintain this strong uptrend Apple should now hold above $233 hence to “run stops on longs” here simply means hold Apple but take $$ if / when it falls below say $US230.
2 – ASX200: Similarly with the local index following its recent rally from 6475 in early October we felt it should make an assault on 6800 last week while 6730 held which ultimately it did not hence when applying the same “would run stops on longs below …” in this case active players should have exited last Wednesday as the index slipped below 6730, a much better price than we saw on Thursday, Friday and probably this morning.
NB This is a very simple example but like all technical analysis the foundation is risk / reward.
Apple Inc (AAPL US) Chart
ASX200 Chart
Question 4
“Great email. Question for Monday please: Thoughts on Noni B please? Trades on FY20 consensus 3x EV/EBITDA, 12% grossed up Dividend Yield, with Insiders owning over 40%. Online is growing double digit, ROCE 30%, and has largest discretionary retail database of customers at 4.5m. Will be changing names to Mosaic Brands in November, as it now owns 7 retail brands. Interested in thoughts.” - Thanks Rodney F.
Hi Rodney,
Thanks again for positive feedback, always makes me feel good on a Monday morning.
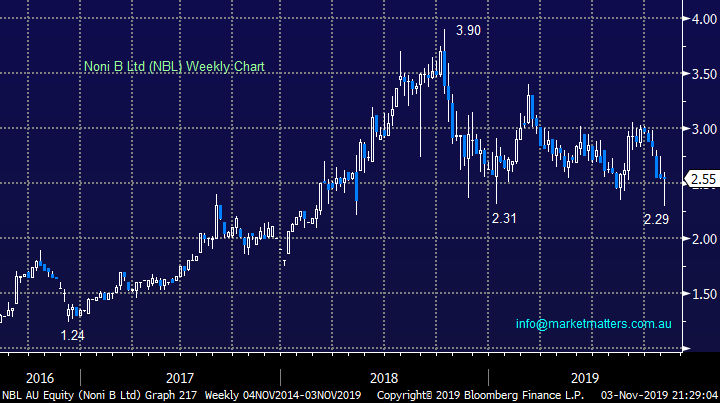
Noni B is a ladies fashion retailer which operates throughout Australia, I actually have different forward numbers to you on this business - I see it paying over 6% grossed up for franking but either way a great yield. This is a relatively small retailer with a market cap of $247m whose likely to sink or swim simply around how well they manage their balance sheets, brands and ultimately business.
The companies currently trading on an Est P/E for 2020 of 6.6x which is not demanding but investors have often become wary of business that grow through acquisition, in this case brands like Millers, Katies and Rivers. This is not a stock that excites us but we could comfortably be long from a risk / reward perspective with stops below $2.29.
Noni B Ltd (NBL) Chart
Question 5
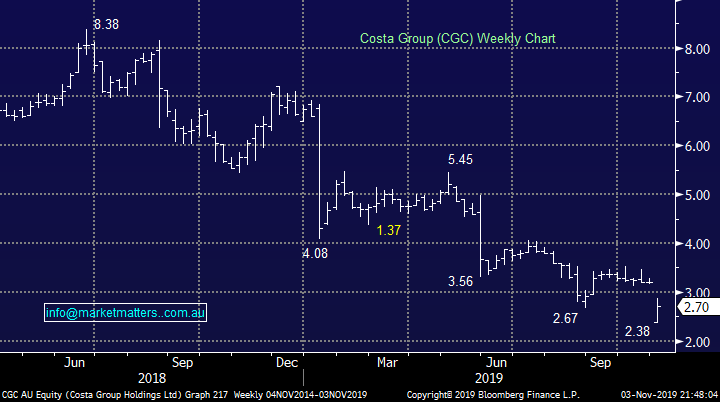
“Hi MM team. CGC ( no wonder a man drinks!!!! ) regarding your bad loser comments, and suppressed mood just stop remember ....you still you have a lot more wins on the board then loses. However what is your strategy sells the rights , take them up or let lapse. Keep up the good work.” – Daniel W.
Daniel,
You're not wrong on the emotions with this one! At this stage we do intend to take up the rights but obviously all investments are fluid in nature and our decision may change before the cut off date, however we will keep all informed through these daily notes. .
MM is targeting ~$3.50 for CGC but our position size is large so we will consider ‘trimming’ into strength before then.
Costa Group (CGC) Chart
Question 6
“Hi there, I'm learning a lot from your newsletters - thank you! Some more questions......Why are infrastructure stocks affected negatively if bond yields go up? Does a cleansing notice affect share price? How long can a company stay in a trading halt for takeover negotiations? CRB have been in one since May and keep extending it every month. Is there a time limit? You mentioned Utilities and Real Estate being yield stocks. Do they typically have higher yields than say BHP and the Australian Banks? What makes them "yield play" stocks over other sectors? You mentioned in this morning's email that our simple point is be prepared to take profits when stocks hit our / your targets as they might vanish as quickly as they materialised. Do you have a standardised percentage increase that you aim for with all stocks or do you assess each one individually and set a target to sell? I have CSL and it's making a good profit but you mentioned that your steering clear of healthcare due to it having a good run. I'm wondering should I wait for an engulfing red candle to get out or set my stop a percentage under the price. Currently I have it at 3 ATR.” - Regards, Kim B.
Hi Kim,
Wow a big question, I have touched on a few points briefly today otherwise the report will still being scribed when the market opens this morning.
1 – Infrastructure stocks are usually negatively impacted when interest rates rise because their debt becomes more expensive but also their yield becomes comparatively less attractive i.e. term deposits start to pay more interest with theoretically lower risk.
2 – Companies can stay in a trading halt for a maximum of 2 days before they are suspended – which can last a lot longer.
3 – Real Estate & Utilities are regarded as “yield plays” because their yield is regarded as predictable / sustainable not because its necessarily huge, whereas BHP’s is determined by the price of commodities i.e. very cyclical in nature over the years.
4 – When we invest in a stock there’s a lot of moving parts to the equation but we definitely do not standardise a % target for all. We evaluate each individually on its own risk / reward merits.
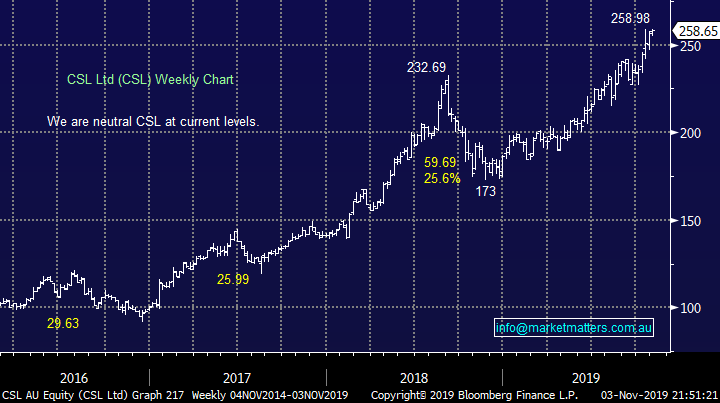
5 – Technically CSL looks good to us while it holds above $230 for the long-term investor and $240 for a more short-term skew. This is a wonderful business which doesn’t excite us at today price from a risk / reward perspective but its costing us!
CSL Ltd (CSL) Chart
Question 7
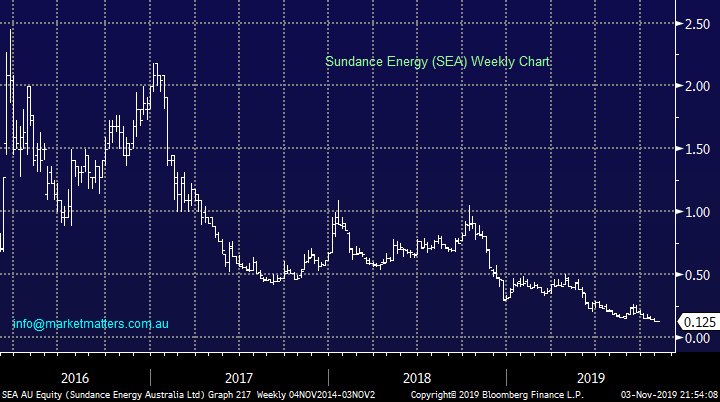
“A question for Mondays report in relation to Sundance Energy (SEA). I note the shares are soon to be listed on the NASDAQ & delisted in Australia. Small shareholders are being given the opportunity to sell their shares prior to the NASDAQ listing but with the share price well down at present I am reluctant to do so. If I hold the shares how do I trade them once they are no longer listed in Australia.”- Thank you Ian C.
Hi Ian,
If the stock is relisting on the NASDAQ I would be reading the fine print carefully because the stock looks very average locally, stocks often get excited when they are going to relist on the NASDAQ because it often comes on at a higher price.
In theory if it lists on the NASDAQ your stock should be converted to US shares prior to the listing but sorry I’m not familiar with this particular deal.
Sundance Energy (SEA) Chart
Question 8
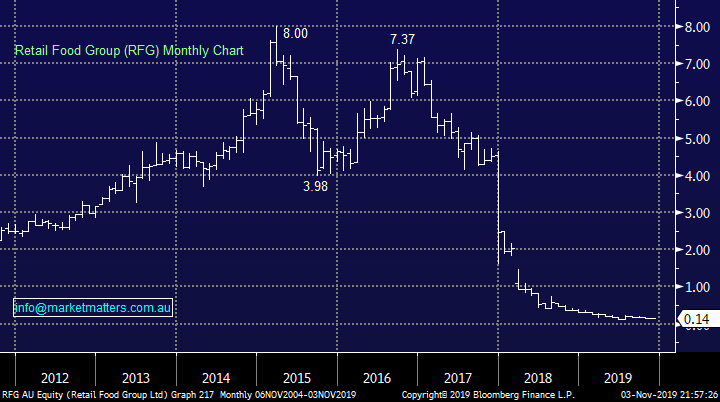
“Good Morning, I am one of those licking the deep wounds of the RFG disaster. Unfortunately I rode the company down to the bottom from an entry point of $5.33. I hold over 5,600 shares so the loss is close to $30k! I hung on because the company was obviously a going concern and the various enterprises still seemed to be humming along in the shopping malls. Now the dilemma is to work out if taking up the current offer is a reasonable bet or putting good money after bad. I’m always inclined to be optimistic by the way. On the one hand the company’s pitch seems positive but recent analysis and commentary on the offer in the SMH (Business) was fairly scathing. However Fairfax as the original whistle-blowers could be seen as biased observers so as a recent subscriber to MM thought I’d ask for some advice that might help me to work out what to do. Your thoughts would be greatly appreciated. PS. Finding MM worthwhile and a great help in setting some new directions.” - Cheers Graham R
Hi Graham,
Firstly thanks as always for the thumbs up, and a reminder that our comments are general in nature.
RFG have recently negotiated a company saving haircut to their debt, have raised fresh equity at 10c and now have a very well regarded Executive Chairman in the job, Peter George . That said, it is very speculative in nature and by taking up the issue, holders are backing the ability for senior management to turn things around. I actually went to a presentation on this deal and I came away thinking they could make this work with the better capital structure employed after debt nearly killed them. I’m cautiously positive RFG, however note its very high risk.
Retail Food Group (RFG) Chart
Question 9
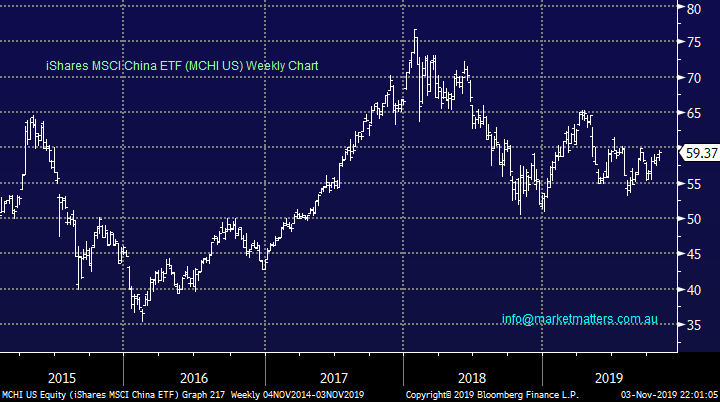
“Morning James and Team, My question to you guys is how do I invest in china's economic growth with safety such as a ETF which specifically invests in the Google, Microsoft and amazons of the future that i can buy on the ASX or the American stock market.” - Thanks Daniel C.
Hi Daniel,
There are a number available in this ever evolving market but our favourite at the moment is the iShares MSCI China ETF which focuses on the top 85% of the Chinese index by market cap, this by definition will capture their success stories of the future:
https://www.ishares.com/us/products/239619/ishares-msci-china-etf
iShares MSCI China ETF (MCHI US) Chart
Question 10
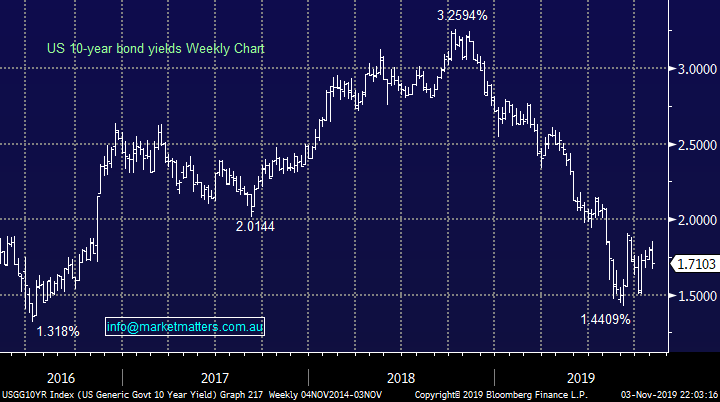
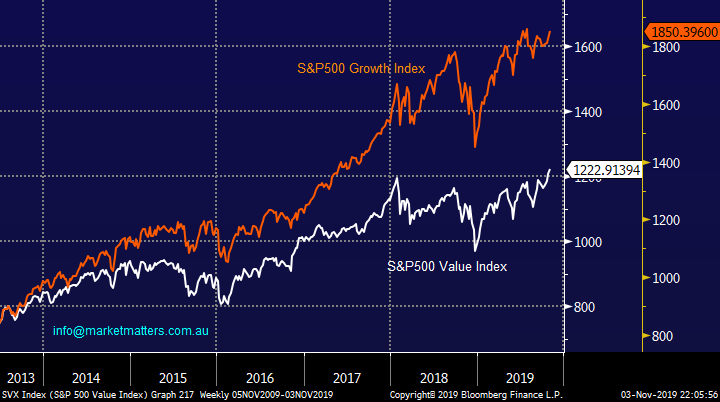
“Hi James! Correct me if I'm wrong.......bond yields are increasing so value stocks should perform better than growth - is that right? Why then has BHP, FMG and RIO been churning sideways?” - Thanks, Kim B.
Hi Kim,
At the moment bond yields are not increasing they have simply stopped falling as the US 10-year Note chart illustrates below. Hence its not surprising that the Australian major resources are churning around, its what bond yields are doing.
At MM we are indeed expecting the value sector to outperform growth but this is a pre-emptive call for a change in relative performance, we are still waiting for confirmation we are correct.
US 10-year Notes Yields Chart
US S&P500 Value & Growth Indices Chart
Question 11
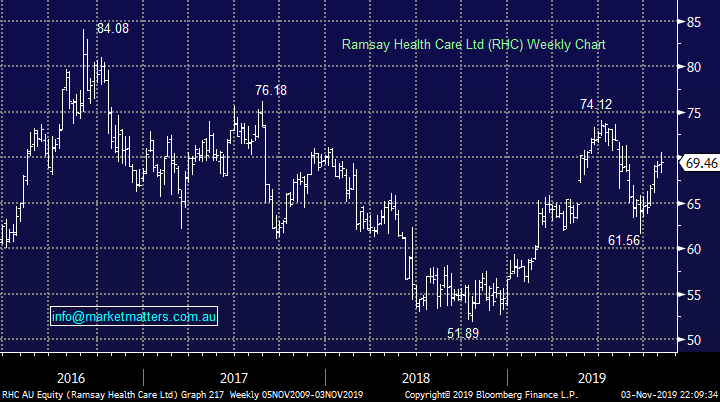
“Hi James, thanks as always for the great analysis that you bring to the table. Wondering whether you can give your thoughts on Ramsay Healthcare (RHC) I am wondering whether your thoughts on it are similar to CSL i.e. ..getting toppy ?... (I am surprised that you rarely cover this stock even though it would be in many Australian portfolios). Whether MQG represent the same sort value as the other banks NAB and WBC that you are currently liking as a rotation away from ANZ. Also whether you could comment on S32 (are they worth a look as well as OZL?)” - Many Thanks Don H.
Hi Don,
Another large question hence the quick brief answers below:
1 – We have invested in Ramsay Healthcare (RHC) previously but currently we are neutral the private hospital operator with its stock basically unchanged over the last 3-years, albeit with some swings either side of the $70 region – MM is neutral RHC hence the lack of regular coverage.
2 – Macquarie (MQG) is looking decent value compared to the other banks, especially after Westpac (WBC) cap raise and dividend cut this morning.
3 – MM has been bearish South 322 (S32) for most of its 35% correction but around todays $2.50 we are now neutral – we prefer OZ Minerals (OZL).
Ramsay Healthcare (RHC) Chart
Question 12
“Hi James and team, I've been sitting on the investment sidelines over the past few months after the enjoyable run up since last December, but always enjoy and look forward to reading your daily reports. Now I'm keen to find an entry point back in and would like to pick 5 stocks. Given your current preference for value versus growth stocks, what would you recommend, and when?” - Many thanks, James
Hi James,
That’s a very tough question especially as at MM we cannot give Personal Advice, its best answered by our market stance:
Current MM is neutral the ASX200 on a risk / reward level.
On the stock / sector level by definition we own our favoured stocks in the MM portfolios with the resources / value plays the area we have been buying recently.
ASX200 Chart
Question 13
“Hi MM, 360 Capital Digital Infrastructure Fund had an IPO last week on the ASX [asx code TDI ] with no fanfare or publicity at all. Seemed to be taken up mainly by institutions and the management company [asx TGP]. Sounds like hardware/real estate for the IT and telephony sectors and quite prospective. Any insights into this business please?” - Thank you Paul T.
Hi Paul,
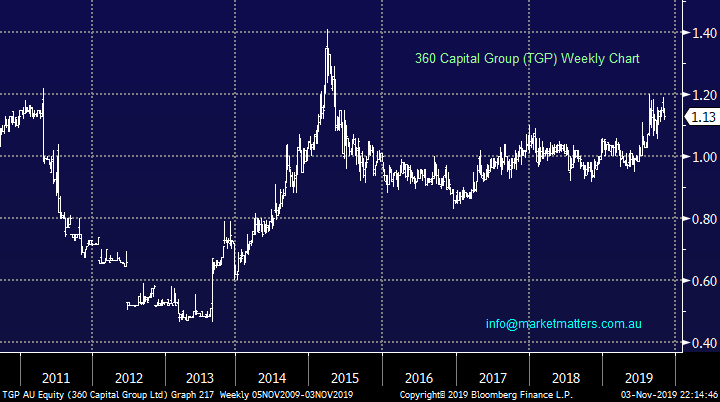
The AFR calls them ‘factories of the future’ which is probably a fairly theatrical name although there is some merit to it. Technology infrastructure is clearly a growing area and this recent IPO called 360 Capital Digital Infrastructure (TDI) has raised ~$65m at $2.00 a share to invest in digital infrastructure, like data warehouses and the like. You’re right Paul, there hasn’t been much publicity at all for this raise and listing, however it’s more of a slow burner – being a listed vehicle that invests in unlisted 360 capital funds. Shaw and Partners* was involved in the raise however you are also right in saying that it was mainly taken up by institutions, the register is actually very strong. It listed last week at $2, hardly traded and ended the week at $1.90, although very few shares are available below the $2 listing price. I like the thematic and the management are well regarded. They had no issue raising capital with the deal oversubscribed.
While its hard to be outright bullish after such a short time on the market, we are positive on the story – it should do well.
*Shaw and Partners was paid a fee for their roll as Joint Lead Manager to the raise.
Below is a chart of the head stocks – the management company that runs TDI (rather than TDO given it only listed last week)
360 Capital Group (Ltd (TGP) Chart
Overnight Market Matters Wrap
• The US equity markets hit an all-time high yet again, following strong US jobs data and Chinese manufacturing figures which allayed fears of a dramatically slowing global economy.
• Along with positive local data in the US and China, White House economic advisor, Larry Kudlow gave investors’ confidence that a US-China trade deal could be getting closer after both sides reached a consensus on principals during a phone call. He said enormous progress had been made towards a phase one agreement.
• Metals on the LME were strong, while iron ore lost gains. Crude Oil however rallied the most in six weeks indicating risk on.
• Locally, today investors will focus on the banking sector with WBC raising $2.5bn along with a $500m share purchase plan – more details to follow. Tomorrow while the race that stops the nation takes over most Australians, the RBA is expected to keep rates unchanged at the policy meeting tomorrow.
• The December SPI Futures is indicating the ASX 200 to test the 6700 level this morning, however we expect some volatilty as investors raise cash for the WBC placement raising this morning.
Have a great day!
James & the Market Matters Team
Disclosure
Market Matters may hold stocks mentioned in this report. Subscribers can view a full list of holdings on the website by clicking here. Positions are updated each Friday, or after the session when positions are traded.
Disclaimer
All figures contained from sources believed to be accurate. All prices stated are based on the last close price at the time of writing unless otherwise noted. Market Matters does not make any representation of warranty as to the accuracy of the figures or prices and disclaims any liability resulting from any inaccuracy.
Reports and other documents published on this website and email (‘Reports’) are authored by Market Matters and the reports represent the views of Market Matters. The Market Matters Report is based on technical analysis of companies, commodities and the market in general. Technical analysis focuses on interpreting charts and other data to determine what the market sentiment about a particular financial product is, or will be. Unlike fundamental analysis, it does not involve a detailed review of the company’s financial position.
The Reports contain general, as opposed to personal, advice. That means they are prepared for multiple distributions without consideration of your investment objectives, financial situation and needs (‘Personal Circumstances’). Accordingly, any advice given is not a recommendation that a particular course of action is suitable for you and the advice is therefore not to be acted on as investment advice. You must assess whether or not any advice is appropriate for your Personal Circumstances before making any investment decisions. You can either make this assessment yourself, or if you require a personal recommendation, you can seek the assistance of a financial advisor. Market Matters or its author(s) accepts no responsibility for any losses or damages resulting from decisions made from or because of information within this publication. Investing and trading in financial products are always risky, so you should do your own research before buying or selling a financial product.
The Reports are published by Market Matters in good faith based on the facts known to it at the time of their preparation and do not purport to contain all relevant information with respect to the financial products to which they relate. Although the Reports are based on information obtained from sources believed to be reliable, Market Matters does not make any representation or warranty that they are accurate, complete or up to date and Market Matters accepts no obligation to correct or update the information or opinions in the Reports. Market Matters may publish content sourced from external content providers.
If you rely on a Report, you do so at your own risk. Past performance is not an indication of future performance. Any projections are estimates only and may not be realised in the future. Except to the extent that liability under any law cannot be excluded, Market Matters disclaims liability for all loss or damage arising as a result of any opinion, advice, recommendation, representation or information expressly or impliedly published in or in relation to this report notwithstanding any error or omission including negligence.


