Subscribers questions (AXL, CGC, SIG, HSO, BLA)
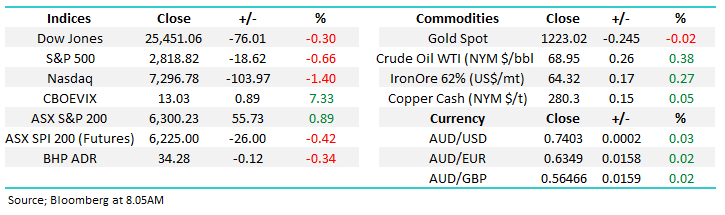
The ASX200 is set to open down around 20-points on Monday following a late sell-off in the US, a disappointing performance after some solid economic data. The tech stocks again lead the retreat with the end of week carnage in Facebook and Twitter causing the NASDAQ to close almost 3% below its all-time high – no big deal considering the 2 big name declines.
The weekend news of Labor having the upper hand over the Liberal party should be no great surprise to the market but it’s unlikely to be taken positively. Malcolm Turnbull now has until mid-May 2019 to garner further popularity to win the next election – Labor are clear favourites with the bookies at present and this cannot be good news for the market friendly tax cuts planned by the Coalition. ($1.50 v $2.40 according to sportsbet)
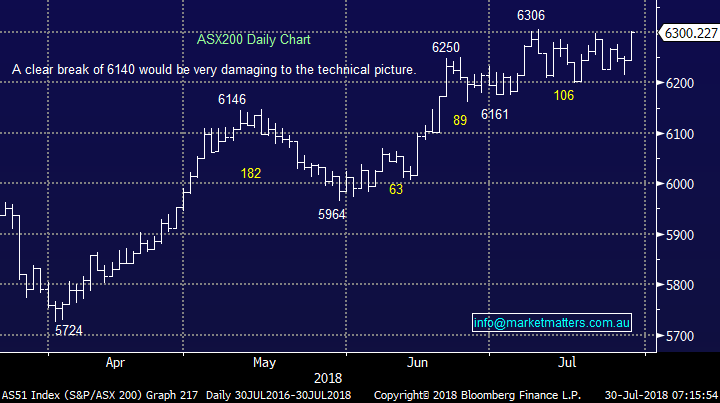
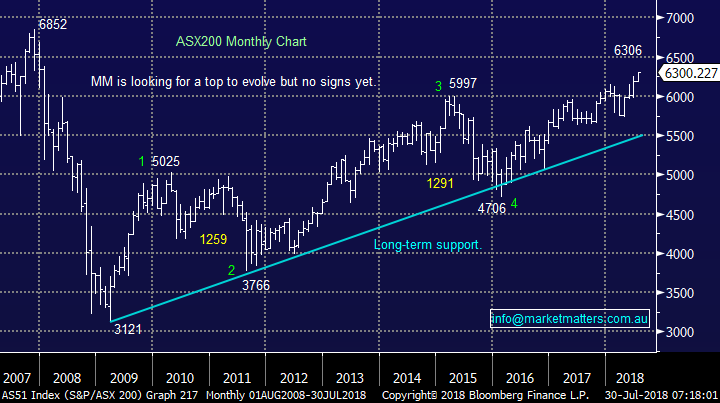
- We remain mildly short-term bullish the ASX200 while the index holds above 6250, neutral between 6250 & 6140 and bearish on a break of 6140.
The ASX200 continues to range trade between 6200 and 6300, making fresh decade highs in the process. Our preferred scenario is the market has a foray above the 6300 level before again retreating back towards 6200 but it’s all micro stuff as equities struggle to decide if they can kick on with the 9 ½ year old bull market.
Thanks again for some encouraging feedback and insightful questions, I truly feel like we are moving ahead strongly as an informed investment community, one of the objectives when MM was established.
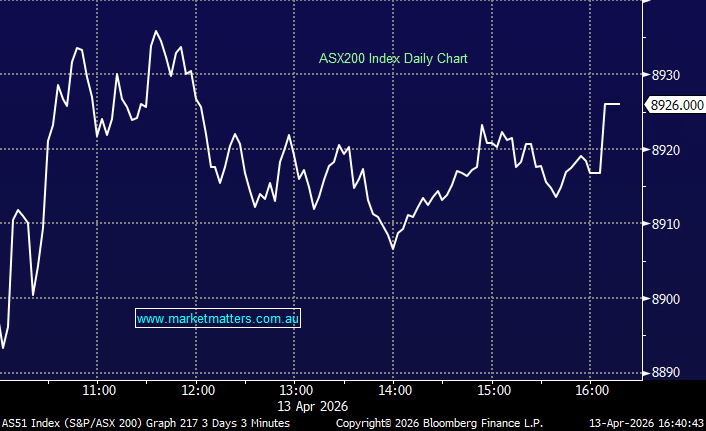
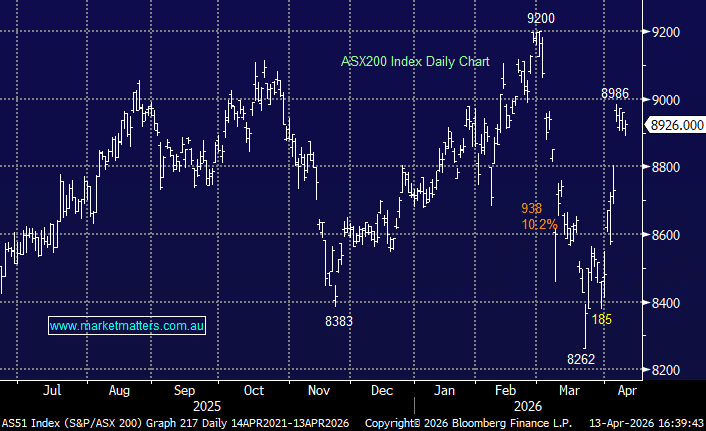
ASX200 Chart
Question 1
“Hi James, thoroughly enjoying the Market Matters material and approach to informing and educating. A question for you re the current point in the ASX cycle. I agree with the MM position that we are approaching a correction in the cycle and should be accumulating a cash position to take advantage. As an income investor this isn't quite so easy for me, and my position is complicated by having got into the banks at probably the wrong price. Currently am up 7% on ANZ, down 3% and 4% respectively on CBA and NAB. I am looking to generate cash from a partial or full sale of these names- how far do you think the banks current upward move has to go from a technical basis?” – Thanks Karl B.
Hi Karl,
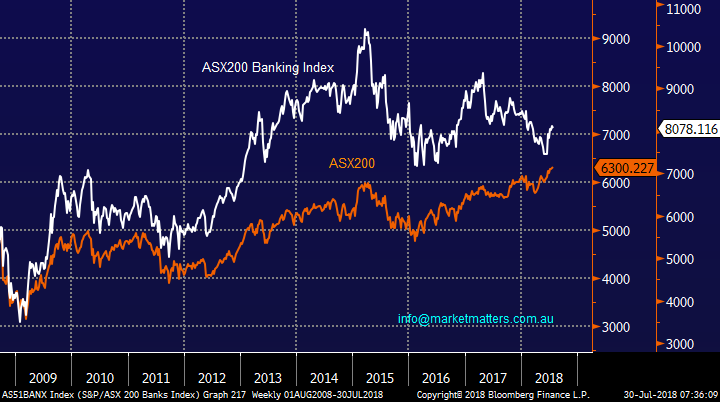
Thanks for the nice feedback, we like the position of the banks moving forward, especially on a relative basis for the next few years, firstly consider their relative performance over recent times:
- The ASX200 is making fresh decade highs while the banks are ~20% below their 2015 high.
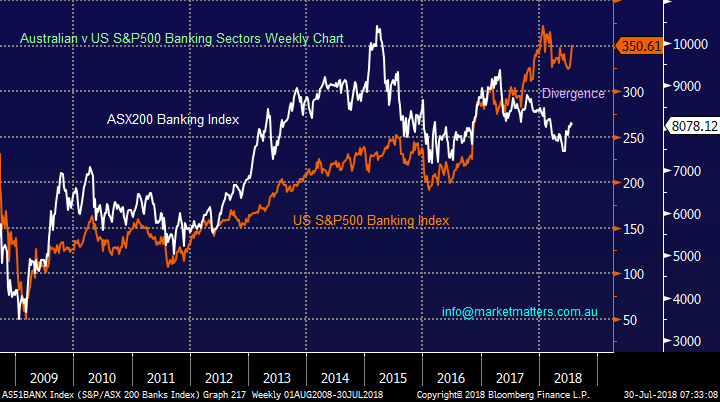
- The ASX200 banking sector has noticeably underperformed the US / global banks since mid-2017 primarily courtesy of the Hayne Royal Commission.
We feel the “bad news” is now firmly in the market, including concerns over a potential sharp property correction (bad debts), and hence the period of underperformance of the banks is likely to be behind us.
Hence at MM we are likely to maintain a decent banking exposure and hedge / offset the position via negative facing ETF’s. The most conservative of the sector – CBA is currently yielding 5.71% fully franked the yield from the banks is clearly attractive.
Another alternative is selling call options over the banks to increase yield – should you require further information about an options strategy, we can arrange this through the team at Shaw and Partners.
Moving onto your specific question of how much further the banks can bounce - obviously a lot depends on CBA’s report early next month but initial technical resistance now sits ~5% above current levels.
ASX200 Banking Index v ASX200 Index Chart
ASX200 Banking Index v US S&P500 Banking Index Chart
Question 2
“Hi James & Team Thanks for insights and informative daily reports. With the prospect of facing a period of weaker economic growth and at some point, an up-tick in inflation - please can you suggest which sectors / stocks will potentially be the winners / losers? Thanks & Regards Jan P.
Hi Jan,
We fully appreciate the positive feedback. Firstly I refer you back to the Weekend Report - point 4.
“Inflation affects equity prices in several ways. Most importantly, investors are usually willing to pay less for a certain level of earnings when inflation is high hence if rising wages pressure pushes up global inflation, likely to start in the US, then stocks may be in trouble especially if it causes interest rates to rise quicker than anticipated.
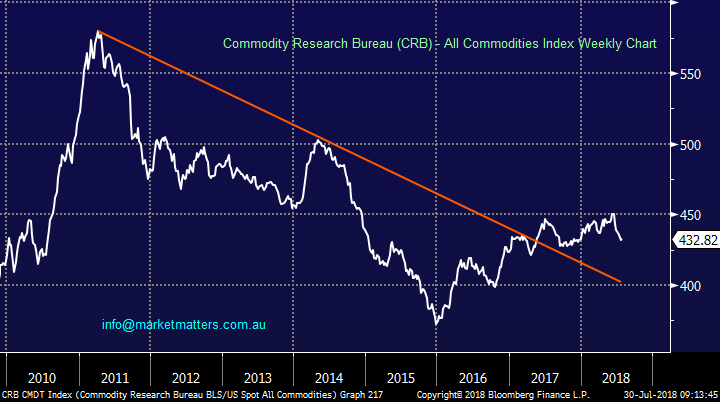
The sectors historically most vulnerable to rising bond yields are real estate investment trusts, infrastructure and utilities, and to a lesser extent the telecommunications sector. Few assets benefit from rising inflation, particularly unexpected inflation, but commodities usually do. Hence our resources sector should be a “safer” place to be invested if we see inflation accelerate, the question as always is what’s a good price to pay for the sector.”
Below is a different chart showing the long-term bullish breakout of the CRB index which has technical support coming in around 2-3% lower.
- We remain buyers of resource stocks into weakness but current levels are not offering attractive risk / reward.
CRB Index Chart
Question 3
“Hi, I note last week you bought an income stock AXLHA. I am wondering how strong the parent company [AXL] is, and how they would stand up should there be a major correction. They do seem to have a lot of debt. I am wondering if this stock falls into the Dividend Trap, that you wrote about a few weeks ago. I guess not, otherwise you would have not bought it in the first place.” - Regards John D.
Morning John, a very fair question considering our regular anecdotes around dividend traps in 2018.
For those note familiar with AXL, they provide equipment financing for business , and they’re growing strongly. The AXLHA is a Listed Bond issued to raise $55m to support further lending of equipment – and that in turn will grow earnings. A business like this does carry high debt levels, and that is shown through their debt to equity ratio greater than 4x, however as suggested in the Income Report around dividend traps, we need to understand the debt relative to the type of business that is being run, and importantly the security behind the debt.
When a financing agreement is put in place, AXL has security over the piece of equipment being financed along with additional security from the business they are lending to – like a bank has security over a person’s house but also their wider asset pool. If we compare that with a business that sells pencils for instance, and carries high debt levels to support their operations, the lenders to the pencil business only have security over the business, the pencils they hold in inventory and any value in the equipment to produce the pencils – they don’t have a wider pool of secured assets like AXL do when they provide finance.
A bond is different to a share, insofar as a company can chose whether or not to pay a dividend, while there is no choice in terms of paying a coupon on an issued bond. Failure to pay triggered a default and bond holders can take action to recover their lost income.
Below is the capital structure. For Bond Holders to lose money on this deal, the equity holders would have no value left – as in, the shares would likely be worth zero.
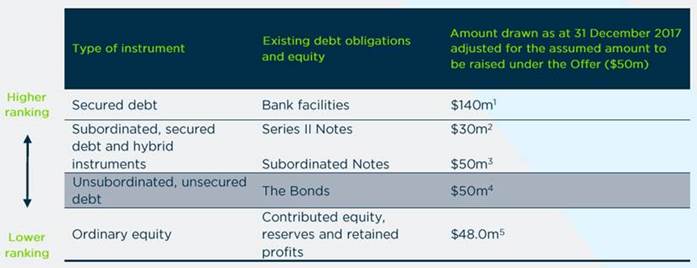
In terms of the stocks itself, we like the underlying business and believe that it can trade higher.
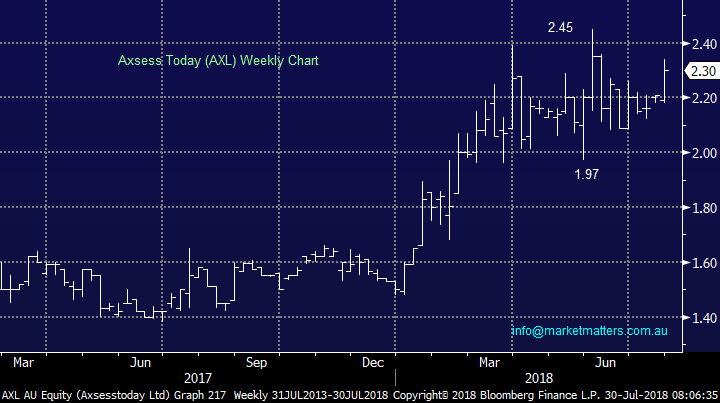
- Technically we are bullish AXL with an initial target of $2.50, or ~8% higher.
Axsess Today (AXL) Chart
Question 4
“Like your approach and I have benefited. My question is with the long-term prospect (if not medium) of company tax rates falling are there companies that are "full “of franking credits that have a history of good capital management that present an opportunity. I think of HVN (not great capital managers!) but they did a bonus dividend and share issue some years ago to release franking and it was very profitable (probably mainly for Gerry). ARB (good capital managers with bonus dividends) another example” – Philip E.
Hi Philip,
After the weekends results the press are already calling for Turnbull to rethink his tax cut plans, perhaps we may have to be patient unlike our American friends. However moving onto you question:
- BHP and RIO carry the most franking credits followed by Woodside, Woolworths and Westpac.
- Very healthy balances are also held by Caltex, Fortescue, CBA, Santos, TPG Telecom Alumina, NAB, CIMIC, Flight Centre, IAG Insurance, Transurban, REA Group and Suncorp.
No great surprises in the above but considering where we are in the economic cycle miners BHP, RIO and Alumina stand out to us.
Question 5
“Hi James, do you have any suggestion regarding medical cannabis? Just read -- An Australian company is testing whether medicinal cannabis product could be used to treat medical conditions in family pets. After a successful trial of cannabis-based medicine to help treat conditions in dogs, CannPal is now expanding its testing to cats” – Regards Richard S.
Morning Richard,
This is obviously an area we have looked at especially considering the dramatic appreciation in some stocks but it feels like a “hot space” where few will eventually become viable businesses in years to come i.e. very speculative and not for us at this point in time.
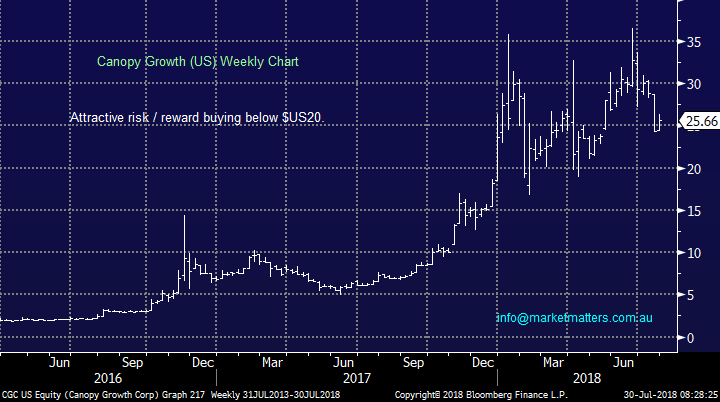
If you pinned me down to my favourite 2 stocks in the space they would be Canopy Growth (CGC) and MariMed, both in the US. The chart below of CGC illustrates the enormous volatility within the sector.
Canopy Growth (US) Chart
Question 6
“Hi James, I note there seems to be two Tickers for Aust 200: XJO and XAT. Could you explain the difference? When you state that you are “neutral the ASX 200”, I think you would be referring to the XJO.” – Thanks Peter M.
Morning Peter,
You are correct we look at the ASX200 (XJO ticker) which is what 99% of market players watch day to day.
Both indices are basically the same thing with a slight variation to methods of calculation because the XAT strips out companies domiciled overseas, arguably a better representation of Australia.
However the industry uses the ASX200 (XJO) as its standard benchmark making it in my opinion the index to focus on.
ASX200 Chart
Question 7
“Hi James, do you have a current opinion or comments on SIG now that they’ve fallen so much?” – Thanks Peter M.
Hi Peter, thanks for 2 questions for the week, they’re always appreciated.
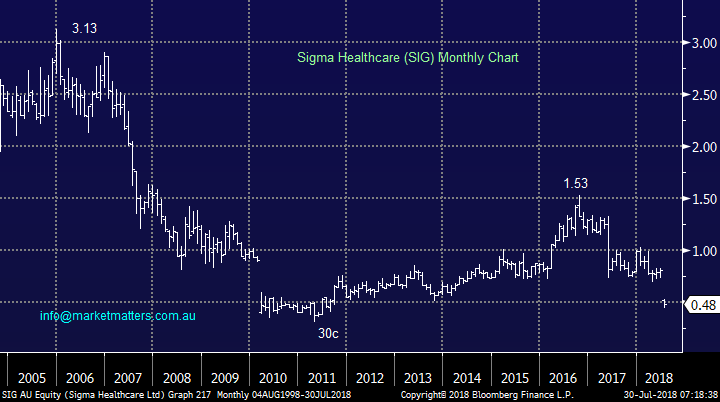
Your certainly correct SIG has endured an awful decade to become a “penny dreadful” that we find hard to classify as investment grade – it’s a trading vehicle.
The pharmaceutical distribution business SIG crashed 40% earlier in the month because they announced it won’t renew its wholesale supply contract with the Chemist Warehouse Group – another nail in the coffin?
If we were was considering an outright “punt” in SIG at this stage it would only be below its 30c low of 2011 using close stops.
Sigma Healthcare (SIG) Chart
Question 8
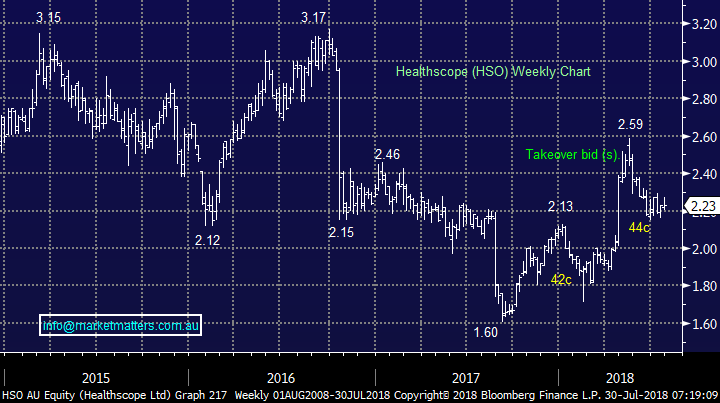
“Hi James, at the end of trading today (26/07) I noticed a very large number of HSO shares appear to trade aftermarket close (approx. 1 million). I use the "detailed quote" screen to gauge the depth of interest and trade price. At the close the detailed quote screen was full of low priced offers that were not previously there during trading hours. The sellers offer ranged between $2.04 and $2.23 - yet the daily trade range was a low of $2.23 and a high of $2.25. A few minutes later these low-priced offers were gone along with their volumes?? Who dun nit and how can we get in on this action?” - Cheers, Jan.
Hi Jan,
Two potential answers to your question depending on what you were referring to. Market participants can ‘cross stock’ after market if the value of the line is above a certain amount – usually the $1m mark however it varies depending on the group the particular stock falls into on the ASX. The crossing is at an agreed price between two brokers usually on behalf of a client (or various clients). The volume of small orders are probably computers that play around with small volumes finding arbitrage opportunities and the like.
However you may have been referring to the to the “match” when orders are entered into the market between 4pm and 410pm with one final large trade as all buyers / sellers that are within market trade e.g. if you offered at $2.05 and the match was at $2.23 your selling would be filled at $2.23 but if you tried to sell at $2.24 you would not be filled and vice versa with buyers– the final matching price is determined by the weight of orders at 410pm, just like the opening print at the start of the day.
Healthscope (HSO) Chart
Question 9
“Blue Sky BLA do you have any thoughts on this company” – John B.
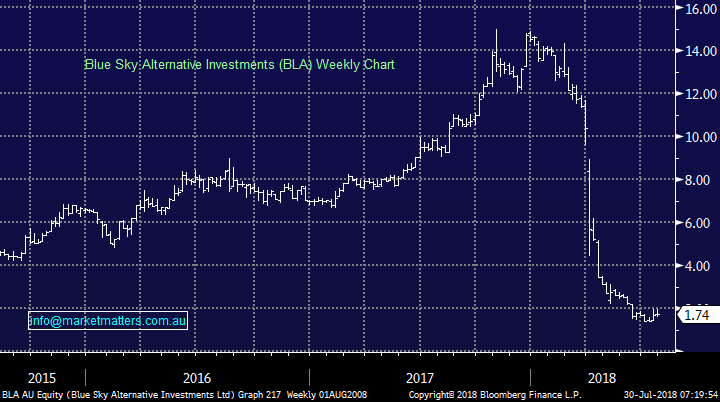
Hi John, that makes 2 questions on BLA in consecutive weeks, perhaps it’s about to become a volatile trading vehicle after its 90% capitulation in 2018.
There has been talk of venture capitalists recently “sniffing around” BLA and we can easily see a decent bounce from current levels but please remember the trend is aggressively down and the stock looks much more like a trade than an investment.
Blue Sky Alternative Investments (BLA) Chart
Question 10
"Hi, where on your webpage do I find the holdings and info on the Growth Portfolio? What is the strategy you have been following in the past and now?” - Reeta R.
Hi Reeta,
We follow a combination of fundamental and technical analysis that produces a more active approach, a read of the last few weekend reports should give you a solid understanding. In terms of the website, you can view the portfolios by clicking here, however you can drill down into all past calls in the past alerts screen and the recent activity screen which will give you a better background to our approach .
Overnight Market Matters Wrap
- The US tech sector took another hit on Friday night after social media stock Twitter followed in the wake of Facebook and disappointed with their quarterly update, leading to a similar 20% thumping in the share price.
- Intel also slumped 8.5%, despite meeting earnings expectations, after it warned of delays to its next generation of chips. Twitter’s selloff was driven by a 1m drop in monthly active users, to 335m, partially the result of the company cleaning up fake accounts, as well as the company forecasting its next quarterly earnings to be below market expectations.
- This led to a broader selloff across the technology sector, taking the tech heavy Nasdaq another 1.5% lower, having hit record highs earlier in the week. The Dow and S&P 500 were less affected, dropping only 0.3% and 0.6% respectively, with the selloff confined largely to tech stocks.. The good news was the US economy posted its strongest GDP number for 4 years, at 4.1% for the second quarter. And the broader earnings picture is still very buoyant with 50% of companies having reported, and nearly 80% of those exceeding expectations.
- Locally the market, which hit a ten year high on Friday with the ASX 200 topping 6300, is set to open slightly weaker, with the futures pointing to a fall of about 0.4%. Key commodities were mixed, with oil falling 1%, iron ore rising 1.8% and base metals steady. BHP traded 1.4% firmer in US trading, as investors supported the US$10.8bn shale oil sale, while Rio was slightly weaker. The A$ is trading at around US74c.
Have a great day!
James & the Market Matters Team
Disclosure
Market Matters may hold stocks mentioned in this report. Subscribers can view a full list of holdings on the website by clicking here. Positions are updated each Friday, or after the session when positions are traded.
Disclaimer
All figures contained from sources believed to be accurate. Market Matters does not make any representation of warranty as to the accuracy of the figures and disclaims any liability resulting from any inaccuracy. Prices as at 30/07/2018
Reports and other documents published on this website and email (‘Reports’) are authored by Market Matters and the reports represent the views of Market Matters. The MarketMatters Report is based on technical analysis of companies, commodities and the market in general. Technical analysis focuses on interpreting charts and other data to determine what the market sentiment about a particular financial product is, or will be. Unlike fundamental analysis, it does not involve a detailed review of the company’s financial position.
The Reports contain general, as opposed to personal, advice. That means they are prepared for multiple distributions without consideration of your investment objectives, financial situation and needs (‘Personal Circumstances’). Accordingly, any advice given is not a recommendation that a particular course of action is suitable for you and the advice is therefore not to be acted on as investment advice. You must assess whether or not any advice is appropriate for your Personal Circumstances before making any investment decisions. You can either make this assessment yourself, or if you require a personal recommendation, you can seek the assistance of a financial advisor. Market Matters or its author(s) accepts no responsibility for any losses or damages resulting from decisions made from or because of information within this publication. Investing and trading in financial products are always risky, so you should do your own research before buying or selling a financial product.
The Reports are published by Market Matters in good faith based on the facts known to it at the time of their preparation and do not purport to contain all relevant information with respect to the financial products to which they relate. Although the Reports are based on information obtained from sources believed to be reliable, Market Matters does not make any representation or warranty that they are accurate, complete or up to date and Market Matters accepts no obligation to correct or update the information or opinions in the Reports. Market Matters may publish content sourced from external content providers.
If you rely on a Report, you do so at your own risk. Past performance is not an indication of future performance. Any projections are estimates only and may not be realised in the future. Except to the extent that liability under any law cannot be excluded, Market Matters disclaims liability for all loss or damage arising as a result of any opinion, advice, recommendation, representation or information expressly or impliedly published in or in relation to this report notwithstanding any error or omission including negligence.
To unsubscribe. Click Here