Subscriber’s Questions (ASX, BIN, CWY, BHP, CBA USD, YANK, DDR, VHT, TLS, VOC, WBC, QBE)
Happy Monday everybody from a very wet Sydney, a joyous reprieve has finally arrived for many farmers on our Eastern seaboard, let’s hope we see some sustained falls.
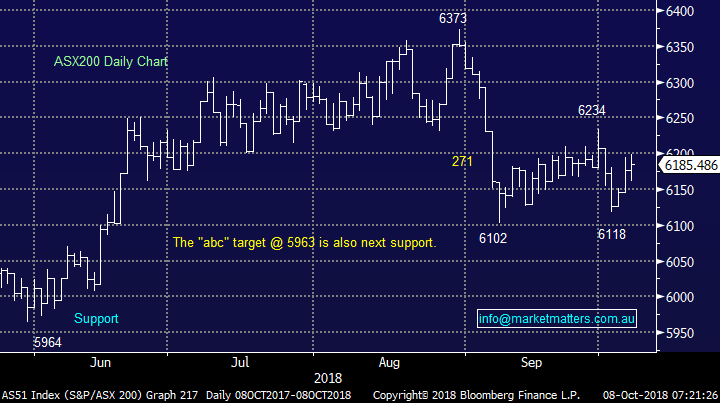
The SPI futures closed on Saturday morning pointing to the ASX200 opening down around 30-points on Monday, with an almost 2% drop in BHP likely to lead the losses from a points perspective. The resources have been the backbone of the local market over the last month, if they are going to at least “wobble” the index can easily break down from its 22-day tight trading range.
Similar to previous weeks the news to kick off Monday is predominantly China facing as the world’s second largest economy returns from its Golden Week holiday.
1 – China’s central bank has cut the amount of cash lenders must hold as reserves for the 4th time this year as their economy struggles in a worsening trade war.
2 – The spying allegations by the US against China via computer chips is gaining momentum and cannot be good for the trade war, as we read on Bloomberg – “The Big Hack has Big Implications”.
3 – China’s foreign reserves fell marginally in September to $3.087bn but further strength in the $US may pressure China into defending the Yuan and using up their reserves in the process.
4 – China’s investment into Australia has collapsed over 40% in the last 12-months, double that of the average decline worldwide.
5 – China has confirmed the missing Interpol President has been detained and is under “suspicion of violating the law”.
Overall a slowing and embattled Chinese economy / social backdrop is especially bad news for Australia and especially our resource stocks, as covered in the Weekend Report a decent correction in the sector feels a strong possibility.
- We remain negative the ASX200 initially looking for break below 6000, around -3% lower.
Thanks again for some more great questions, the couple we’ve had over recent weeks around ETF’s have been particularly encouraging demonstrating that subscribers are giving our reports serious thoughts / consideration within their investment framework.
ASX200 Chart
Question 1
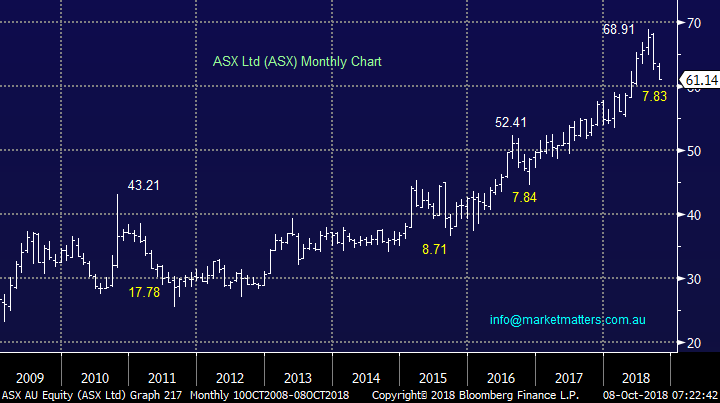
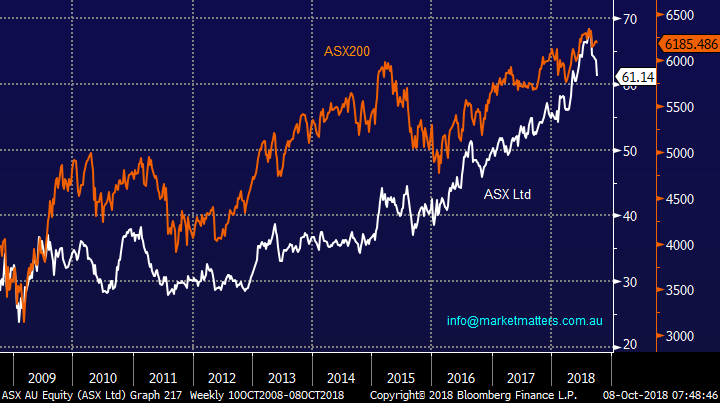
“Hello James, A question for Monday re ASX. If my memory serves me correctly, there is a reasonable correlation between the fortunes of this stock and the fortunes of the overall market. Given the market is running out of gas is ASX not likely to follow suit? In fact, has that trend begun?” - Best regards, Ron O.
Hi Ron,
You are correct, the correlation between the ASX200 and ASX Ltd (ASX) is pretty good. However our preferred scenario is while global stocks are indeed feeling tired they will recover from the current relatively small weakness and make a more meaningful top in 2019.
Hence we are looking to take a position in ASX if / when it has a correction to the $60 area, i.e. ~13%. We are looking for 15-20% upside from this region.
MM is a buyer of ASX Ltd (ASX) around the $60 area.
Subscribers should remember in the Growth Portfolio we currently hold 13% in pure $A cash, 3% in $US, 5% effectively short the ASX200 plus 5% short the S&P500 via a leveraged ETF – hence we are net very underweight stocks looking for a pullback to reposition our investments.
ASX Ltd (ASX) Chart
ASX Ltd (ASX) v ASX200 Chart
Question 2
“Greetings MM Team, Bingo Industries was belted up during the week, without any significant news flows? Any thoughts as to why this was out of favour, and do you guys have a more longer-term view on this company?” – Regards Scott T.
Hi Scott,
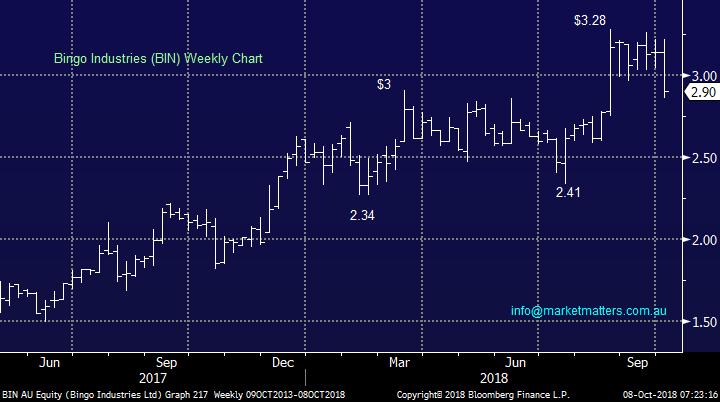
Bingo Industries (BIN) operates a waste management and recycling company with skip bins, trucks, private land fill sites etc. – the bright orange trucks and bines running around town, certainly a business we like given strong growth prospects largely through continuing infrastructure build in Australia – an area they focus on. The company only listed in mid-2017 and now has a market cap of $1.69bn trading on an est. P/E of 23.77x 2019 earnings, while yielding around 1% fully franked.
The shares rallied strongly back in July as it was announced that the company would remain a family controlled business with the Tartak family, holding ~30% of the business i.e. their holding is now out of escrow, so could theoretically be sold. They also made a company changing acquisition buying Dial-a-Dump for $577.5m and have subsequently raised capital to pay for it. There are some regulatory changes playing out at the moment and they also missed analysts guidance for growth expectations in FY19, so a few things bubbling away and combined they could explain the reason for some short term weakness.
The company is clearly a growth business with several tailwinds including massive infrastructure pipeline, a shift from landfill to recycling, and they are likely to receive the approval for a large landfill site in Sydney at a time when QLD are likely to implement higher levies to stop waste being trucked across the border.
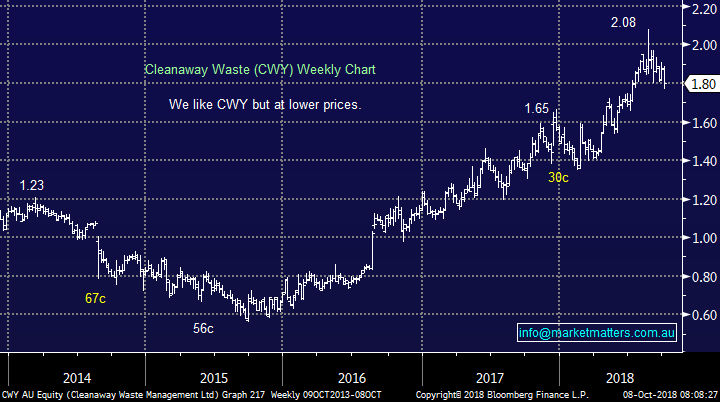
Similar to sector rival Cleanaway (CWY) Bingo’s shares have enjoyed a strong 12-months overall.
We like BIN longer term, but currently like CWY, at lower levels.
Bingo Industries (BIN) Chart
Cleanaway Waste Management (CWY) Chart
Question 3
“G ‘Day again, it confuses me a bit that you are buying stocks like ALL and a few others at the same time you are repeating ad nauseum that you expect the market to fall. I suppose it must necessarily follow that you do not expect ALL etc to take a fall when this happens. I feel you are most probably correct in your prophecy ...... but why not wait until then to buy???” - Waz
Hi Waz,
Thanks for the vote of confidence in our “prophecy”. Firstly, as I mentioned above we are still effectively holding close to 30% in our Growth Portfolio hence any small purchases over recent months have not altered our net very underweight market stance / exposure.
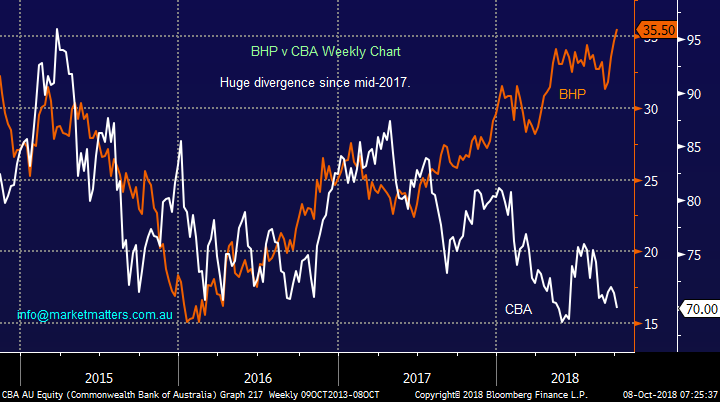
Secondly, as we all know not all stocks / sectors move together as the below chart of Australia’s largest 2 companies illustrates perfectly i.e. BHP v CBA. Similarly plenty of stocks do go up in a falling market, but we simply need to be more vigilant. Year to date the ASX200 is up 2% while Commonwealth Bank (CBA) is down -12.9% but BHP is up +20%.
MM is looking to buy fairly aggressively into weakness over coming weeks, but we reiterate we believe the current bull market is a mature one and purchases are unlikely to be held for more than 6-months.
BHP Billiton (BHP) v Commonwealth Bank (CBA) Chart
Question 4
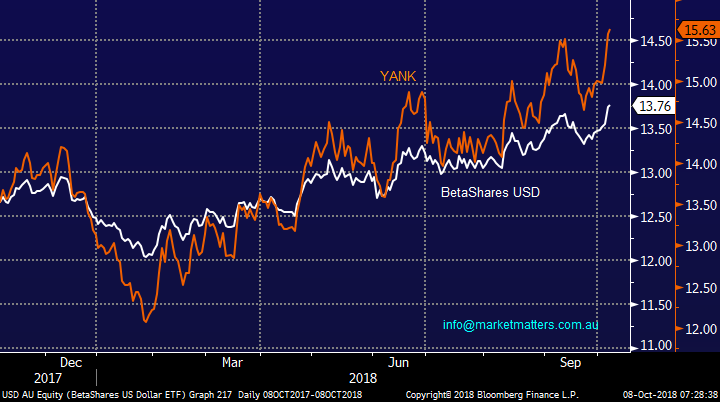
“Is there any particular reason to prefer USD over YANK for Shorting the $AU.? From a brief observation it appears YANK is more responsive to fluctuations and with a far better Dividend - 2.88% vs .78%” - Regards – Michael B.
Hi Michael,
Thanks for the great question, as subscribers know we are now playing some macro market views via ETF’s hence its important that they are fully understood. There is essentially no difference between the currency two ETF’s except YANK is leveraged, the below chart illustrates the extremely close correlation between the two. A leverage position all things being equal creates a higher risk exposure.
If we had been tight on the cash front, we may well have taken a position in the YANK as opposed to the USD.
BetaShares USD v YANK ETF’s Chart
Question 5
“Hi James, Normally I stay away from Small Caps but I'm thinking of adding one to the portfolio. The two which interest me are Dicker Data and Volpara Health Tech. Do you cover these stocks, if so, what are your views?” – John S.
Hi Peter,
We do not cover these 2 stocks in much detail, but are happy to offer a quick technical opinion.
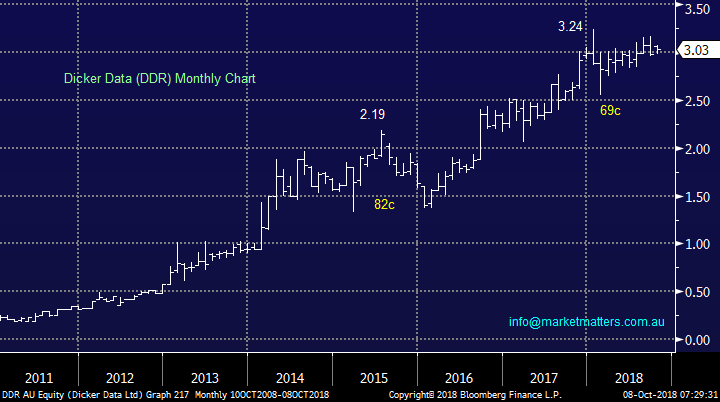
DDR only traded ~72,000 shares on Friday showing why it’s very hard for MM to invest with quantifiable risk / reward i.e. it’s simply too thin.
Technically we are bullish targeting DDR $3.40-$3.50 but would watch the price action closely if these new highs do eventuate.
Dicker Data (DDR) Chart
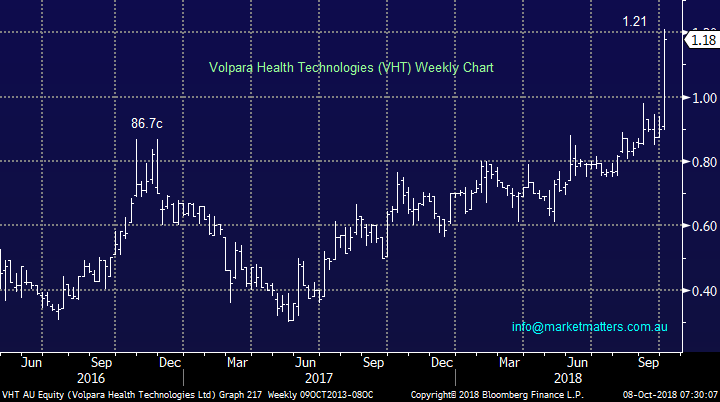
Volpara Health Technologies (VHT) is a breast imaging analytics / analysis software specialist. Recently it received US clearance for technologies used in Volpara Enterprise software which should assist the company grow its share in the US.
It feels like this question is being answered a touch late after last week’s +20% surge.
VHT looks bullish with stops below 98c, unfortunately not great risk / reward.
Volpara Health Technologies (VHT) Chart
Question 6
“Hi Guys, would it be possible to include in Monday's Q&A's an analysis between Telstra (TLS) and Vocus (VOC). VOC was lagging more than .30c on TLS but has recently overtaken it while TLS seemed to trade sideways and stall.” – Thanks Manny W.
Hi Manny,
Its probably easier if we look at these 2 businesses separately even though they have both enjoyed a degree of return to favour by the Telco sector since the announced merger between Vodafone and TPG Telecom (TPM).
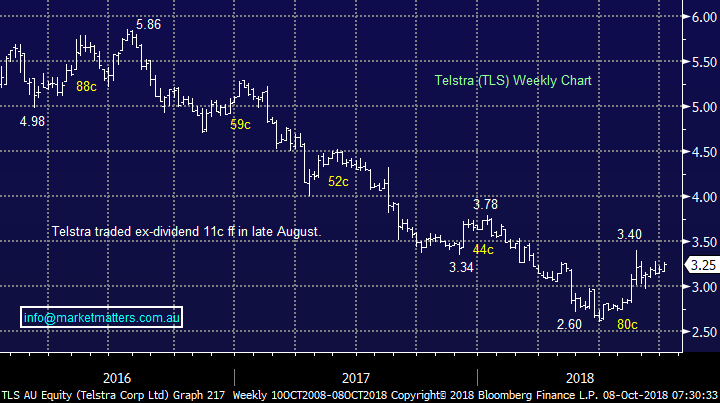
We hold Telstra (TLS) in our Growth Portfolio and unlike many, are finally showing a profit on our holding, albeit only ~4%.
The negative sentiment towards both TLS and the whole sector was way too stretched earlier this year, but the 30% bounce has certainly addressed this issue. The next big hurdle for the shares will be when the company announces its update to the dividend policy into 2019 – a too severe cut may easily see a retest of the $3 region, or 10% lower.
We remain bullish TLS at current levels but are likely to reduce our holding in the $3.50 region.
Telstra (TLS) Chart
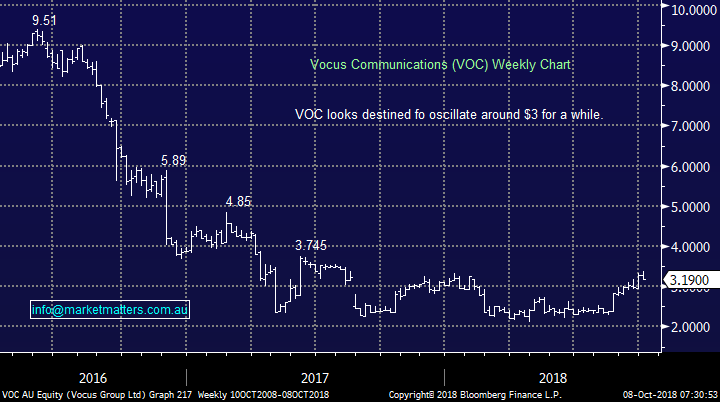
We believe VOC is more of a trading stock within the Telco until the beset telco can demonstrate some solid long term recovery prospects – and sort out its balance sheet. Further strength and I would not be surprised to see them raise capital.
VOC remains one of the most shorted stocks on the ASX (18th) with over 8% of its shares sold short – the professionals are betting against any short term recovery.
We’ve seen broker upgrades and downgrades over the last few weeks which has led to increased volatility in the stock – good for the traders.
MM likes VOC as a trade around $2.90.
Vocus (VOC) Chart
Question 7
“Dear James, I wonder if you could discuss where you think the Banks esp. Cwlth are heading in the next few months” - Many thanks Eileen J.
Hi Eileen,
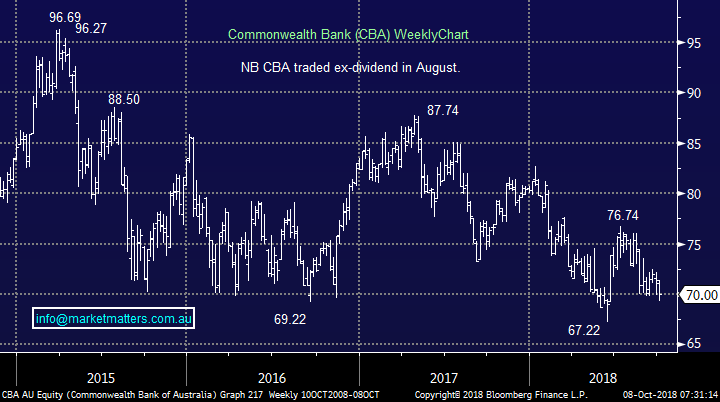
We see the banks remaining under a degree of pressure until the dust settles from the Hayne Royal Commission, but we believe the real damage is behind us.
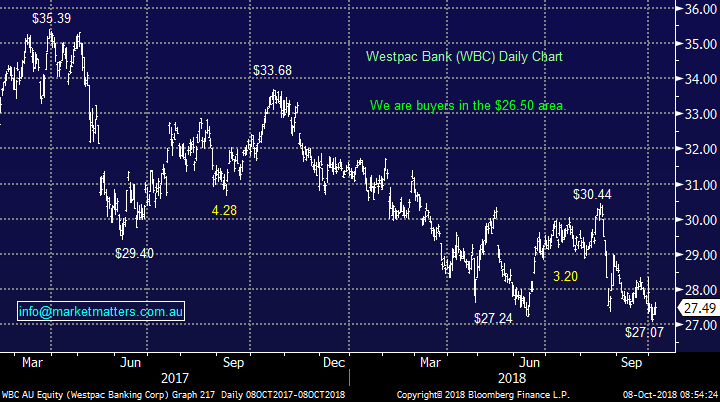
We are buyers of the banks into fresh 2018 lows e.g. Westpac (WBC) around $26.50.
Conversely, we would consider writing calls into strength for the sophisticated investor – please contact me directly if you would like this explained further.
Hence for CBA, we envisage a trading range of $66 to $76 for the next 6-12 months.
Commonwealth Bank (CBA) Chart
Westpac Bank (WBC) Chart
Question 8
“Thanks for all your advice. Just a quick one, where do you see QBE and Telstra rising to given their current steady increase?” - Mike D.
Hi Mike,
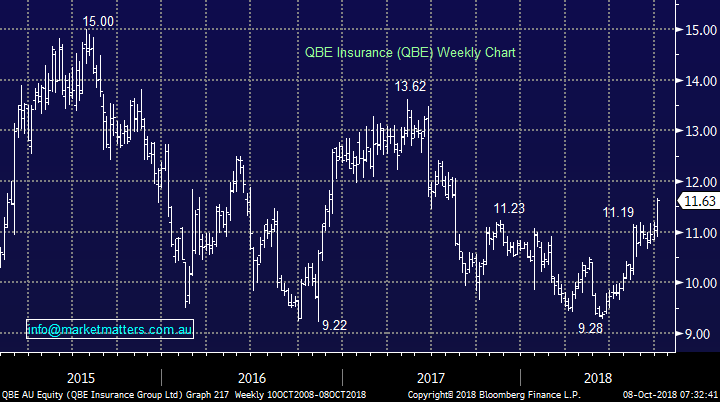
I have covered TLS earlier so I have just updated our view on QBE here. QBE has 3 large things going for it at present and one large negative:
Positives - The market has been negative and feels underweight, US bond yields are rising and the $A is falling.
Negative – The company keeps disappointing the market, although new management / leadership are turning the ship around
MM remains long QBE at present, with an initial $13 target. On balance, we believe the tailwinds for the business are large enough to make this a realistic call.
QBE Insurance (QBE) Chart
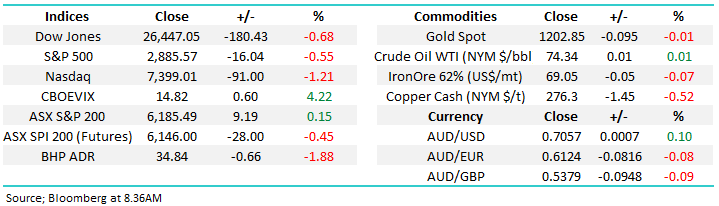
Overnight Market Matters Wrap
· The US equity markets finished the week on a low note as continuing concerns on increasing interest rates weighed on sentiment, with the latest employment data helping bonds hit fresh highs, and the technology sector in particular under pressure.
· The US economy added 134,000 new jobs in September, below expectations of 185,000. However, unemployment hit its lowest level in almost 50 years. August employment numbers were also revised strongly upwards from 201,000 to 270,000 and wage inflation came in at 2.8% stoking further fuel on the rate fire. US ten year bonds hit a fresh 7 year high of 3.24% and 2 year rates hit 2.9%.
· The tech heavy Nasdaq 100 was the major, while t broader S&P500 and the Dow also saw their worst early, but not as extreme as the Nasdaq.
· Resource stocks are expected to underperform in our domestic market, with BHP in the US ending its session down an equivalent of -1.88% from Australia’s previous close.
· Copper and aluminium led the base metals lower, while oil was steady and gold stronger. The Aussie battler, AUD is slightly weaker at US70.5c this morning after last week’s sell off which saw it back at 3 year lows, down nearly 10% for the 2019.
· The December SPI Futures is indicating the ASX 200 to open 27 points lower this morning, towards the 6160 level.
Have a great day!
James & the Market Matters Team
Disclosure
Market Matters may hold stocks mentioned in this report. Subscribers can view a full list of holdings on the website by clicking here. Positions are updated each Friday, or after the session when positions are traded.
Disclaimer
All figures contained from sources believed to be accurate. Market Matters does not make any representation of warranty as to the accuracy of the figures and disclaims any liability resulting from any inaccuracy. Prices as at 08/10/2018
Reports and other documents published on this website and email (‘Reports’) are authored by Market Matters and the reports represent the views of Market Matters. The MarketMatters Report is based on technical analysis of companies, commodities and the market in general. Technical analysis focuses on interpreting charts and other data to determine what the market sentiment about a particular financial product is, or will be. Unlike fundamental analysis, it does not involve a detailed review of the company’s financial position.
The Reports contain general, as opposed to personal, advice. That means they are prepared for multiple distributions without consideration of your investment objectives, financial situation and needs (‘Personal Circumstances’). Accordingly, any advice given is not a recommendation that a particular course of action is suitable for you and the advice is therefore not to be acted on as investment advice. You must assess whether or not any advice is appropriate for your Personal Circumstances before making any investment decisions. You can either make this assessment yourself, or if you require a personal recommendation, you can seek the assistance of a financial advisor. Market Matters or its author(s) accepts no responsibility for any losses or damages resulting from decisions made from or because of information within this publication. Investing and trading in financial products are always risky, so you should do your own research before buying or selling a financial product.
The Reports are published by Market Matters in good faith based on the facts known to it at the time of their preparation and do not purport to contain all relevant information with respect to the financial products to which they relate. Although the Reports are based on information obtained from sources believed to be reliable, Market Matters does not make any representation or warranty that they are accurate, complete or up to date and Market Matters accepts no obligation to correct or update the information or opinions in the Reports. Market Matters may publish content sourced from external content providers.
If you rely on a Report, you do so at your own risk. Past performance is not an indication of future performance. Any projections are estimates only and may not be realised in the future. Except to the extent that liability under any law cannot be excluded, Market Matters disclaims liability for all loss or damage arising as a result of any opinion, advice, recommendation, representation or information expressly or impliedly published in or in relation to this report notwithstanding any error or omission including negligence.


