Subscriber’s Questions (ANZ, APX, CBA, GCI, ILU, MXT, NBI)
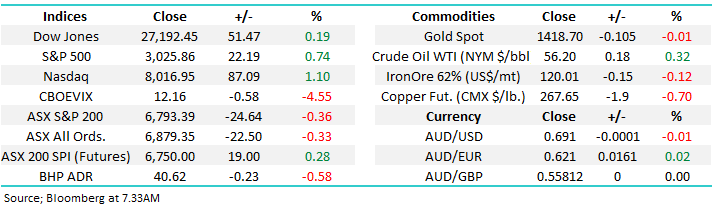
Over the weekend, the news was relatively light but the bias continued to be net positive – US stocks rallied Friday night / Saturday morning, both property prices & clearance rates continue to improve plus of course the Fed is expected to cut rates by at least 0.25% this week. On the other side of the ledger we continue to see public unrest on the streets in Hong Kong, no major surprise considering the differing lifestyles between Hong Kong & China. The SPI futures are calling the ASX200 to open ~6820, less than 0.5% below its all-time high and it feels almost foolhardy, considering the broad based buying and upside momentum, not to expect a break of this milestone in the coming weeks.
BHP closed down 0.6% in the US implying the Resources sector is likely to start the week on the back foot, as we discussed in the Weekend Report MM sees no reason to press the “buy button” with this sector too quickly. However while it feels like this week will be much of the same when it comes to stock, sector and index performance we are mindful of the news hitting our market over the next few weeks, starting with the Fed before moving into our volatile reporting season – certainly enough market information to dampen, or indeed switch up the market sentiment.
No sell signals have been generated but our “Gut Feel” is the market should struggle to meaningfully punch through the 6850-6900 area.
Thanks as always for the questions which saw the anticipated pick up in volume as school holidays ended plus of course the market is making fresh decade highs.
One thing catching my mind from reading todays selection of questions is investors most definitely don’t appear to be complacently long stocks, the usual characteristic of a market top. Also when I see any new issues across my desk, like the placement in Abacus Property (ABP) last week that was 10x oversubscribed + of course the current demand we are seeing for hybrid issuances, it still feels like the average Australian retail investor is only just starting to move up the investments risk curve in an effort to achieve some yield on funds.
ASX200 Index Chart
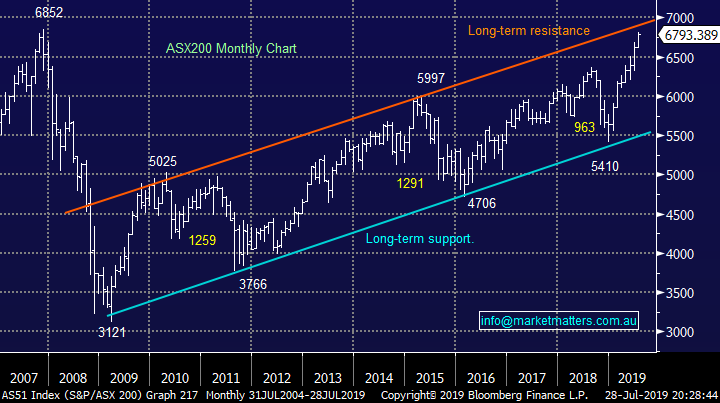
Donald Trump is becoming very vocal around his increasing frustration with the Fed and their comparatively high interest rate policy. The chart below illustrates that US 10-year bond yields are significantly above our own, actually for the first time in decades. Hence the $A has been driven down below 70c against the greenback as holding the $US simply pays more interest. A strong currency is an obvious disadvantage for exporters as it makes products more expensive and hence less competitive.
Conversely the strong $US has been a huge tailwind for many companies within the ASX200 who enjoy revenue from the US i.e. the same income is worth almost 40% more when converted to $A than in say 2011.
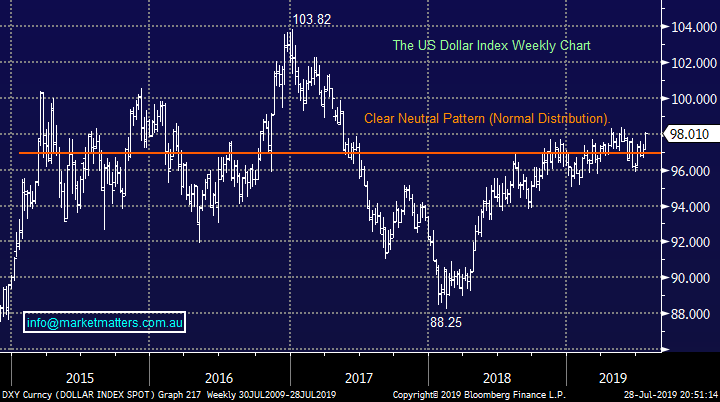
The $US Index Chart
Hence President Trump is now considering “manipulating the $US lower”, he’s got a point with Germany hiding behind the Euro and the follies of China and their Yuan, the US would just be joining a game already played by others. However the $US is the world’s reserve currency hence “pushing it around” carries with it more global ramifications.
We feel its another example of Trump posturing and he wants the Fed to cut interest rates hard and fast.
NB Interestingly the $US against a basket of currencies has gone almost nowhere for approaching 5-years implying the “strong $US” is more of a political football than fact.
The $US Index Chart
Question 1
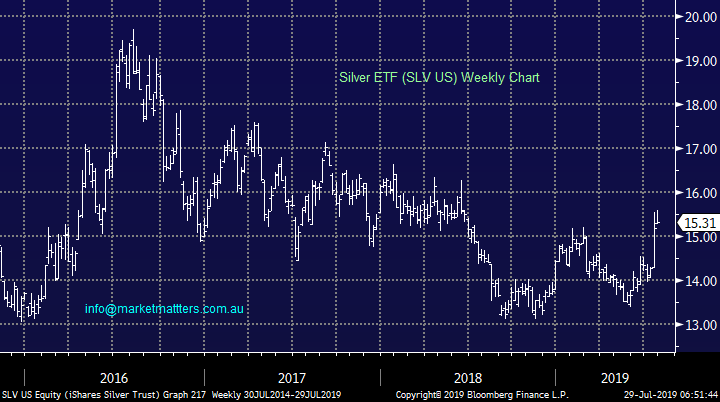
“What are your feelings regarding silver, how do we participate in the price rise on the ASX.” – Thanks Daniel C.
Morning Daniel,
Silver’s 18% rally from its 2018 low is not far behind golds 22% advance over the same period although it certainly hasn’t garnered the same attention. Historically gold and silver move in tandem with gold tending to lead while silver rises / falls more aggressively.
Hence considering our bullish outlook on gold a silver play certainly has merit. On the Australian bourse gaining silver exposure is significantly tougher than with gold where quality stocks abound hence we are inclined to consider ETF’s when thinking of silver. The largest silver ETF is iShares Silver Trust (SLV US) listed in the US which has almost $US6bn in assets i.e. KISS and go with the biggest: https://www.ishares.com/us/products/239855/ishares-silver-trust-fund.
MM is bullish the SLV ETF while its above 14.50 but we do prefer gold and its alternatives at this point in time.
Silver ETF (SLV US) Chart
Question 2
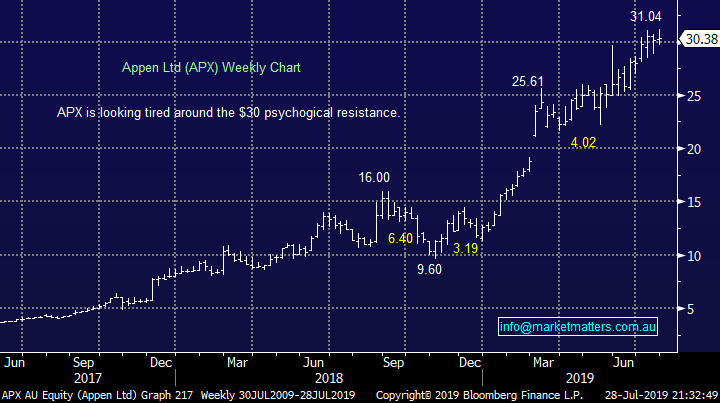
“Still holding APX. Which is going gang busters. Are we continuing to hold this stock for some time? What value are we targeting?” – Michael S.
Hi Michael,
You have outplayed us on this one! While MM bought ALX perfectly in late 2018 we underestimated the potential P/E expansion of this machine learning and AI business hence we took our $$ too quickly in hindsight– it’s certainly an extremely hot sector at present.
With comparative valuations out of the window we revert to technicals with volatile high value stocks like APX – its already experienced 3 pullbacks of 15-40% over the last 12-months.
MM likes while it can hold above $29.50 but another 15-20% pullback feels close at hand.
Appen Ltd (APX) Chart
Question 3
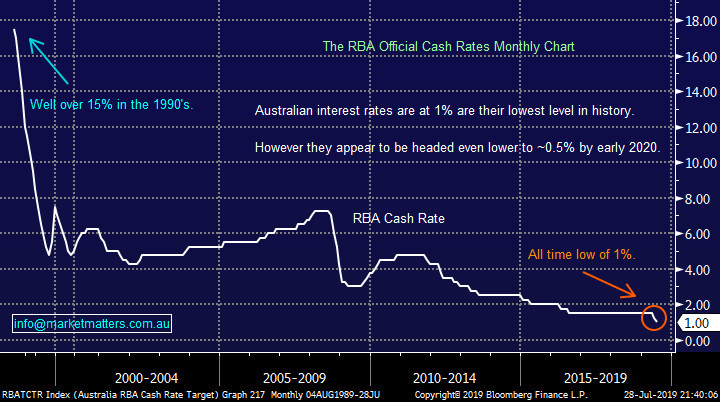
“Hi Team, a quick one. I want to park some cash for a period, where can I go to evaluate the alternatives with respect to Hybrid’s ; i.e. is there an evaluation list someplace.” - Thanks Geoff S.
“Weekly subscriber question Hi guys, with moving to more cash, do you have a suggestion on somewhere to 'park' to money while in cash. Regards, Glenn H.
Morning Lads,
For a full list of hybrids, here is a rate sheet from Shaw and Partners which covers the universe of listed hybrids. Download rate sheet – CLICK HERE
Excuse the plug but our MM Income SMA : https://www.marketmatters.com.au/news/sma/, has a mix of stocks and income investments like hybrids that have lower volatility and higher yield than the underlying market. The portfolio returned +10.16% in FY19 versus its benchmark of RBA +4% . Obviously by definition we hold our preferred hybrids in this Portfolio. (BTW, I do intend to review our hybrids in this weeks income note on Wednesday )
We would be delighted to send through some more details on our SMA’s, just drop an me an email to : [email protected]
By way of reminder, we only provide general advice.
The RBA Cash Rate Chart
Question 4
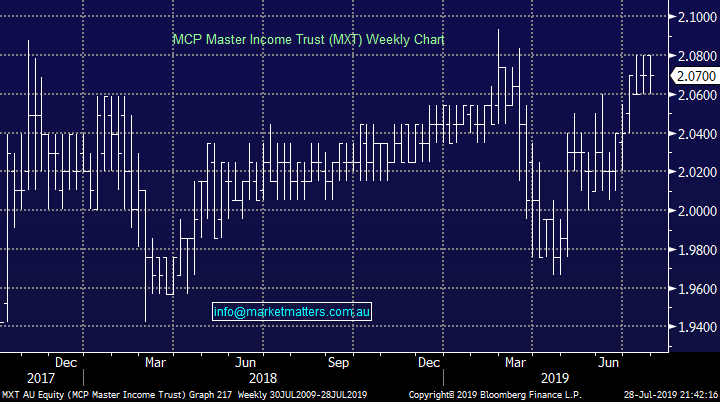
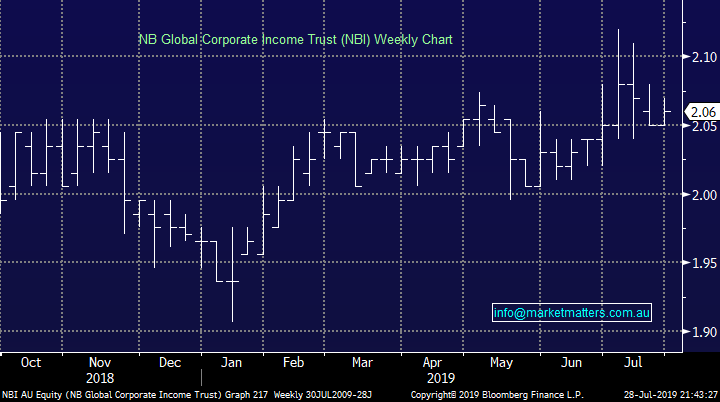
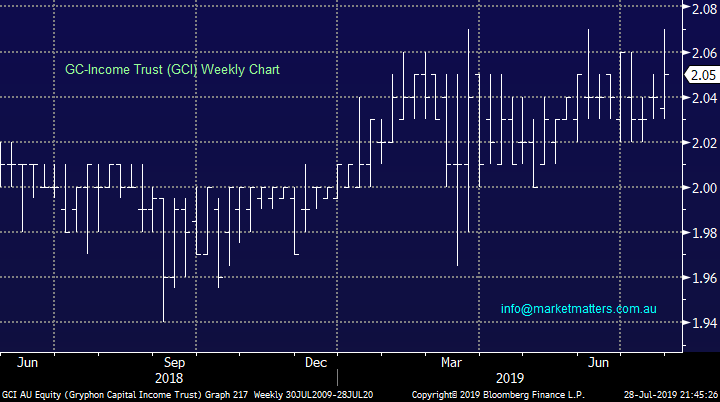
“Hi, Team at Market Matters, How would you rank the safety of investing in MXT, NBI & GCI? Thanks Sidney Is this the right place for subscribers to ask questions?” – Sidney H.
Hi Sidney,
You’ve asked a question I believe a number of subscribers have been thinking, especially as we own both the MXT and NBI listed investment trusts (LIC’s) in our Income Portfolio. This first point I would make is safety can be a dangerous perception as we all know plenty of household names who have fallen by the wayside over the last few decade’s but a spread of risk across a portfolio of say 20 positions certainly softens any position specific risks.
The three securities are very different in terms of their underlying exposures however the return objective provides some insight into the perceived risk of each. MXT targets the cash rate + 3.25%, GCI targets cash rate plus 3.50% & NBI targets 5.25%.
1 – MCP Master Income Trust (MXT) – MXT invests in domestic corporate loans, so sitting in alongside, or in place of banks, lending to Australian corporates.
2 – NB Global Corporate Income Trust (NBI) - NBI invests in global bond markets, holding a very diverse portfolio of overseas bonds.
3 - Gryphon Capital Income Trust (GCI) - GCI invests is residential mortgage backed securities (RMBS), which in simple terms is a security that is underpinned by a bunch of residential mortgages
These are all well diversified funds within their respective areas, however from a risk perspective, diversification between funds, fund managers, their strategies and underlying asset classes is the best way in managing risk.
MCP Master Income Trust (MXT) Chart
NB Global Corporate Income Trust (NBI) Chart
Gryphon Capital Income Trust (GCI) Chart
Question 5
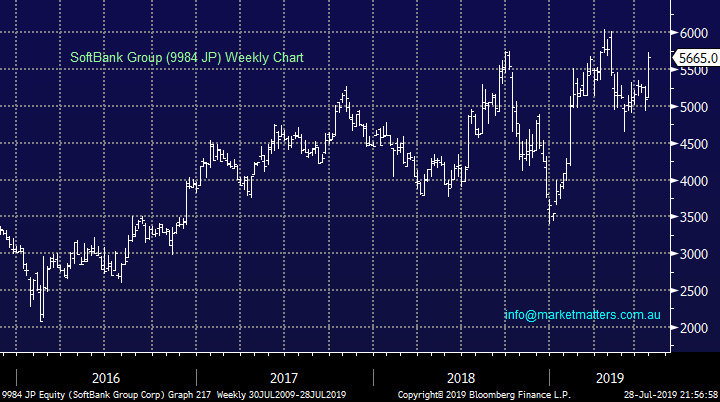
“I am looking to purchase SOFTBANK . Does MM have any thoughts pro or con on SOFTBANK? And can MM provide more information on which of the three SOFTBANK equities: Technology: SFBTF Corp: SFTBF and SFTBY I should consider? As always, thanks for the help and advice.” – Chris G.
Hi Chris,
We look at the SoftBank Group stock shown below, this Japanese Telco is now the 88th largest listed company in the world with a market cap of $US110bn, it was actually one of the best performing stocks globally last week rallying over 11%.
Softbank raised over $US23bn for its telecom unit in December 2018 and its looked strong ever since. We like the business and technically investors can buy Softbank and use stops below JPY5,250 - in our opinion enticing risk / reward.
MM likes Softbank at today’s level with a relatively close 7% stop.
SoftBank Group (9984 JP) Chart
Question 6
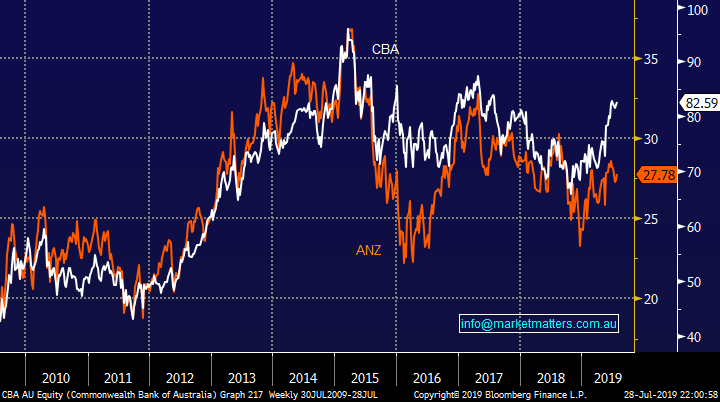
“Hi James & M&M Team, My question is, M&M moved from CBA to ANZ and your reason which I accept was that ANZ would outperform CBA, why not move after CBA’s up and coming dividend in August, wouldn’t CBA’s dividend yield outperform in the short term? Don’t the banks move in synchrony or there about, and if I stayed with CBA to take advantage of the August dividend first and then go onto ANZ would I be better or worse off in your opinion?” - Thank you, Keep up the good work. Tony K.
Morning Tony,
We are focusing purely on the differential in price between the two major banks because we cannot give personal advice and hence take into account how subscribers utilise franking credits. Interestingly banks do often slip in relative performance around their dividends because overseas investors do not benefit from franking credits and hence they often sell / switch.
Importantly we regard this as a relatively marginal play as can be seen by the chart below and I will be surprised if we don’t own CBA again within the next year.
Commonwealth Bank (CBA) v ANZ Bank (ANZ) Chart
Question 7
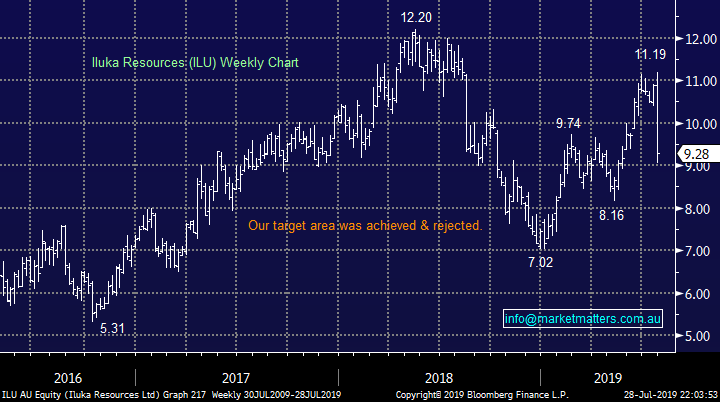
“Good morning James & MM team, I have a question on Iluka Resources Limited having announced it's June quarterly production numbers, the stock have fallen over 17% in 2 trading sessions - technically, it is just holding onto the 5 years moving average. Following this, brokers have rushed out to downgrade the stock with price targets ranging from sub-$10 to over $11 per share. What's MM take on the June quarterly production numbers. My entry price is $10.45 - would like to hear your thoughts on the short term price action. Thanks - regards, Tianlei
Morning Tianlei,
ILU’s numbers were clearly disappointing and the markets savage reaction implies a large number of players were overweight the stock, we actually feel it may be the case across the resources sector. When we sold ILU recently from our portfolios, we had a number of funds ‘bid’ us for the line of stock which told us the market was very bullish leading into this update.
However the almost 20% sell off is now feeling overdone and we feel value is again emerging for this mineral sands operator. We are considering dipping our toe in the water into further weakness, ideally below $9.
At this stage MM likes ILU around $9.
Iluka Resources (ILU) Chart
Question 8
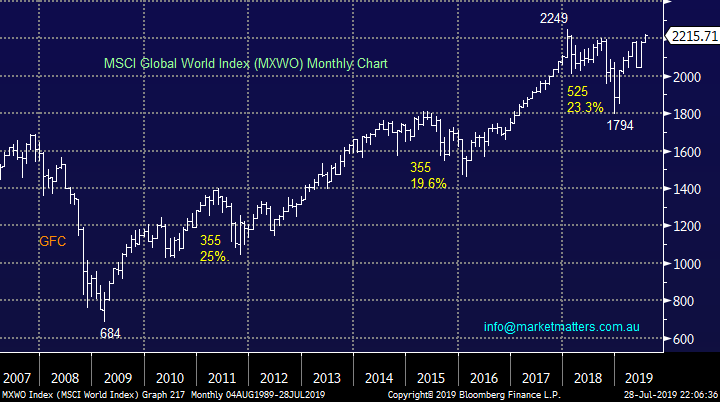
“As I have said before - the solution to 'too much debt' is more debt and inflated asset prices. Who in their right mind thinks this ends well?” – Scott T.
Morning Scott,
I cannot disagree with your prognosis longer-term but if markets are going to rally as they currently are my question is why not participate?
The chart below illustrates the largest bull market in history for global stocks, at this stage with central banks cutting interest rates down towards zero and QE not far behind the next 10% for stocks may easily still be up. I urge all subscribers to remain open-minded and as we have regularly said recently “don’t fight the tape”.
MSCI Global World Index (MXWO) Chart
Question 9
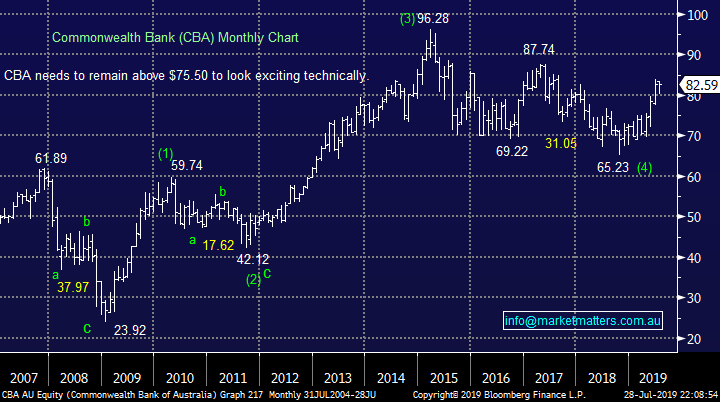
“Hey James & markets matters team, love your analysis, the ASX almost double top, l like your view on big 4 banks, will sell in this August? resistance lever? Thank you very much for your time” - Regards Yi S.
Morning Yi,
In the bigger picture we are bullish the banks but they do regularly give us the opportunity to add value / alpha. Currently we anticipate the leader CBA to trade between $80 and $85 in the weeks ahead, a great performance after already rallying almost 4% per month since Christmas, and that’s before a chunky $2 fully franked dividend in February.
Hence if CBA does push towards $85 in the weeks ahead MM are likely to move mildly underweight the Australian Banking sector the first time in 2019.
Commonwealth Bank (CBA) Chart
Question 10
“James & the Market Matters Team, I am a new subscriber and enjoying your alerts, commentary & service. I would appreciate if you could provide a daily Reuters screen shot of the domestic interest rates as they are most interesting and important re deposits and loans; generally as per AFR though they are obviously the day previous; say 30, 90 BBSY and 3 & 5-yr rates. I appreciate you have been doing good graphs and noting the recent inversion etc but I think the above is most relevant. If it is already provided but tucked away please advise as I am not fully conversant with your total service.” – Keith G.
Hi Keith,
Welcome aboard and thanks for the positive feedback!
We don’t actually use Reuters (now known as Refinitive)which is a stinking point in my household, given my wife works there – we use Bloomberg however they obviously provide the same interest rate / yield information. Leave with me and we may look to incorporate some of the data in our Afternoon Report’s market data table.
Question 11
“Afternoon MM Team, I am keen to follow the MM EFT portfolio but only want to do this with Australian based EFTs based on ease of access and fees. When adding to this portfolio are you able to suggest ASX alternatives to any positions e.g. as you did with US short position utilizing BBUS. Although not strictly following the portfolio the overall macro construction on the portfolio should be similar correct?” - Thanks Steve B.
Morning Steve,
Absolutely, we like to keep things as simple as possible. With ETF investing its often not a perfect science between a view and the available ETF’s. We will definitely use Australian ETF’s if they are the most appropriate, efficient etc and as you have asked at least provide some local alternatives, if / when they exist.
Overnight Market Matters Wrap
• The US hit record highs yet again as corporate earnings continue to dominate investors’ appetite to set their mode switch to risk, disregarding the current stalemate between US and China with their trade deal.
• The Nasdaq 100 outperformed the broader market as expected following Google’s parent company, Alphabet exceeding expectations. Meanwhile in the European region, Britain’s FTSE outperformed their region’s indices as their government is currently stable with the expected Brexit to happen on or before its due date.
• BHP is expected to underperform the broader market after ending its US session off an equivalent of -0.58% from Australia’s previous close towards the $40.60 level.
• The September SPI Futures is indicating the ASX 200 to open 30 points higher towards the 6820 level this morning.
Have a great day!
James & the Market Matters Team
Disclosure
Market Matters may hold stocks mentioned in this report. Subscribers can view a full list of holdings on the website by clicking here. Positions are updated each Friday, or after the session when positions are traded.
Disclaimer
All figures contained from sources believed to be accurate. Market Matters does not make any representation of warranty as to the accuracy of the figures and disclaims any liability resulting from any inaccuracy. Prices as at 29/07/2019
Reports and other documents published on this website and email (‘Reports’) are authored by Market Matters and the reports represent the views of Market Matters. The MarketMatters Report is based on technical analysis of companies, commodities and the market in general. Technical analysis focuses on interpreting charts and other data to determine what the market sentiment about a particular financial product is, or will be. Unlike fundamental analysis, it does not involve a detailed review of the company’s financial position.
The Reports contain general, as opposed to personal, advice. That means they are prepared for multiple distributions without consideration of your investment objectives, financial situation and needs (‘Personal Circumstances’). Accordingly, any advice given is not a recommendation that a particular course of action is suitable for you and the advice is therefore not to be acted on as investment advice. You must assess whether or not any advice is appropriate for your Personal Circumstances before making any investment decisions. You can either make this assessment yourself, or if you require a personal recommendation, you can seek the assistance of a financial advisor. Market Matters or its author(s) accepts no responsibility for any losses or damages resulting from decisions made from or because of information within this publication. Investing and trading in financial products are always risky, so you should do your own research before buying or selling a financial product.
The Reports are published by Market Matters in good faith based on the facts known to it at the time of their preparation and do not purport to contain all relevant information with respect to the financial products to which they relate. Although the Reports are based on information obtained from sources believed to be reliable, Market Matters does not make any representation or warranty that they are accurate, complete or up to date and Market Matters accepts no obligation to correct or update the information or opinions in the Reports. Market Matters may publish content sourced from external content providers.
If you rely on a Report, you do so at your own risk. Past performance is not an indication of future performance. Any projections are estimates only and may not be realised in the future. Except to the extent that liability under any law cannot be excluded, Market Matters disclaims liability for all loss or damage arising as a result of any opinion, advice, recommendation, representation or information expressly or impliedly published in or in relation to this report notwithstanding any error or omission including negligence.


