Subscriber’s Questions (AMP, CYB, BBUS, LOV, KDR, CZZ, ATC)
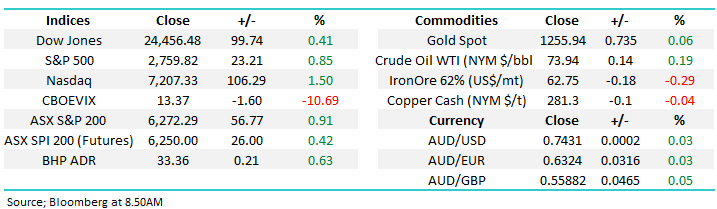
The ASX200 is set to again make fresh decade highs this morning as equities continue to shrug off any concerns around a potential US-China trade war. At MM we have been looking for a meaningful top in 2018 /19, but investors should “not fight the tape” and at the moment bad news is being ignored while no news is often embraced – undoubtedly a bullish mood for now. While we believe the Trump fuelled trade war is a very real threat to global economic growth moving forward ignoring market sentiment is usually a costly endeavour, especially in the short-term.
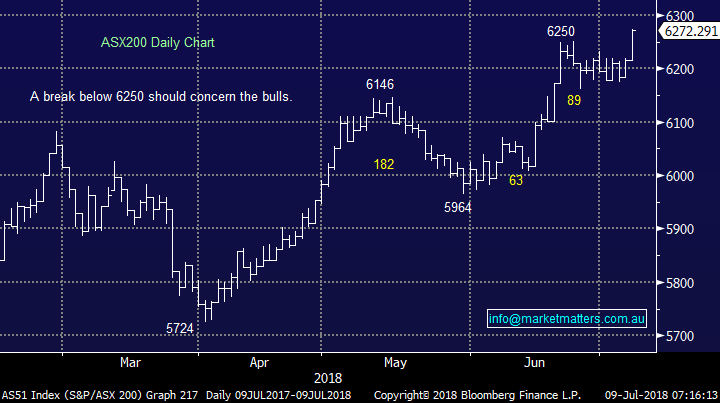
- MM remains mildly short-term bullish the ASX200 while the index holds above 6250 but we remain in “sell mode” albeit in a patient manner.
The Australian Financial Review (AFR) was reporting last night that BP was bidding more than US$10bn for BHP’s shale assets - no great surprise but combined with the current market optimism, a rally by the “Big Australian” towards fresh 2018 highs would not be a shock as investors consider large potential capital management moving forward i.e. ~5% higher.
Thanks again for a healthy volume of questions, especially with school holidays upon us, as always please keep them coming.
ASX200 Chart
Question 1
“Dear James, my broker sent an email today urging his clients to sell AMP because of fears of a future highly-discounted capital raising. He thinks that AMP could go under $3. What do you and the Team think about this suggestion?” - Thanks John K.
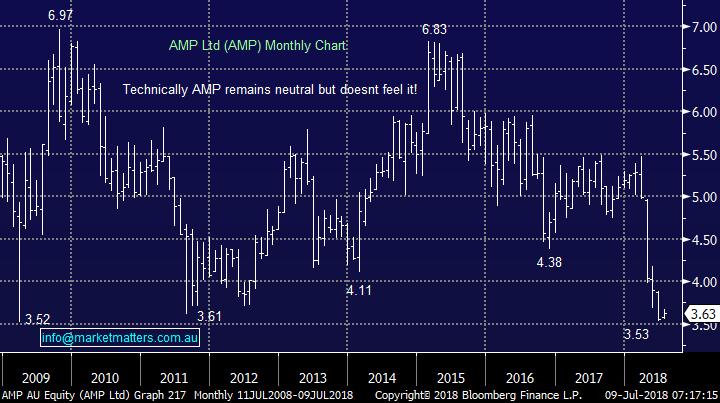
Hi John, as we all know AMP has been hammered of late due to the awful findings by the Hayne Royal Commission, this is largely behind us now and as we’ve seen with CBA’s +12.6% rebound selling a crescendo of bad news can often be a poor investment decision. AMP is sitting around its low of 2009, down almost 30% for the year so I do question if you were advised to sell earlier in the year above $5.
However, moving onto today, AMP is trading on an estimated P/E valuation of 11x 2018 earnings, compared with say Suncorp (SUN) at 18.6x so it’s clearly on the cheap side compared to its peers. Poor corporate governance is clearly going to cost AMP a substantial amount of money but this is largely built in to the share price.
We believe that AMP will take 2-3 years to turn the corner after its recent scolding but David Murray (ex CBA) is a very able lieutenant for the job and we should remember that share prices usually lead corporate performance, especially on turnarounds
At MM we are not yet “sniffing” around AMP, but it’s certainly slowly becoming attractive, a capital raising that pushed the stock below $3 may well be an excellent buying opportunity – at current levels we are neutral.
NB Capital raisings can often lead to a stock popping higher if it is oversubscribed and we doubt if AMP would need to raise money at a ~20% discount to the already battered share price.
We spoke in depth regarding our views on AMP in last week’s Income Report
AMP Ltd (AMP) Chart
Question 2
“Hi MM, can you please clarify whether you sold your entire holding in CYB or just part of?” – Thanks Tom N.
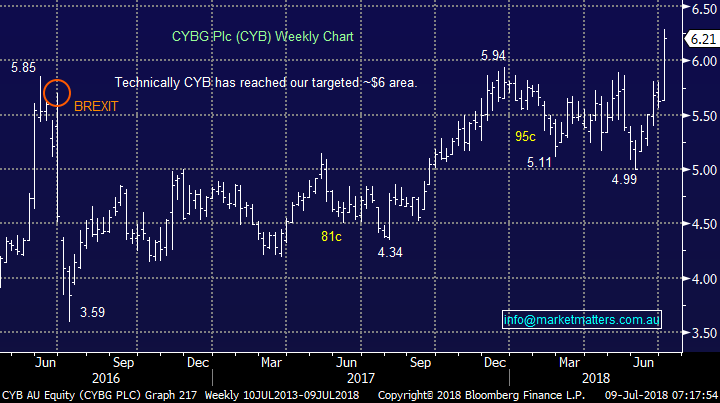
Hi Tom, we sold our entire holding of CYB last week as planned when the stock broke above $6 – our positions can be viewed on the MM website under the Growth Portfolio.
Obviously at this stage we wish we had held back for a day or two, but as we regularly quote “plan your trade and trade your plan”, an equally suitable phrase for investing – to sell above $6 had been our plan for many months.
Although we only realised a profit of just over 10%, the stock has enjoyed a solid 25% turnaround over the last 6-weeks turning a paper loss into a reasonable profit.
We will continue to monitor CYB now its reached our target area and as subscribers know we are not afraid to re-enter a stock at a higher price if our opinion evolves accordingly.
CYBG Plc (CYB)
Question 3
"From this Weekend’s Report:
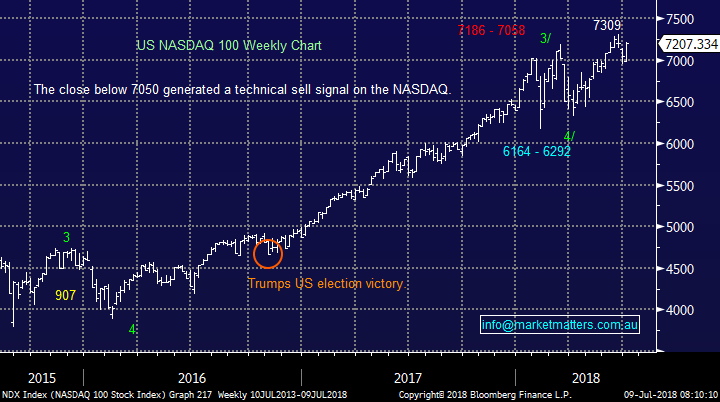
- "Then we expected the S&P500 to attempt a rally potentially to fresh all-time highs– this is currently unfolding and will theoretically follow one of the below 2 green arrows with fresh all-time highs ~4% higher."
Really?? Then why take out a short ETF on the S&P500?? I suspect 'hedging risk' is the most likely response - but what risk if the portfolio doesn't hold equities in the US? Just seems like you are betting against yourself or having 50 cents each way. Guess if the S&P500 goes down or up you'll be claiming victory!” – Scott T.
Hi Scott, a very fair question and one of our positions we spent the most time considering over the weekend.
As you know, we are looking for a meaningful correction by equities in 2018/19 and hence we are looking to slowly build a defensive / negative portfolio at MM, especially in our active flagship Growth Portfolio.
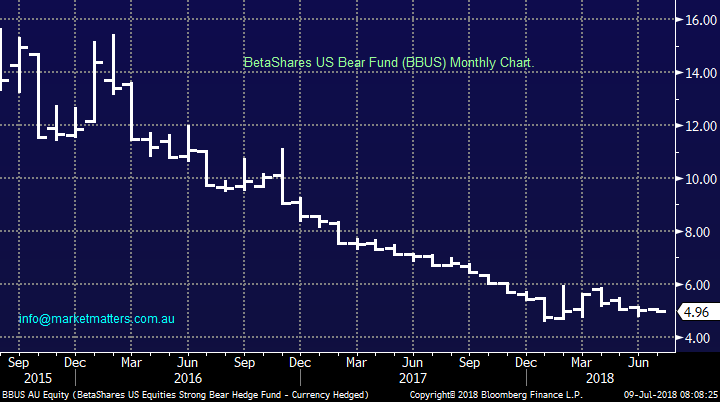
The reason we took the position in the BBUS was the break back under 7050 by the tech. based NASDAQ index i.e. the technical trigger in the often leading US index.
Firstly, note we only took a relatively small 3% position in this “aggressive” ETF leaving us room to add to the position moving forward.
Secondly, we regard our Growth Portfolio as an active portfolio where we look to add alpha, not replicate the ASX200, hence while it’s easy to justify the position when we have almost 70% of our portfolio in equities this is a standalone position that we are looking to profit from moving forward i.e. if stocks do correct over 10% in 2018/19 we will be trying to make money not lose say only 5%.
Lastly, we expect the ASX200 will outperform US stocks over the next 12-18 months primarily because our influential banking sector has been so oversold, hence being short US stocks against our Australian portfolio makes sense when we are looking to add value.
US NASDAQ Chart
BetaShares US Bear ETF (BBUS) Chart
Question 4
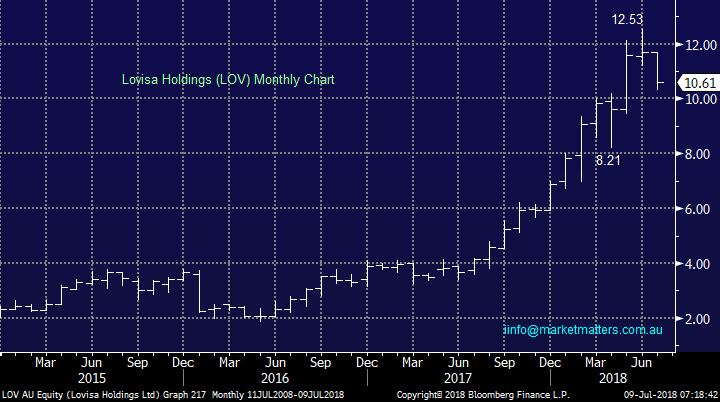
"Hi MM, what is your view on Lovisa (LOV) it has been going down regularly since its high of $12.53 and today is down to $10.40 or ~-17% since 15th June” – Thanks David R.
Hi David, over the last 2-years the fashion jewellery / retailers shares have enjoyed an amazing run compared to the retail sector so my first thought is this pullback is no big deal in the scheme of things.
LOV had a similar hiccup back in April when its CEO suddenly left the business, not usually a good scenario. LOV is trading on a high valuation of 32x earnings hence it comes down to whether their planned expansion into the US is successful, the pullback is likely to be far deeper if not.
Considering the stocks appreciation I can understand why some investors have locked in some profits and at current prices we are neutral LOV.
Lovisa (LOV) Chart
Question 5
“Lithium is very in vogue with Australia leading the world in batteries according to the AFR, what’s your favourite stock in the sector today?” – Thanks Ray W.
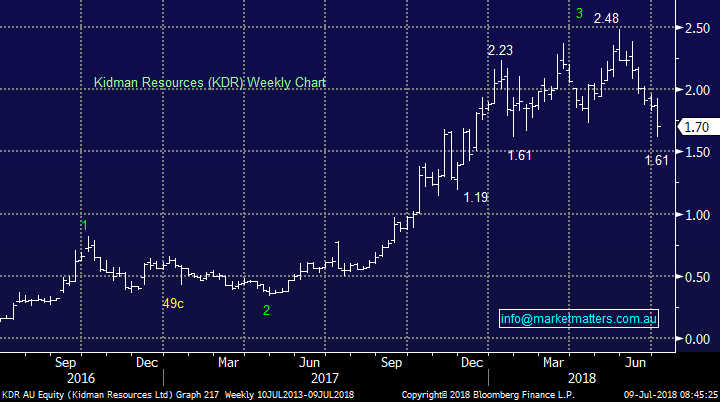
Hi Ray, I touched on this in the Weekend Report – at today’s levels we like Kidman Resources (KDR), we are ourselves considering buying around $1.70 while leaving enough ammunition to average around $1.25.
The lithium sector has been extremely hot over the last 2-years and its volatility cannot be underestimated, fresh production is coming on-line hence investors are becoming concerned around the lithium price in the years to come.
At MM we are firm believers in the car battery etc story hence we are buyers of weakness but in today’s environment sellers of strength also makes sense – we are long Orocobre (ORE) which we expect to sell in 2018.
Kidman Resources (KDR) Chart
Question 6
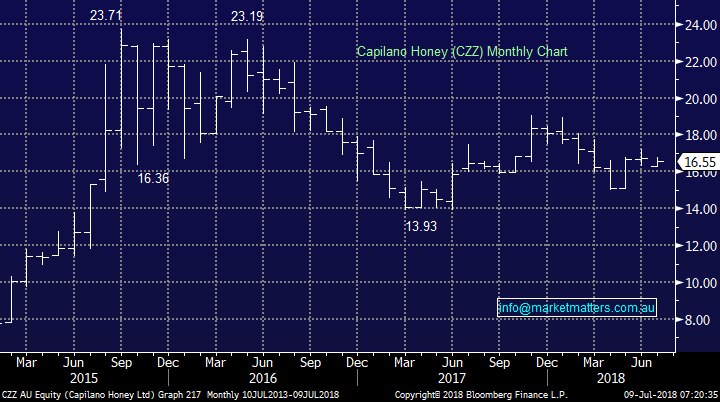
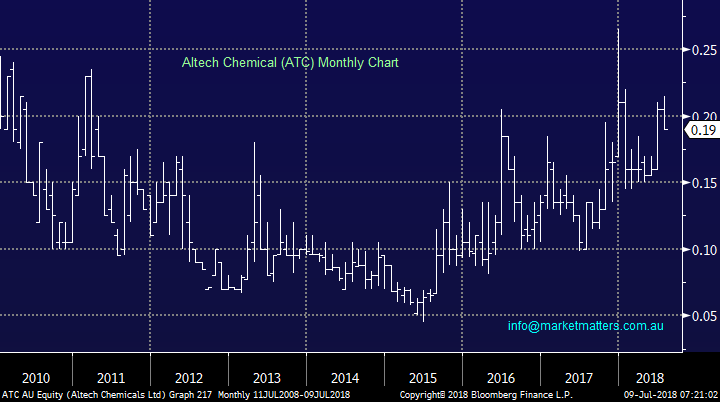
“Hi again, Re Capilano Honey - The war against Capilano continues any thoughts moving forward? On a separate matter in an earlier email I asked about Altech (ATC) but have not received a reply. I would like your opinion on this company as it seems to me it is on the verge of becoming a key supplier of an important ingredient in a high growth industry. I look forward to hearing from you.” – Thanks Dave T.
Hi David, I will answer in 2 parts to keep things simple:
- Capilano Honey (CZZ) is basically trading where it was a year ago, making any technical thoughts pretty neutral. For the keen we could be buyers with stops below $16.
Capilano Honey (CZZ) Chart
- Altech (ATC) is a lithium-ion battery play, the aluminium producer operating out of Malaysia is currently in a trading halt ahead of a $20m capital raising.
I’m afraid this stock is currently in the too hard basket for MM at present.
Altech Chemical (ATC) Chart
Overnight Market Matters Wrap
· The US equity markets rose and European bourses recovered, as the jobs report for June provided some welcome distraction for investors who have spent the week tracking the latest round of the international trade dispute.
· The US employment data (213k jobs vs expectations of 195k) also knocked the dollar and left yields on Treasuries little changed as investors judged that the dip in earnings growth means the Federal Reserve won’t need to raise rates more quickly.
· Despite the positive jobs report, the risk around an escalation in the trade war persisted as Washington imposed tariffs on USD34bn of imports from China on Friday.
· Closer to home, BP has offered well in excess of US$10 billion for BHP's US onshore shale oil and gas assets, sources told Reuters. BHP is expected to outperform the broader market after ending its US session up an equivalent of 0.63% from Australia’s previous close.
· The September SPI Futures is indicating the ASX 200 to hit fresh decade highs again, up 32 points towards the 6300 level this morning.
Have a great day!
James & the Market Matters Team
Disclosure
Market Matters may hold stocks mentioned in this report. Subscribers can view a full list of holdings on the website by clicking here. Positions are updated each Friday, or after the session when positions are traded.
Disclaimer
All figures contained from sources believed to be accurate. Market Matters does not make any representation of warranty as to the accuracy of the figures and disclaims any liability resulting from any inaccuracy. Prices as at 09/07/2018
Reports and other documents published on this website and email (‘Reports’) are authored by Market Matters and the reports represent the views of Market Matters. The MarketMatters Report is based on technical analysis of companies, commodities and the market in general. Technical analysis focuses on interpreting charts and other data to determine what the market sentiment about a particular financial product is, or will be. Unlike fundamental analysis, it does not involve a detailed review of the company’s financial position.
The Reports contain general, as opposed to personal, advice. That means they are prepared for multiple distributions without consideration of your investment objectives, financial situation and needs (‘Personal Circumstances’). Accordingly, any advice given is not a recommendation that a particular course of action is suitable for you and the advice is therefore not to be acted on as investment advice. You must assess whether or not any advice is appropriate for your Personal Circumstances before making any investment decisions. You can either make this assessment yourself, or if you require a personal recommendation, you can seek the assistance of a financial advisor. Market Matters or its author(s) accepts no responsibility for any losses or damages resulting from decisions made from or because of information within this publication. Investing and trading in financial products are always risky, so you should do your own research before buying or selling a financial product.
The Reports are published by Market Matters in good faith based on the facts known to it at the time of their preparation and do not purport to contain all relevant information with respect to the financial products to which they relate. Although the Reports are based on information obtained from sources believed to be reliable, Market Matters does not make any representation or warranty that they are accurate, complete or up to date and Market Matters accepts no obligation to correct or update the information or opinions in the Reports. Market Matters may publish content sourced from external content providers.
If you rely on a Report, you do so at your own risk. Past performance is not an indication of future performance. Any projections are estimates only and may not be realised in the future. Except to the extent that liability under any law cannot be excluded, Market Matters disclaims liability for all loss or damage arising as a result of any opinion, advice, recommendation, representation or information expressly or impliedly published in or in relation to this report notwithstanding any error or omission including negligence.
To unsubscribe. Click Here


