Subscriber’s Questions (A2M, BHP)
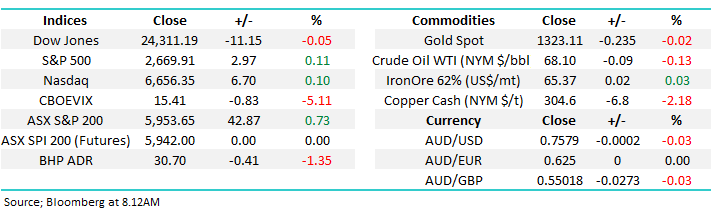
The news flow over the weekend was light but again net positive with the North Korea / Kim Jung-Un global concerns appearing to be well and truly behind us. An eventual combination of North and South Korea could potentially ignite another period of significant economic growth in the Asian region adding weight to our view that the US stock market is likely to underperform moving forward over both shorter and longer timeframes.
Local stocks are set to open slightly higher if the futures market is correct, an optimistic early call considering BHP closed down 40c / 1.3% in the US on Saturday morning. However at MM we remain bullish hence today some heavy lifting by the broad market, including the embattled financial sector, would not vaguely surprise. This week’s sentiment is likely to be determined by the “big four” banks with ANZ kicking off bank reporting season tomorrow – overall we are out on a limb at MM presently preferring banks / financials to resources.
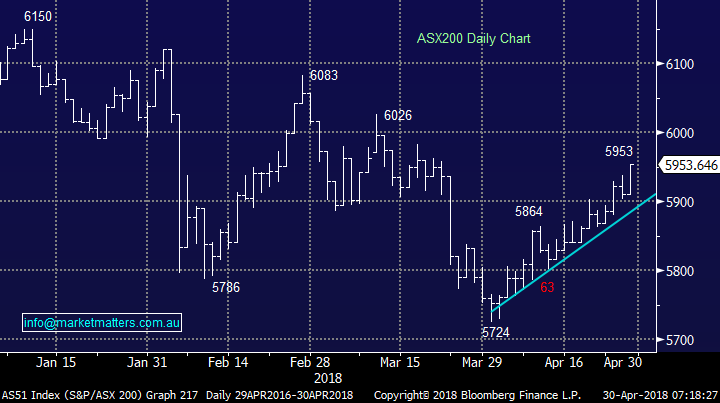
The ASX200 has basically ground higher since this months low, we will now maintain our bullish short-term bias while the market can hold above 5850. We have again received a solid number of questions this week considering school holidays are just finishing and the ANZAC Day break mid last week. Thanks – keep them coming!
Today I have chosen to answer only 4 but cover the subjects in a touch more depth than usual.
ASX200 Chart
Question 1
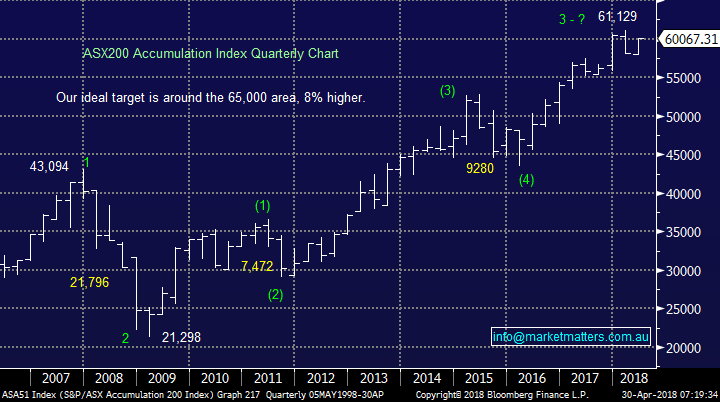
“G’Day James, I’m a little, confused your target for the ASX200 is ~3.5% higher but you’re calling the ASX200 Accumulation Index ~8% higher.” – Thanks Steve E.
Hi Steve, that’s a great question and one that I actually deliberated on over the weekend. A couple of factors come into play which should help clarify the apparent discrepancy. Our +3.5% target for the ASX200 is a minimum goal of fresh 2018 highs but we actually think it should rally a touch further, sorry if that was not explained more clearly. The below should help clarify the thoughts:
- The ASX200 pays out some major dividends in the coming weeks including 3 of the “big 4 banks”, this theoretically will take ~0.3% from the index but conversely adds to the return of the Accumulation Index.
- Identifying tops is a far tougher job in our opinion than bottoms hence our targets are “guestimates” which we evaluate / tweak consistently.
However the biggest contributor is the margin of error in both targets as we simply evaluate every individual index as we see them.
- The ASX200 could easily top out around 6250 which including dividends is over ~5% higher but if the Accumulation index falls a touch short of our 65000 target we have basic alignment.
I know this feels like classic “lies, lies and statistics” but as I’ve said previously we use all the various indices to create an almost jigsaw like puzzle of clues to where the market is travelling while continually focusing on simple risk / reward.
NB We generally trickle sell into regions where we believe the risk / reward favours a decent correction as we believe the regular pinpoint accuracy of “tops” is statistically near impossible.
ASX200 Chart
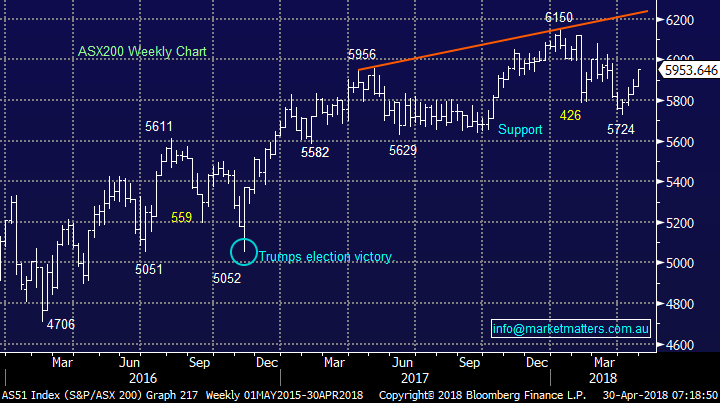
ASX200 Accumulation Index Chart
Question 2
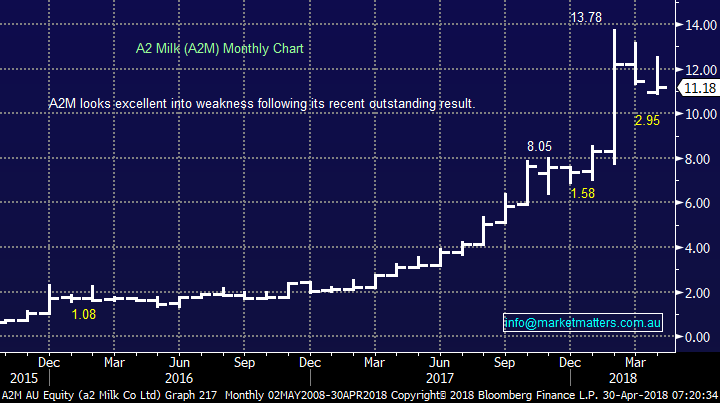
“Hi James, surprised you didn’t take the opportunity to get a2m sub $11.50. For the record although I don’t hold any stocks that you guys cover I do enjoy your emails of the morning and afternoon.” - Regards Frank M.
Hi Frank, we almost did! In a nutshell we feel the 21% pullback has ongoing momentum to fall further hence we may get the opportunity to buy around $10.60 in the next few weeks, hopefully we are not being too clever! We may change our mind and pay up but for now patience feels the best option.
- We are buyers of A2M into weakness with an ideal target of ~$10.60.
Also thanks for the thumbs up to our commentary, I know from previous emails you are very long A2M so perhaps you will follow some of our calls when you decide it’s time to spread your investments further afield.
A2 Milk (A2M) Chart
Question 3
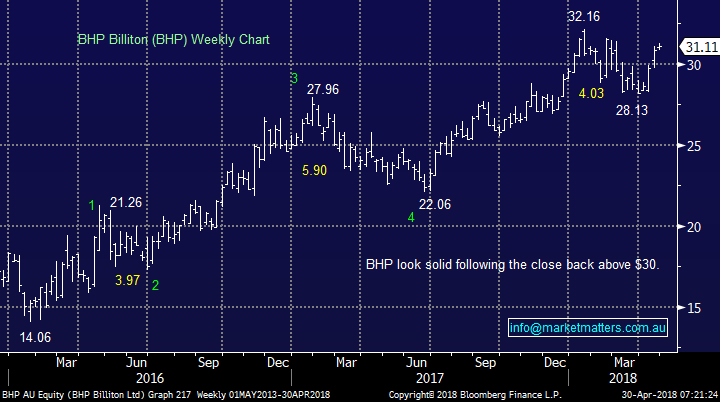
“Hi guys, love your commentary. My Sunday would not be the same without the market updates, to allow me to plan my Buys and Sells. I am often left with questions about the two Portfolios: Why will some Portfolio stocks have a Buy or Hold comment, when the shopping lists or general commentary may have a Sell for the same stocks? As an example, BHP in both Income and Growth Portfolio has Buy advice. But the shopping list of the 24th April, says you want to, “sell BHP in the coming weeks". (You already sold 1/2 of the holding recently, providing a warning, it is time to consider getting out of BHP as it may not reach $32.00) In the Income Portfolio, 9 of the 17 stocks show a negative capital return. with 1/2 of these stocks have a buy advice. In the stocks with a negative result at present, do you consider the capital losses will only be a short-term thing, and/or eventually the stock will be in credit when dividends and imp credits are considered?” - Regards Geoff B.
Morning Geoff, thanks for the in-depth and well thought out question which I will address in 2 parts:
Firstly, the Growth Portfolio is a more active vehicle which replicates our own portfolio / with our own funds. Hence with BHP while we like the reflation story over the coming years, a bullish outlook for BHP, we believe a decent pullback is now a strong possibility – unfortunately contradictory thoughts over different timeframes. We tend to live / invest in the now with the Growth Portfolio but keep a definite eye on the bigger picture hence the “Buy call” – apologies for the understandable confusion.
We are in the process of sending out a survey to members as we undertake a significant upgrade of the MM service with this message over different timeframes being one we will definitely look address.
Secondly, as you say the Income Portfolio is showing some paper capital losses but as the name suggests this is a portfolio that searches for income while protecting / searching for conservative gains in capital. While our preferred scenario is that the ASX200 will make fresh decade highs moving forward we are currently comfortable holding a very low cash position in this portfolio given our exposure to more defensive exposures like hybrids, and the MCP Credit Fund. Overall, the portfolio is designed to offer a total return of the cash rate (1.5%) plus 4% with higher yield and lower volatility than the share market. The benchmark is therefore 5.5% per annum and since inception the portfolio has tracked above this number.
In terms of closed positions in this portfolio, there have been 9 closed positions since inception (7/5/2017) with 8 winners and 1 loser. To view past activity click the link below. You can sort between each portfolio and drill into past calls.
https://www.marketmatters.com.au/recent-activity/
BHP Billiton (BHP) Chart
Question 4
“Hi Guys, now you are calling stocks to fresh decade highs how much of your cash holding do you expect to invest for the move?” – Thanks Richard E,
Morning Richard, a great question and one that I was pondering during a brief holiday last week. As you rightly point out, we have become more short-term bullish. I can easily see us allocate ~10% of our cash on the Growth Portfolio back into the market with a more short-term time horizon. In the Weekend Report we discussed potential takeover targets and the “dogs” of the last 12-months, these themes are likely to dominate any purchases in the next few weeks.
Importantly we must remember that our general goal is to increase our cash holdings/ negative facing positions in 2018 so I reiterate that buying is likely to be short-term in nature.
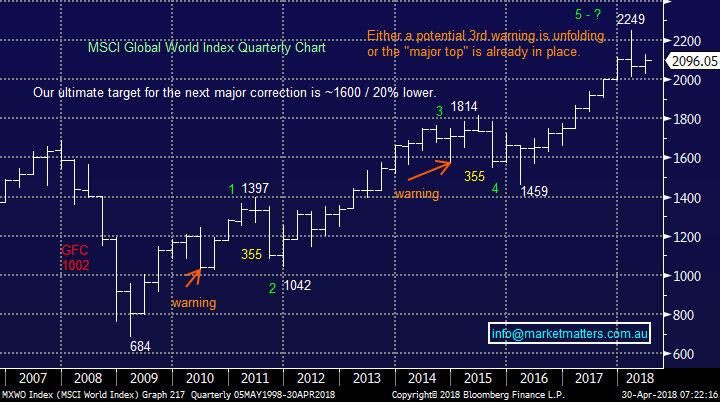
MSCI Global World Index Chart
Overnight Market Matters Wrap
· A quiet session was experienced in the US last Friday, with the major indices ending its day with little change.
· Base metals on the LME were weaker as Russian oligarch Deripaska agreed to sell down his majority stake in EN+, the holding company that owns 48% of Rusal.
· BHP is expected to underperform the broader market after ending its US session down an equivalent of 1.35% from Australia’s previous close.
· The RBA meets tomorrow (most expect unchanged ahead of the May budget) and the statement of monetary policy will be released on Friday. The US Fed meanwhile, is due to meet on May 1-2 with most pundits also expecting no rate rise. The yield on US 10 year notes fell to 2.96%
· The June SPI Futures is indicating the ASX 200 to open marginally higher, up 10 points testing the 5965 level this morning.
Have a great day!
James & the Market Matters Team
Disclosure
Market Matters may hold stocks mentioned in this report. Subscribers can view a full list of holdings on the website by clicking here. Positions are updated each Friday, or after the session when positions are traded.
Disclaimer
All figures contained from sources believed to be accurate. Market Matters does not make any representation of warranty as to the accuracy of the figures and disclaims any liability resulting from any inaccuracy. Prices as at 30/04/2018. 8.26AM
Reports and other documents published on this website and email (‘Reports’) are authored by Market Matters and the reports represent the views of Market Matters. The MarketMatters Report is based on technical analysis of companies, commodities and the market in general. Technical analysis focuses on interpreting charts and other data to determine what the market sentiment about a particular financial product is, or will be. Unlike fundamental analysis, it does not involve a detailed review of the company’s financial position.
The Reports contain general, as opposed to personal, advice. That means they are prepared for multiple distributions without consideration of your investment objectives, financial situation and needs (‘Personal Circumstances’). Accordingly, any advice given is not a recommendation that a particular course of action is suitable for you and the advice is therefore not to be acted on as investment advice. You must assess whether or not any advice is appropriate for your Personal Circumstances before making any investment decisions. You can either make this assessment yourself, or if you require a personal recommendation, you can seek the assistance of a financial advisor. Market Matters or its author(s) accepts no responsibility for any losses or damages resulting from decisions made from or because of information within this publication. Investing and trading in financial products are always risky, so you should do your own research before buying or selling a financial product.
The Reports are published by Market Matters in good faith based on the facts known to it at the time of their preparation and do not purport to contain all relevant information with respect to the financial products to which they relate. Although the Reports are based on information obtained from sources believed to be reliable, Market Matters does not make any representation or warranty that they are accurate, complete or up to date and Market Matters accepts no obligation to correct or update the information or opinions in the Reports.
If you rely on a Report, you do so at your own risk. Any projections are estimates only and may not be realised in the future. Except to the extent that liability under any law cannot be excluded, Market Matters disclaims liability for all loss or damage arising as a result of any opinion, advice, recommendation, representation or information expressly or impliedly published in or in relation to this report notwithstanding any error or omission including negligence.
To unsubscribe. Click Here


