Subscriber’s Questions – (A2M, BAL, FMG, NCM, NST, PAR, QRI, SEC, WPM US)
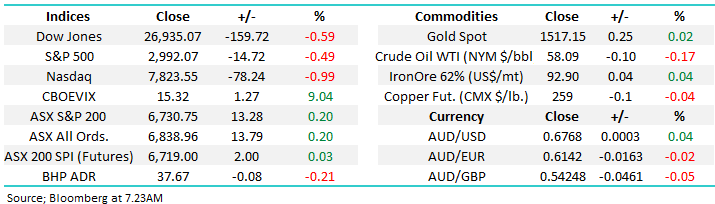
The local ASX200 continued to grind higher last week aided by another turn lower in bond yields – after rate cuts by Europe and the US markets are now rating the prospect of a cut by the RBA in early October as a 70% possibility, I feel even if they don’t get their rate cut “fix”, expectations will simply move to Melbourne Cup Day in November. This week on Tuesday evening the RBA governor will give a speech titled an “Economic Update”, a perfect platform for him to provide some clues to the markets around the current RBA thinking.
Over the weekend we saw little news that felt likely to influence the market this morning, at 6am AEST currencies have already commenced trading and in line with our thoughts - all basically unchanged - President Trumps Twitter account has enjoyed a quiet weekend! The main game in town remains interest rates in our opinion and with a stock market expecting another sugar hit in the coming weeks its hard to see any meaningful pull back in stocks unless we see a 180 degree change in markets expectations from the RBA.
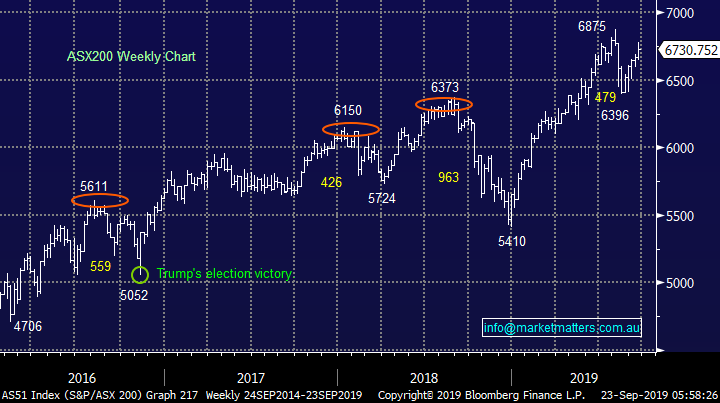
No change, with the ASX200 trading above the 6700 area, MM is comfortable being relatively defensive, at least for a few weeks / months.
This morning SPI futures were pointing to an unchanged opening for local stocks but the S&P futures have actually opened up +0.3%, probably on US-China trade optimism, hence we expect us to be up 10-15 points early this morning.
Thanks as always for the questions, I have left some of the best until last!
ASX200 Index Chart
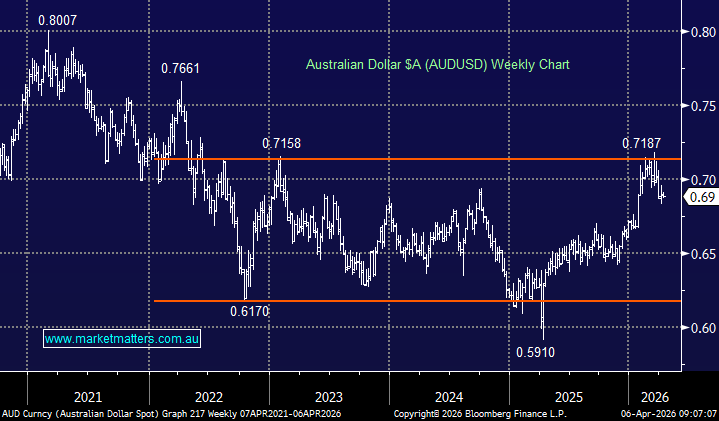
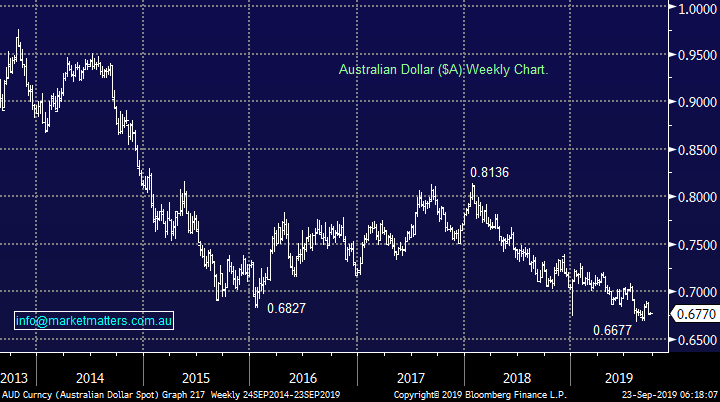
As mentioned above the Aussie has opened this morning well below the 68c area as investors anticipate an RBA Cash Rate of 0.75% in the next few weeks, followed by 0.5% in 2020 - not particularly supportive for our currency. It should be good news for local tourism who benefit from us being a more attractive destination for both overseas and local travellers.
At MM we are still looking for a trigger to buy the $A for our Global Macro ETF Portfolio but patience is paying off to-date, perhaps we will see a classic “buy on rumour, sell on fact” style event, or in this case buy the $A when we get a rate cut or it becomes a +90%probability priced in – cue the Philip Lowe on Tuesday night.
Australian Dollar ($A) Chart
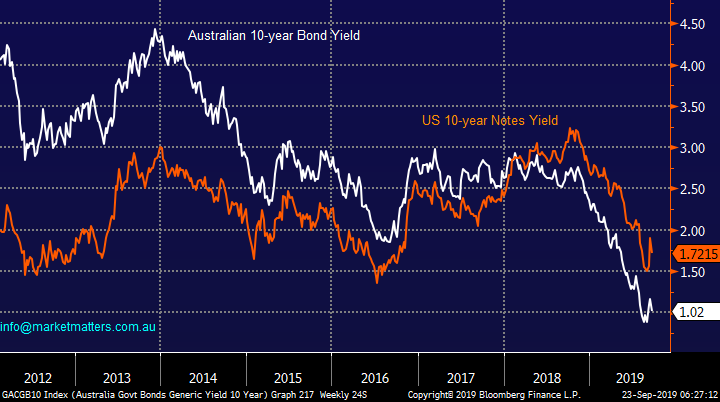
The chart below illustrates perfectly how Australian bond yields are winning the race to the bottom against their US peers. With monies held in $US enjoying a greater yield than funds parked on our shores its easy to envisage why the $A is struggling.
Historically the $A does enjoy the tailwind of higher local bond yields, back in 2013/4 it was a huge ~1.5% positive differential. In our opinion this will revert in the years ahead adding some support to the “Little Aussie Battler”.
Australian & US 10-year Bond Yields Chart
Question 1
“Hi James and M&M, could you give your opinion on the Bellamy's take over? Thank you "Love your work". “ – tony.
Morning Tony,
Thanks for the thumbs up, much appreciated!
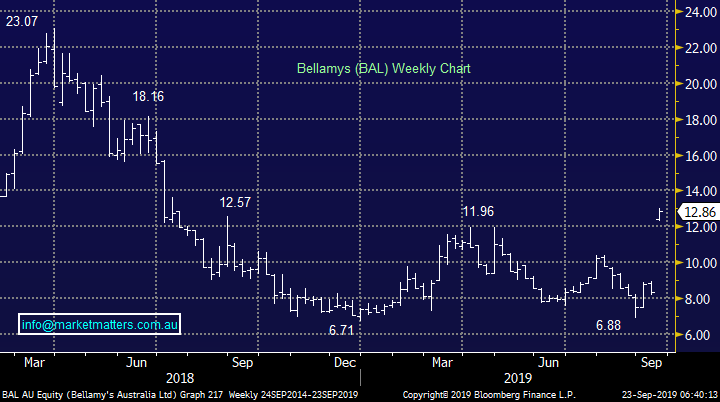
Clearly the $1.5bn takeover bid for Bellamy’s (BAL) from China’s Mengniu Dairy Company is great news for holders of the Tasmanian based company whose shares have struggled badly since Q1 of 2018 – a 50% pop in one day is always nice.
The $12.65 cash and 60c dividend feels almost generous to MM and following the board’s unanimous approval the deal looks good assuming the FIRB don’t get caught up in an anti-China theme i.e. probably more downside than upside from here.
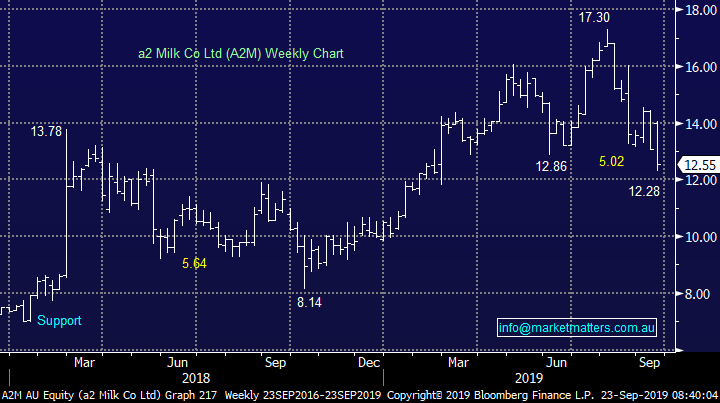
At current prices MM likes the switch from BAL to a2 Milk (A2M).
Bellamy’s (BAL) Chart
A2 Milk (A2M) Chart
Question 2
“PAR have recently received FDA approval and the price has risen. Are further approvals pending and what would be a reasonable timeframe for these and your outlook for this business” – Mike C.
Morning Mike,
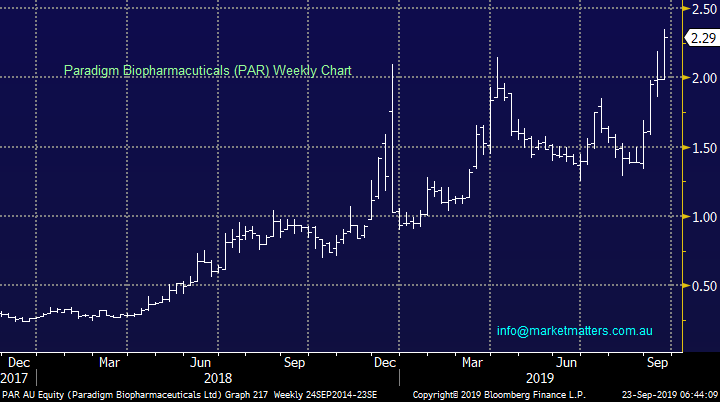
While PAR is not a company I’m overly familiar with I have come across them in passing. Paradigm (PAR) has developed a treatment for Osteoarthritis of the knee, largely targeted towards sports people that suffer at earlier ages. There is no known cure and it impacts millions of people globally. In terms of the FDA approval this is in terms of a limited approval known as a compassionate use program, in other words, they can use now for a select audience. Further approvals are still required including in Australia, the time frame of that is always a risk.
While I hold the view that Investing in the bio-tech space is fraught with danger, PAR is certainly on the right track and the share price is showing this. In these sort of stocks, we would fall back on our technical views here but with one eye on the timetable of upcoming announcements when they become available.
MM’s likes PAR technically while it remains above $2.
Paradigm Biopharmaceuticals (PAR) Chart
Question 3
“Hi Just a question What are your thoughts on Qualitas RE Income Units (QRI) as an income play? It’s trading marginally above net asset value ATM” - Thanks Chris.
Hi Chris,
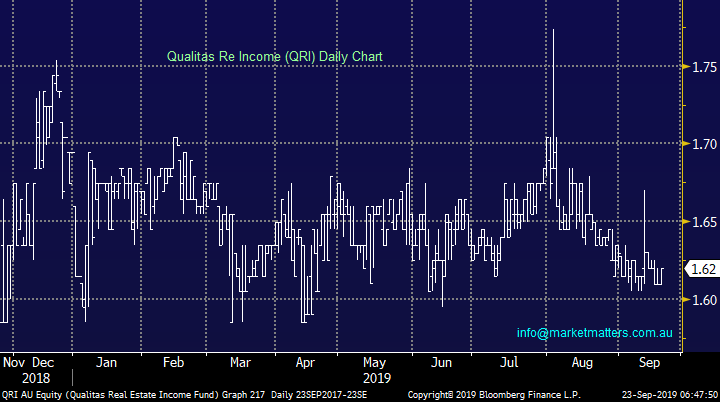
Listed investment Trust QRI invests is property loans, much the same as our existing holding in MXT for the MM Income Portfolio, although I’d argue QRI is higher risk, higher targeted return and higher fees. There are a number of these sort of listed trusts on the market these days but they’re not all the same.
QRI targets 8% pa return after fees, with the fee structure on the high side. They charge ~2% when expenses are included plus a 20.5% performance fee on any return over 8%. This compares to MOT, which is a similar sort of offering which charges 1.45% plus a 15.38% performance fee above RBA cash +6%, with their target being 7% pa.
MXT, the lower risk cousin to these guys charges a management fee below 1%with a more modest target of RBA cash +3.25%. With a lower expected return and no performance fee, MXT is less incentivised to take significant risks to generate returns, which is what I tend to look for in the defensive component of a portfolio.
MM is not particularly excited by QRI.
Qualitas Real Estate Income Fund (QRI) Chart
**Disclosure: Shaw and Partners was appointed manager to the recent capital raise in QRI where a fee was paid**
Question 4
“HI MM team, just your technical analysis for FMG in the medium term as well as NST. Also is it possible to do another video interview with Peter O’Connor from Shaw's like earlier this year on the iron ore, copper etc stocks.” - Thanks, Tim C.
Hi Tim,
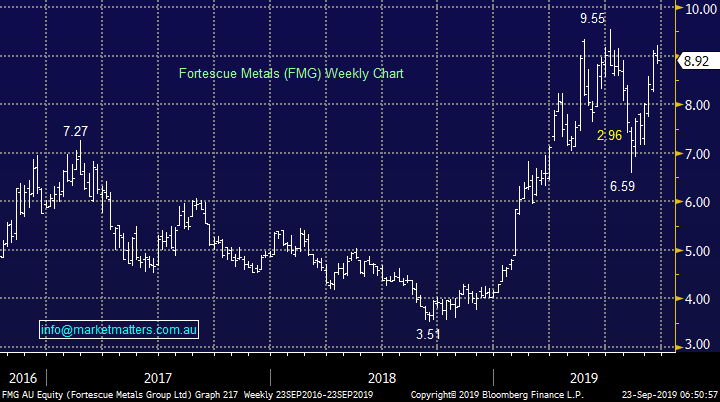
Firstly, looking at Fortescue Metals (FMG) which we own in our Growth Portfolio. We like FMG technically expecting some consolidation around the $9 area before test of the $10 area.
However I would stress this is a volatile beast and our technical opinion can often change weekly – fundamentally we are fans of the iron ore miner.
MM remains bullish FMG.
Fortescue Metals (FMG) Chart
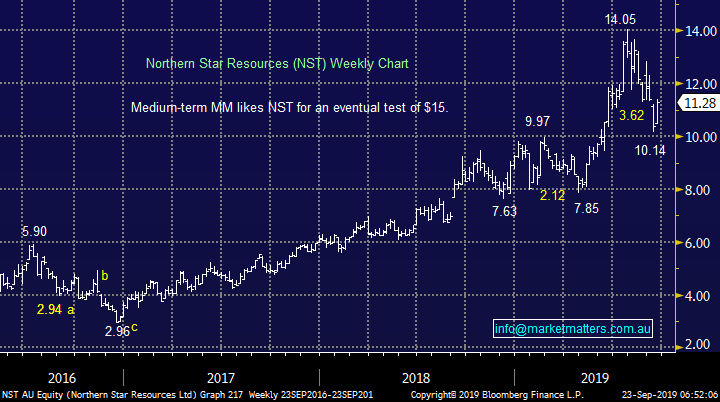
Secondly, Northern Star Resources (NST) which has recently corrected over 25%. We chose to go long Newcrest (NCM) and Evolution (EVN) in the sector into the recent pullback but NST was an alternative stock we considered. Technically we like NST with an ideal target in the $14.50-$15 region.
MM likes NST and the gold sector in the weeks ahead.
Northern Star Resources (NST) Chart
Lastly we are looking to do another video with Peter O’Connor (Rocky) in the next few weeks.
Question 5
“I notice the word “fading” is coming up quite regularly in your reports lately. Can you please tell us what the definition of fading is in the context it is being used now?” – Waz.
Hi Waz,
Thanks for a great question, its easy for us to get caught up in jargon and forget to some subscribers it might be like reading Latin, sorry!
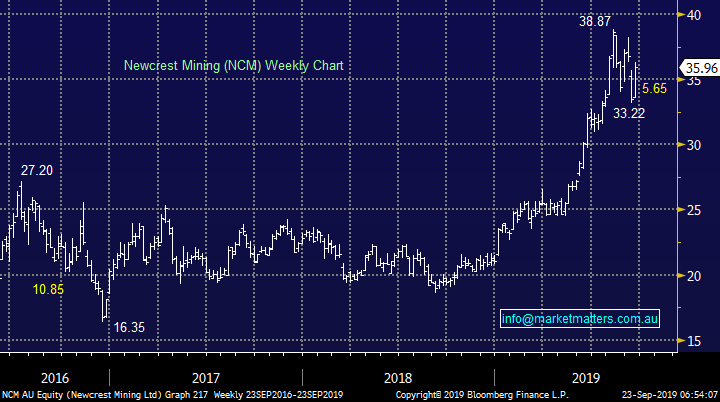
Fading simply means taking a position / action against the current market trend. E.g. if / when NCM makes new highs up towards $40 we intend to “fade” the move and take profit on our NCM position – fingers crossed that the plan becomes reality.
Newcrest Mining (NCM) Chart
Question 6
“Wheaton Precious Metals NYSE: WPM is one of the largest precious metals streaming companies in the world, what do you think of this type of company to invest in , is it safer than direct share investing, what are the disadvantages.” - Thanks Daniel C.
Hi Daniel,
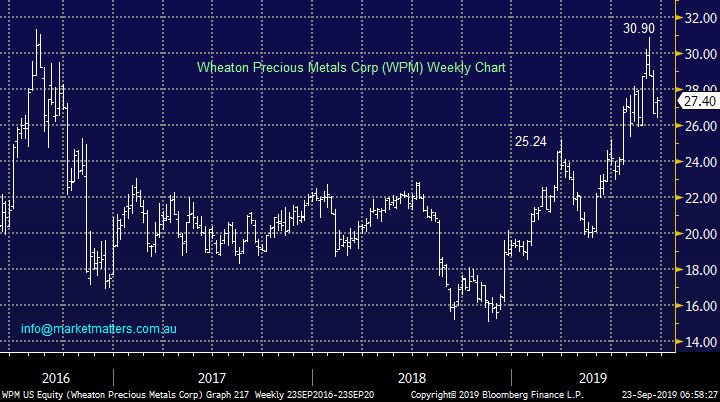
WPM is an interesting business, they purchase silver and gold production from mines that it does not own to serve customers worldwide – it’s the number 1 player in this space currently having agreements with 22 operating mines although ~50% of its revenue comes from Mexico, and 75% is from silver. The company effectively buys an option over a company’s production which bears fruit when the gold and especially silver price rallies.
The chart below shows a strong correlation with both the previous Newcrest Mining (NCM) and Northern Star Resources (NST) charts which makes sense because in effect they own gold mines, or at least the production thereof. There specific risk is more around the silver price and stability in Mexico, like all companies they carry their own idiosyncrasies hence spreading risk to a particular view / market usually makes sense.
MM likes WPM as we are bullish both silver and gold.
Wheaton Precious Metals Corp (WPM.US) Chart
Question 7
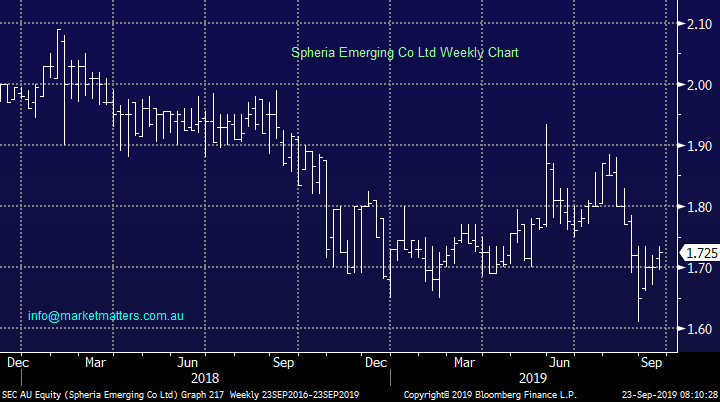
“Thanks for the continued excellent views on the markets and individual stocks. I have a couple of questions for the Monday morning Q&A, if I may. 1) When MM recommends selling a stock where the primary purpose is to increase cash (e.g. SGM, ABC, ORE) then if I consider my cash position at that point is OK for me, would MM also then consider keep holding those stocks in the absence of any new deleterious news? 2) My second question concerns the LIC trading under the code SEC. I see that at the end of August it was trading around $1.65 whereas its NTA was over $2.00. Does MM have any view on this LIC and why it is trading at such a discount to its NTA, please?” - Thanks and all the best. David H.
Hi David,
A great question which has probably been asked by a number of subscribers to themselves as opposed in today’s forum – I’m running out of time this morning to give you a proper answer so will keep it short.
1 – The answer is no, we prefer the stocks still hold in the MM Portfolio hence if the objective was not to increase cash we would then advocate switching into more of the stocks we are actually still holding.
2 – The bulk of LIC’s listed on the ASX are now trading on a discount to NTA with varying degrees. I’ll include on overview of this in a note soon, so its not an uncommon trend at the moment.
This LIC is currently paying a 4.6% fully franked yield but in short we feel more comfortable with our own stock picks.
MM is neutral SEC.
Spheria Emerging Co Ltd (SEC) Chart
Question 8
“Greetings MM Team,
Any thoughts on the risk posed but the upcoming reporting season in the US? Potentially lower earnings / lower forecasts are a sell-off trigger. Indeed, the market didn't rally on the last rate cut by the Fed (suggesting the market wants more), so it would be a good opportunity to throw a sell off tantrum to force the Fed into more cuts.
I'm curious why the discussion is talking about a rotation into cyclicals when it appears that the global economy is continuing to slow? Are you envisaging a rebound in economic growth sometime soon? The market expectation of further rate cuts seem to suggest a pick up in growth in not likely, at least in the short term. Although housing is picking up again (by adding more household debt) so we could be turning the corner - but if this is the case why do we need another cut? Well, as you suggested, unemployment ticked up and inflation is below target, so that supports the cut. Is it just me, or in there a disconnect somewhere here (rhetorical question)? I suggest it will be happy days for the 'shorters' and those looking to buy cheaper property, once we get to 0.5% official rates and: inflation doesn't rise; company earnings continue to fall; GDP continues to slow; and unemployment continues to rise. Suffice to say, I agree that you wouldn't want to be in growth stocks either.
Given the above, could you recommend any economical brokers / online trading platforms that provide trading long / short, for both direct stocks and EFTs, for the US market?” - Regards, Scott T.
Hi Scott,
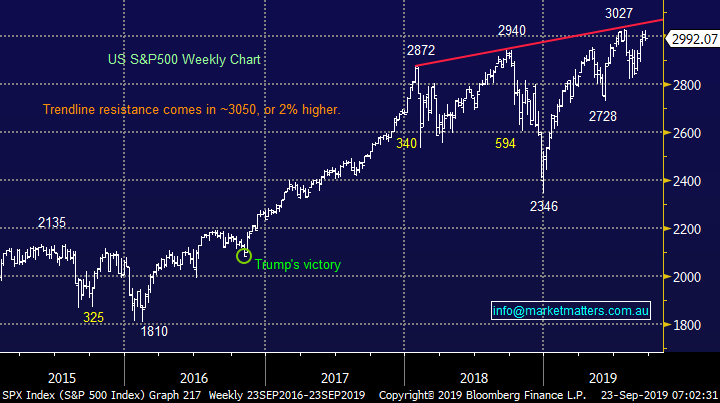
I know from your previous questions you are a touch bearish equities at the moment but at MM we would rather let the market tell us when to go short, on balance we still think the S&P500 will make a fresh all-time high up towards 3050.
We are talking / watching for a switch from growth to cyclicals because we feel the relative value will return to cyclicals when bond yields approach the end of their downside road – it’s been a multi-decade bear market but all good things come to an end. Also the RBA feels likely to embark on some fiscal stimulus as the ammunition runs out on the interest rate (monetary) front.
I do believe there’s likely to be another ~10% pullback in the next year but patience should help positioning however that’s also not a big call, we often see 10% corrections – at the appropriate time we will be looking to negative facing ETF’s as we did in Q4 of 2018.
US S&P500 Index Chart
Overnight Market Matters Wrap
• The US equity markets ended lower last Friday, following concerns reigniting between the US and China trade talks.
• Locally however investors are have been positioning themselves for an expected rate cut next week with the probability of 75% at present and the AUD 1c off its year’s low.
• BHP is expected to underperform the broader market after ending its US session off an equivalent of -0.21% from Australia’s previous close.
• The December SPI Futures is indicating the ASX 200 to open up 13 points from Australia’s previous close.
Have a great day!
James & the Market Matters Team
Disclosure
Market Matters may hold stocks mentioned in this report. Subscribers can view a full list of holdings on the website by clicking here. Positions are updated each Friday, or after the session when positions are traded.
Disclaimer
All figures contained from sources believed to be accurate. All prices stated are based on the last close price at the time of writing unless otherwise noted. Market Matters does not make any representation of warranty as to the accuracy of the figures or prices and disclaims any liability resulting from any inaccuracy.
Reports and other documents published on this website and email (‘Reports’) are authored by Market Matters and the reports represent the views of Market Matters. The Market Matters Report is based on technical analysis of companies, commodities and the market in general. Technical analysis focuses on interpreting charts and other data to determine what the market sentiment about a particular financial product is, or will be. Unlike fundamental analysis, it does not involve a detailed review of the company’s financial position.
The Reports contain general, as opposed to personal, advice. That means they are prepared for multiple distributions without consideration of your investment objectives, financial situation and needs (‘Personal Circumstances’). Accordingly, any advice given is not a recommendation that a particular course of action is suitable for you and the advice is therefore not to be acted on as investment advice. You must assess whether or not any advice is appropriate for your Personal Circumstances before making any investment decisions. You can either make this assessment yourself, or if you require a personal recommendation, you can seek the assistance of a financial advisor. Market Matters or its author(s) accepts no responsibility for any losses or damages resulting from decisions made from or because of information within this publication. Investing and trading in financial products are always risky, so you should do your own research before buying or selling a financial product.
The Reports are published by Market Matters in good faith based on the facts known to it at the time of their preparation and do not purport to contain all relevant information with respect to the financial products to which they relate. Although the Reports are based on information obtained from sources believed to be reliable, Market Matters does not make any representation or warranty that they are accurate, complete or up to date and Market Matters accepts no obligation to correct or update the information or opinions in the Reports. Market Matters may publish content sourced from external content providers.
If you rely on a Report, you do so at your own risk. Past performance is not an indication of future performance. Any projections are estimates only and may not be realised in the future. Except to the extent that liability under any law cannot be excluded, Market Matters disclaims liability for all loss or damage arising as a result of any opinion, advice, recommendation, representation or information expressly or impliedly published in or in relation to this report notwithstanding any error or omission including negligence.