Subscribers questions (CWN, SGR, ALU, WTC, APX, SUN, ALF, OSL)
Running slightly late this morning – my youngest daughter’s birthday today so stayed at home for presents. For those that have good memories, you’ll remember 5 years ago I made a Pepper Pig cake for my eldest Daughter’s 2nd Birthday and published a pic in the morning note. 5 years have flown by however I had another crack at the cake on the weekend – Mermaid inspired this time. I have made a few others over the years, a pool cake last year that a had a leak in it – and a Surfing Barbie cake the year before which was mediocre. I was happy with the Mermaid cake on the weekend!
This morning the ASX200 is set to open around 6035, basically where it closed Friday a week ago as the local market continues its holding pattern around the psychological 6000-area. Global equity markets look to have totally shaken off the recent Italian inspired concerns - the EU can survive and importantly stocks have remained resilient throughout. News this morning that CBA has reached a settlement with AUSTRAC ~$700m I think will be taken as a positive – it provides certainly and is sub $1bn as we were expecting.
The US tech-based NASDAQ that MM often refers to as the leader for international stocks is now only 1.4% below its all-time high following strong US employment data on Friday night – the January / February, volatility / bond yield driven, panic has already been forgotten by many major western indices.
- We remain mildly short-term bullish the ASX200 but the risk / reward is no longer exciting for the bulls – especially considering our medium-term view.
If / when the Australian banks can find some love (potentially this morning) we could easily match US stocks and challenge our 2018 highs as the broad market continues to hold together nicely.
This week we’ve again received some excellent questions with what feels like a record number of compliments, please keep both of these coming!
ASX200 Chart

Question 1
“Hi MM team, I have 2 questions – firstly your thoughts on Crown (CWN) both technical and fundamentally. Also, in a large correction for world markets which you are forecasting in the medium – long term, what happens to ETF’s? There a lot more in the markets than when the GFC hit, I am of the opinion they are going to get smashed more than high quality stocks, interested in your thoughts thanks” – Tim C.
Hi Tim, thanks for the 2 very different questions which I will obviously address separately.
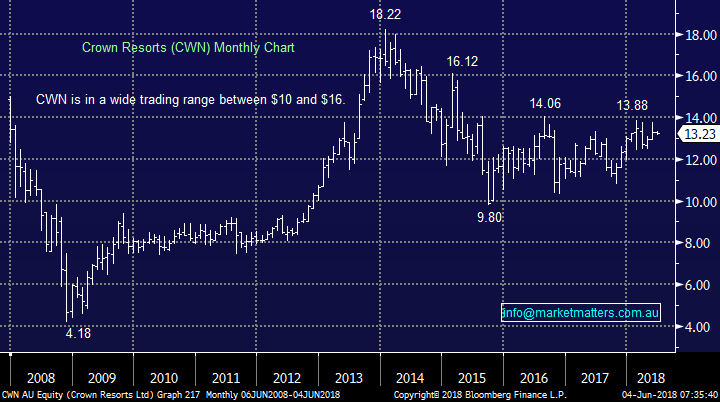
Crown (CWN) is Australia’s largest casino a position it will certainly cement when Crown Sydney is completed down at Barangaroo. Plus the new 323m high hotel being built in Melbourne will add to the company’s revenue moving forward. James Packer resigned from the board in March which allows the remaining directors to focus 100% on the business at hand. Recently CWN has focused its efforts in Australia as opposed to globally which we like with the domestic tourism statistics looking very healthy.
CWN is trading on ~25x estimated 2018 earnings while yielding 4.5% part franked. The market generally is unexcited about CWN in the nearer term, with analysts pretty neutral on the stock.
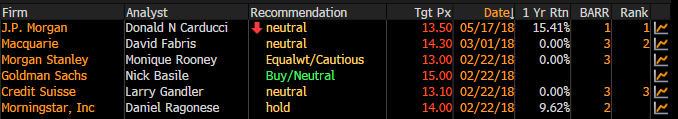
- Technically we are neutral CWN but we like the tourism thematic the company is exposed to. At this stage we would consider buying weakness.
Crown Resorts (CWN) Chart
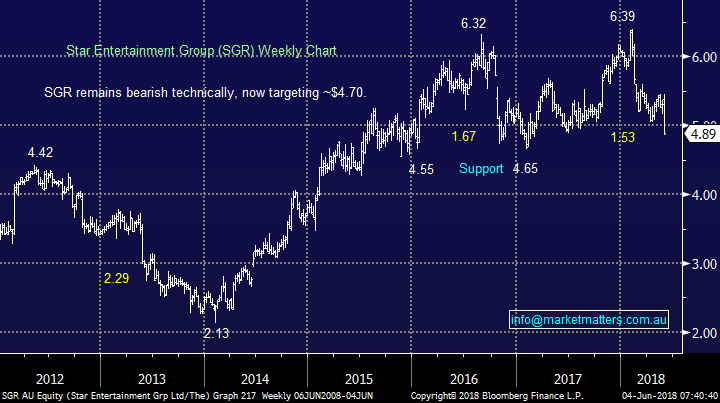
Conversely rival Star (SGR) is having a tough time and investors are probably concerned as to its future traffic when the new Sydney CWN casino opens. SGR is as would be expected “cheaper” trading on a P/E of 17x but the short-term negative momentum targets at least $4.50 before we would be interested.
Star Entertainment Group (SGR) Chart
Moving onto your second question around ETF’s. In short, I don’t fully agree with you but your second point within the question does have foundation.
- ETF’s are purely a representation of the indices / markets they represent thus if it’s an ETF looking to mirror the ASX200 the providers of the ETF will simply hedge any positions via the ASX200 SPI futures i.e. they hold no directional risk. Hence when the market falls if people then sell the ETF the provider sells the futures which creates arbitrage and a basket of shares that accurately represent the ASX200 are sold, the tracking would be extremely close i.e. the ETF would only have a minor tracking error v the basket of stocks.
- However when arbitrage occurs whole baskets of shares are sold into the market which “sorts out the men from the boys” because if there’s no appetite for a particular stock it will noticeably underperform because the selling can be large – and sustained.
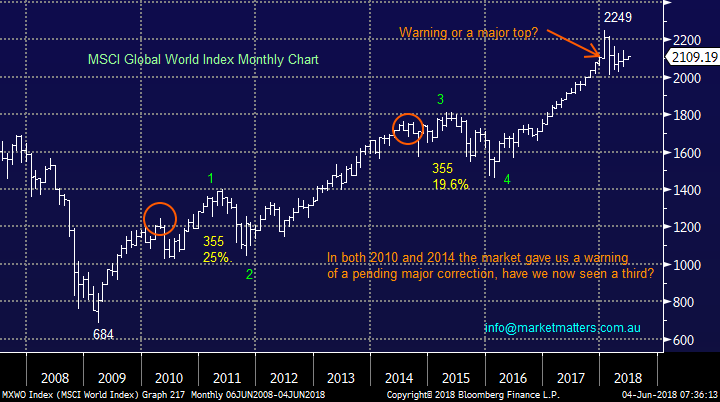
In simple terms, selling of an ETF will result in selling of the constituents that are in that ETF, quality or not. More ‘hot money’ in ETFs means that stocks can be sold simply because there is money coming out of an ETF for whatever reason, and vice versa on the upside. I do agree that the sheer weight of money in ETF’s is likely to accelerate market corrections moving forward – January / February volatility certainly agrees with that prognosis, however this invariably creates opportunity is stocks – the quality stocks you make mention can be sold down, therefore creating opportunity.
MSCI World Index Chart
Question 2
“Hi James and Co, Thanks for the straight-talking service, very refreshing. Hoping to make some serious money from next correction. Would appreciate you view on some tech stocks that have done well but seem to be faltering: ALU, WTC, APX. Thanks again” - Radley S.
Hi Radley, thanks for the question (s) I have given a brief thought on each.
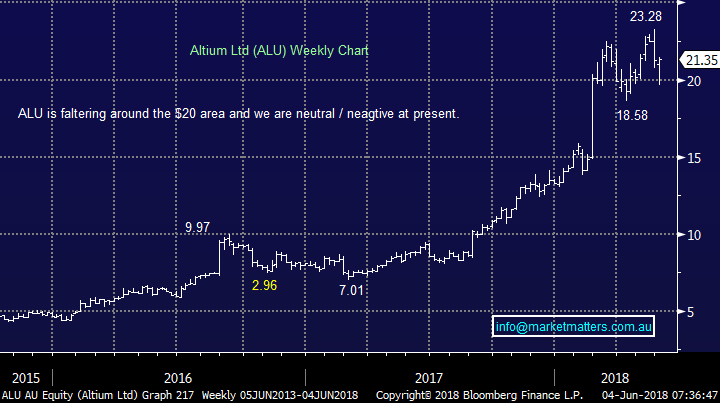
Altium (ALU) – ALU develops design automation for the Microsoft windows operating system and its clearly enjoyed a great rally in 2017-8 but it’s now trading on a very optimistic 55x valuation.
- We feel ALU is now likely to oscillate between $18 and $24 over the coming year, a 25% trading range, as the market waits to see if it can deliver the earnings that are now priced in – we would invest according to these ranges.
Altium Ltd (ALU) Chart
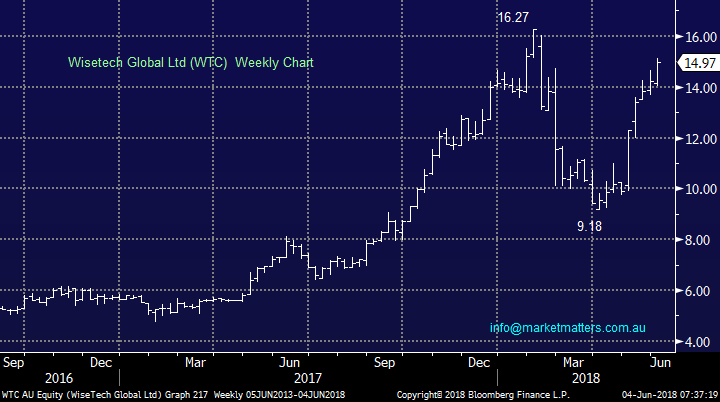
Wisetech Global Ltd (WTC) – WTC designs and develops cloud-based logistics software solutions. The stock is trading on a huge multiple, it’s simply all about growth moving forward.
The company has also been on the acquisition path as it looks to continue earnings growth – a slight concern to us but its founder-led and we love that.
The recent ~50% rally was courtesy of an earnings upgrade but prior to that the stock had tumbled over 40% = big volatility!
- At this valuation and with such large market swings in share price WTC is in the too hard basket for MM at this point in time.
Wisetech Global Ltd (WTC) Chart
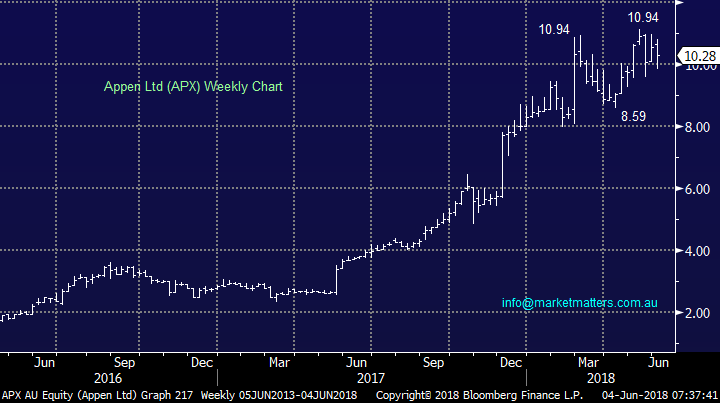
Appen Ltd (APX) – APX is a language search and social technology company which only trades on a valuation of 31x Est 2018 earnings – cheap compared to the previous two. The company benefits by a falling $A which has helped the share price recently.
APX is one of the best technology companies in Australia alongside both WTC and ALU but its share price looks ready for a rest as the earnings need to catch up with market optimism.
We would be buyers around $8 and sellers around $11 as the recent choppy price action looks likely to continue.
Appen Ltd (APX) Chart
Question 3
Hi MM - SUN was purchased on 26 Oct 2015 at $13.41 with a portfolio weighting of 12%. Today (31 May) the closing share price was $13.43, giving a capital gain of $0.02 for the two years and eight months held. Dividends received over this period totalled $2.95. Therefore the over 20% profit is almost entirely made up of dividends and essentially no capital gain. I calculate the Compound Annual Growth Rate (CAGR) to be 8.01%. If I project a dividend of say $0.40 in August and an optimistic share price of $15.00 (11.7% increase) at 31 December 2018 the CAGR is 10.36%. Either way the CAGRs are significantly lower than this financial year’s YTD return of over 13% and the previous year’s return of over 15%.
My questions are;
1. With the highest weighting in the portfolio of 12%, profit essentially dividends and no capital gain, why continue to hold and impacting the overall portfolio performance?
2. By continuing to hold, what do you consider to be the drivers that will revalue the SUN share price?
Thanks for the in depth Question Bill – a good way to start the week! I’ll address in two parts; Firstly, the return highlights the importance of dividends - in our opinion, dividends are the most reliable source of returns from a stock simply because dividends are not impacted by the level of the share market and they can act as a safety net at times of volatility. We hold SUN in the first instance because we saw little downside, and secondly because it had a very attractive dividend, held excess capital on its balance sheet and was likely to return some back to shareholders through special dividends. We’ve seen one, we should see more. Looking back over the last 20 years (to 1998) the typical volatility in returns from capital is around 12.5%, however in terms of income, it’s around 1%. Having a large weighting to a high dividend paying stock that importantly has more room to increase its dividend than cut it reduces overall portfolio volatility and obviously improves yield. Return should always be looked at through the lens of risk. The concept of risk v reward we often speak of.
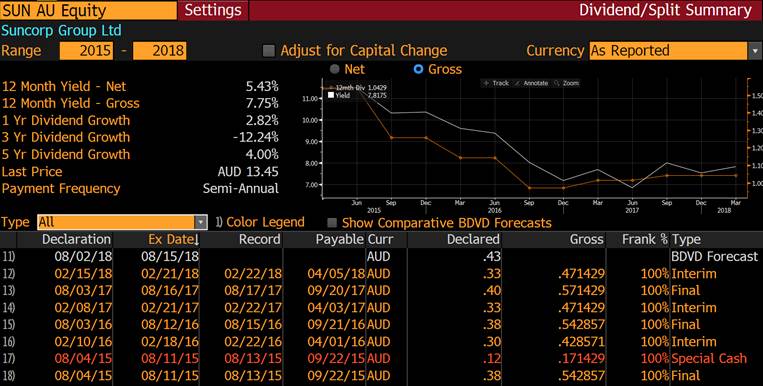
The second part off the questions is around future prospects. 1. They look better than the past as SUN has rejuvenated its bank, de-risked it’s insurance business, and importantly has excess capital (still) to return to shareholders. The macro backdrop of higher rates is also supportive of their insurance division. They have publically declared an Return on Equity Target of 10% for FY19, and if they achieve, which they are confident of, the stock should be trading above $15
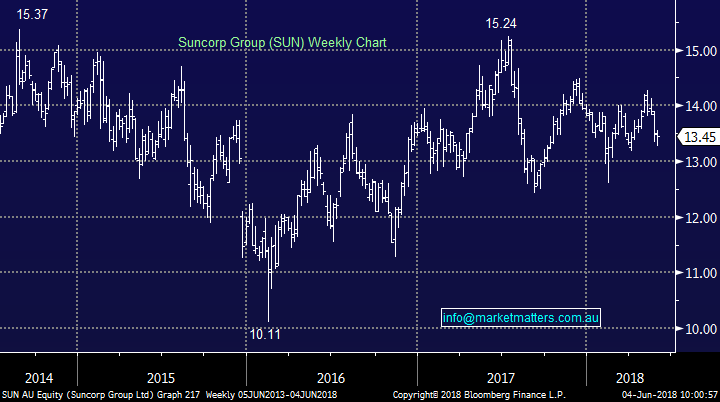
Technically, we remain bullish SUN targeting $15.50, however as stated previously, we’ll likely trim our position in stages around $15.
Suncorp (SUN) Chart
Question 4
“Hi, very interested in the selection of ALF as a 5% holding in the income portfolio. Stock is trying sideways at close to the buy in price with no dividends on the horizon. Stock purchased in Dec 2017 a long time after the last dividend was paid, I’m struggling to understand the rationale?
Am really enjoying the format of the daily newsletter & the way transparent relevant analysis is presented.” - Regards, Curt
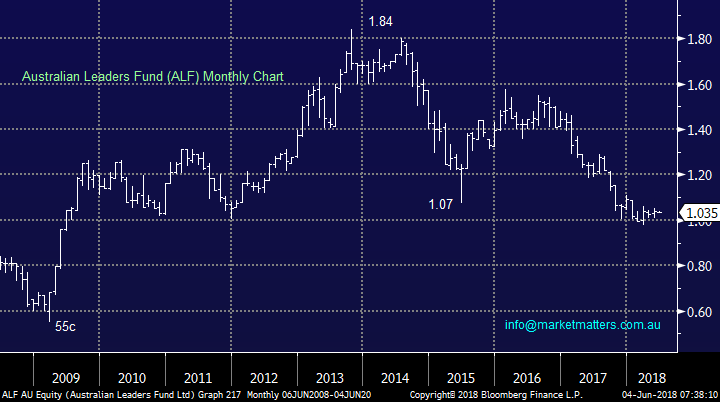
Morning Curt T, thanks for your question and very nice feedback. ALF is a listed invested company trading at a ~20% discount to the value of its assets – so it’s cheap. It’s cheap because performance has been weak – we’ve had a strong trending market, they are a market neutral fund so have struggled in 2017, although starting to improve in 2018. The other reason for the weakness in share price was frustration from yield investors – many bought ALF because of its high yield – that stopped paying so they sold, and that forced it a long way below NTA.
They obviously stopped dividends because they had no retained profits and therefore were not paying tax (which gave them no franking). Just before we bought it, signs were that retained earnings were building and that would result in dividends re-commencing. My thesis was that when they did, we’d get dividend flow and that in turn would force the narrowing between NTA and share price plus, they traditionally perform well in weak markets, and my view was that markets were susceptible to weakness.
Anyway, they gave a update in May and dividends are likely to re-commence at the full year – June 30 EOFY so potentially during August reporting. If that happens, I believe shares will re-rate closer to NTA.
Australian Leaders Fund (ALF) Chart
Question 5
“With regard to your comment before in a previous bulletin, is it meaningful to describe reversals of equity markets in terms of percentage calculated on the absolute high? (So far, we’ve only corrected 2.2% from the May 6146 high) Would it not be more meaningful to calculate the percentage of pullback based on the range of the most recent wave up?” – Thanks John W.
Hi John, a great question and the answer is we very much look at both, for example when we look at the ASX200 today:
- The ASX200 has corrected 3% from its May high – a useful statistic when we consider the average top to bottom retracement over May-June since the GFC – if the current pullback is complete it would be the shallowest on record since the panic of 2007-8.
- The market has corrected 43% of its rally from early April, no longer a short-term sell and potentially time to start accumulating.
Hence the 2 interpretations above are slightly contradictory but it’s rare when everything aligns perfectly.
ASX200 Chart

Question 6
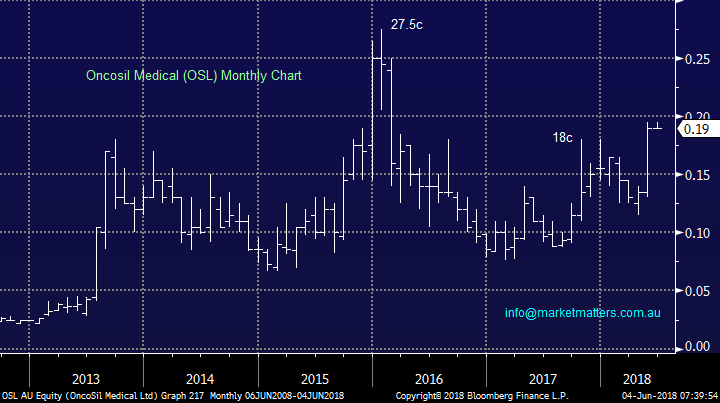
“Hi Guys, love your work! You covered Oncosil (OSL) back in March 2016 just after its 5-year high of $0.26. Over the last two years it has bounced around between $0.08 and around $0.14, and now shot to $0.19. What’s your read?” - Kind regards Mic W.
Hi Mic, you certainly love a “penny dreadful”!
I would only ever trade (not invest) in these style of stocks on a technical basis with qualified risk reward:
- I could buy OSL around todays 19c level but would run stops under 15.5c – note not one I will be “playing”, I prefer Fortescue (FMG) as discussed in the Weekend Report.
Oncosil (OSL) Chart
Question 7
“What is your view on the IPO WILSON GLOBAL FUND.” – Thanks Bill K.
Hi Bill, thanks for the easy question as we answered a very similar one in early May.
WAM Global will list this month and become the newest listed investment vehicle (LIC) by Wilson Asset Mgt. They are looking to raise between $330m and $550m with shares at $2.20 each. As an investor they will sit on cash unless they perceive market value plus no position will be above 5% of the portfolio. Overall we like their market philosophies and WAM have a strong track record, but at the end of the day with today’s exciting market we would rather invest ourselves.
Question 8
“Do you accept funds to manage?” – Thanks Mark O.
Hi Mark – yes we do. We will drop you a line shortly with details.
Overnight Market Matters Wrap
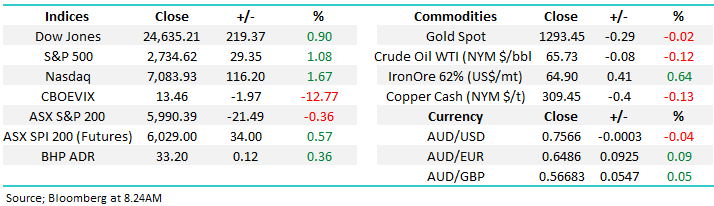
· The US started the first month of June higher across all major indices, with the broader S&P 500 rallying 1.08% after better than expected job data was reported.
· Commodities were mixed, with the oil price retreating on concerns of increasing supply with crude oil now trading at US$65.73/bbl. this morning. Base metals were slightly firmer as was the iron ore price, claiming back some of its recent losses.
· Locally, BHP is expected to open higher after ending its US session up an equivalent of 0.36%, while CBA is also expected to trade positively despite reporting a $700m provision in its Financial Year result.
· The June SPI Futures is indicating the ASX 200 to open 34 points higher, testing the 6025 level this morning.
Have a great day!
James & the Market Matters Team
Disclosure
Market Matters may hold stocks mentioned in this report. Subscribers can view a full list of holdings on the website by clicking here. Positions are updated each Friday, or after the session when positions are traded.
Disclaimer
All figures contained from sources believed to be accurate. Market Matters does not make any representation of warranty as to the accuracy of the figures and disclaims any liability resulting from any inaccuracy. Prices as at 04/06/2018. 8.24AM
Reports and other documents published on this website and email (‘Reports’) are authored by Market Matters and the reports represent the views of Market Matters. The MarketMatters Report is based on technical analysis of companies, commodities and the market in general. Technical analysis focuses on interpreting charts and other data to determine what the market sentiment about a particular financial product is, or will be. Unlike fundamental analysis, it does not involve a detailed review of the company’s financial position.
The Reports contain general, as opposed to personal, advice. That means they are prepared for multiple distributions without consideration of your investment objectives, financial situation and needs (‘Personal Circumstances’). Accordingly, any advice given is not a recommendation that a particular course of action is suitable for you and the advice is therefore not to be acted on as investment advice. You must assess whether or not any advice is appropriate for your Personal Circumstances before making any investment decisions. You can either make this assessment yourself, or if you require a personal recommendation, you can seek the assistance of a financial advisor. Market Matters or its author(s) accepts no responsibility for any losses or damages resulting from decisions made from or because of information within this publication. Investing and trading in financial products are always risky, so you should do your own research before buying or selling a financial product.
The Reports are published by Market Matters in good faith based on the facts known to it at the time of their preparation and do not purport to contain all relevant information with respect to the financial products to which they relate. Although the Reports are based on information obtained from sources believed to be reliable, Market Matters does not make any representation or warranty that they are accurate, complete or up to date and Market Matters accepts no obligation to correct or update the information or opinions in the Reports.
If you rely on a Report, you do so at your own risk. Any projections are estimates only and may not be realised in the future. Except to the extent that liability under any law cannot be excluded, Market Matters disclaims liability for all loss or damage arising as a result of any opinion, advice, recommendation, representation or information expressly or impliedly published in or in relation to this report notwithstanding any error or omission including negligence.
To unsubscribe. Click Here


