Subscriber Questions (TLS, NAB, JHG, PTM, WTC, SYR)
The news flow over the weekend was pretty consistent with the last few weeks as Donald Trump tweeted away about how China would be first to buckle in the trade dispute – I was actually watching a doco on Trump last night + glancing at a few of his tweets at the same time – just reinforced what a ‘unique character’ he actually is! Undoubtedly the markets will wobble pretty hard on trade war concerns but for now at least we are sticking with our short-term bullish view outlined in the Weekend Report on Sunday.
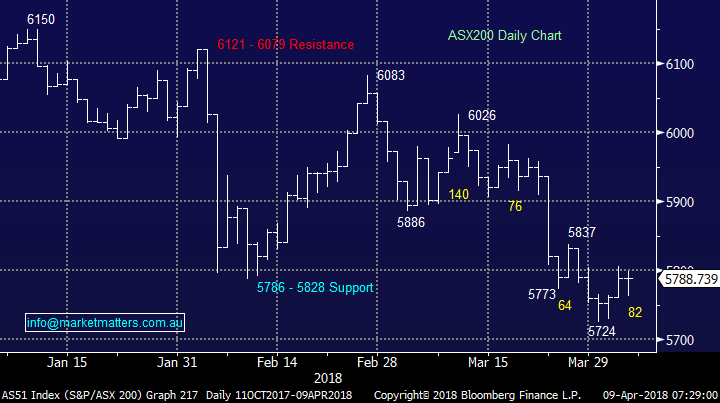
- We believe stocks are now trying to rally / looking for a low and from a trading perspective we would be buyers of any fresh lows towards the 5700 area by the ASSX200.
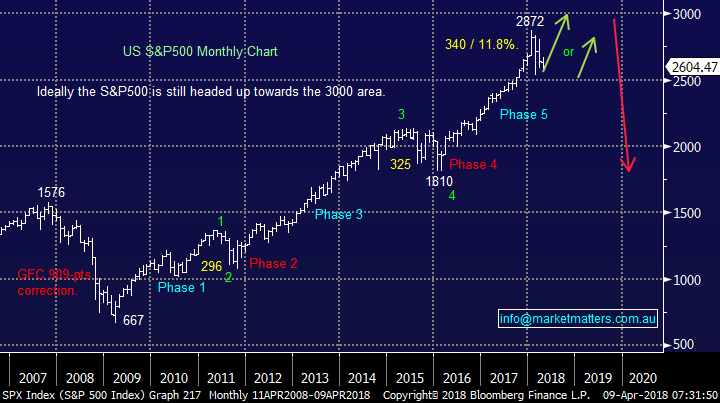
When we quickly look to the US who have to deal with President Trump on a number of levels in our opinion stocks are in a similar position to our own.
- MM believes US stocks are looking for a low and from a trading perspective we would be buyers into fresh lows for 2018 i.e. around 2% lower.
We have again received an excellent volume of questions for an Easter Period, I have answered 9 today with a many being very topical around the understandable concern towards equities.
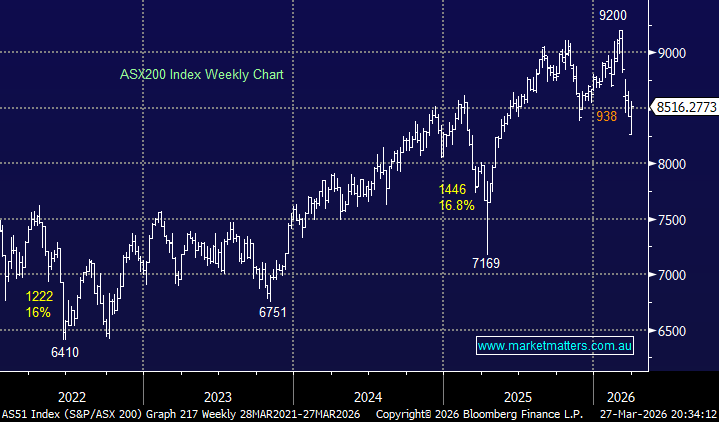
ASX200 Chart
US S&P500 Chart
Question 1
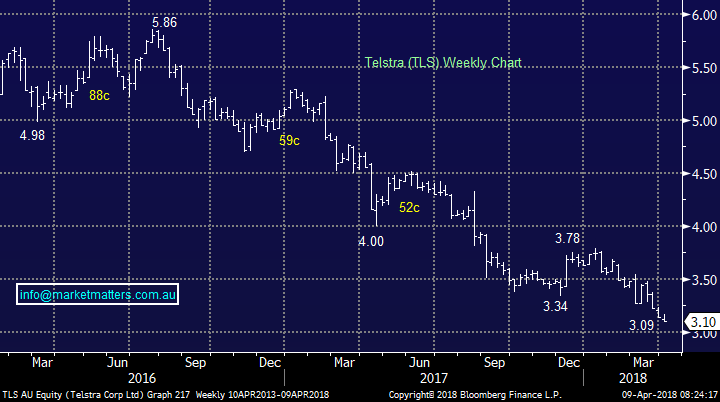
“A while back you said that you would consider buying Telstra under $3.20. It is now $3.11. Are you buying?” – Thanks Paul H.
Morning Paul, your pet hate TLS certainly is having an awful few years. I recall I had a conversation with you when it was trading at higher levels and you’ve certainly come out of that on the right side! The stock is down 47% since mid-2016 and we covered this in the Weekend Report - admitting that we should have taken profits on our entire position (rather than 50%) a few months ago - hindsight is always perfect and we have at least enjoyed a 11c fully franked dividend.
April has been the start of the last 2 meaningful rallies by TLS and we feel 2018 could be same, in addition TLS historically performs solidly when the ASX200 struggles giving us comfort in this period of uncertainty. TLS is currently yielding 7.1% fully franked but investors are now expecting this to again be reduced, we ask where these vocal pessimists were before the last big cut from 31c pa to 22c pa? – we certainly like the contrarian angle with buying TLS today.
- We are looking at averaging our TLS position today below $3.10
Telstra (TLS) Chart
Question 2
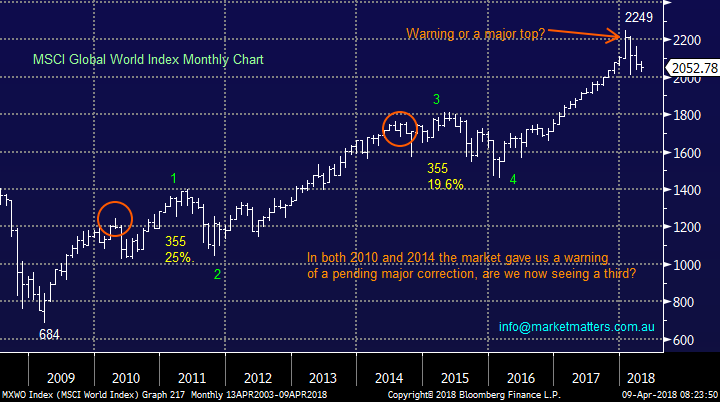
“Can you be more specific on what were the warning signs in the MSCI global in 2010 and 2014. Are you referring to the lows that occurred in 2011 and 2016? What sort of pattern do you look for as a precursor to a market drop? Is it just the pattern or its value range relevant?” - Thanks Chris G.
Hi Chris, thanks for a very topical question. When I say “warning signs” I am referring to the 2 initial corrections that stocks underwent before optimism returned to markets pushing stocks to fresh high back in 2011 and 2015 – I have circled these warning periods in orange on the chart below. Ideally the correction global stocks are experiencing since late January is another warning of what lies ahead i.e. one final push to fresh highs prior to a very meaningful correction. At MM we are currently positioned for this outcome as opposed to an aggressive pullback from Januarys high.
MSCI Global World Index Chart
Question 3
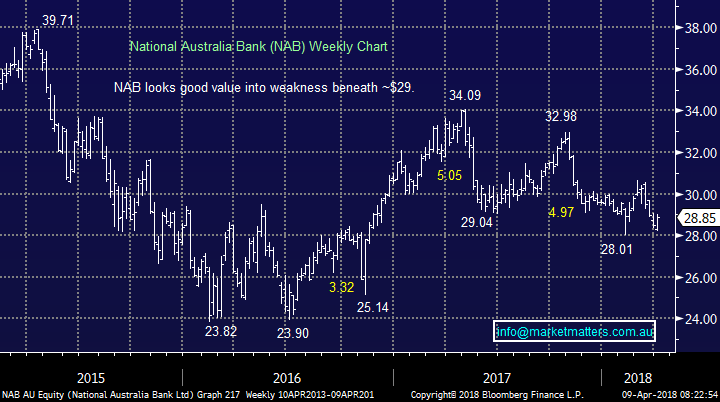
“Elsewhere NAB is yielding 6.86% fully franked and for those who buy next week its almost 9% p.a. fully franked over the next 14-months. Why next week? I thought any time up to the ex div date of May15 would be fine.” – Thanks Chris.
Hi Chris, you are correct, an investor can buy at any time up to the expected ex div date of May 15th. However we have no guarantees as to where the NAB share price will be in one months’ time whereas its likely to be around $28.50 this morning following the Dows plunge on Friday night, hence yielding over 9% fully franked between this morning and mid-May 2019.
National Australia Bank (NAB)Chart
Question 4
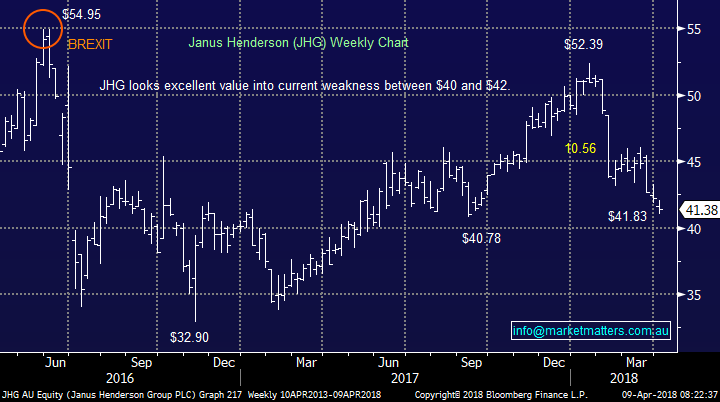
“My comment / question relates to the dismal performance of Janus Henderson (JHG). I note it's at basically a 6-month low. In the Feb 26 report your optimism suggested March / April may see some pick up. Do you still consider this a possibility?” - Cheers Bruce M.
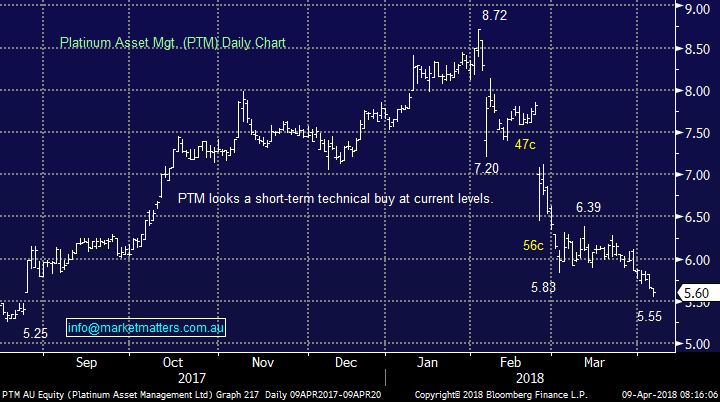
Hi Bruce, unfortunately you are correct and JHG has had an awful start to 2018, along with the whole Diversified Financials which are down -8.4% over the last month led by AMP -10.4%, Perpetual -12.5% and BT Investment -12%. When compared to this list JHG has been ok but paper losses are still paper losses and we don’t like them! However we have been watching Platinum (PTM) closely as its tumbled ~24% for a trading opportunity for the brave. We would now be aggressive technical buyers of PTM ~$5.50 looking for a 15% rally – interestingly most of the sector has a very similar look / feel to it.
Hence while we don’t believe it’s prudent to increase our exposure to JHG and Macquarie Group (MQG) in the sector, or buy PTM for that matter given our current exposures, we are not panicking out at current levels seeing a likely 10-15% rally by the sector from here. In short, we’d be buyers if we didn’t already own.
Janus Henderson (JHG) Chart
Platinum Asset Mgt. (PTM) Chart
Question 5
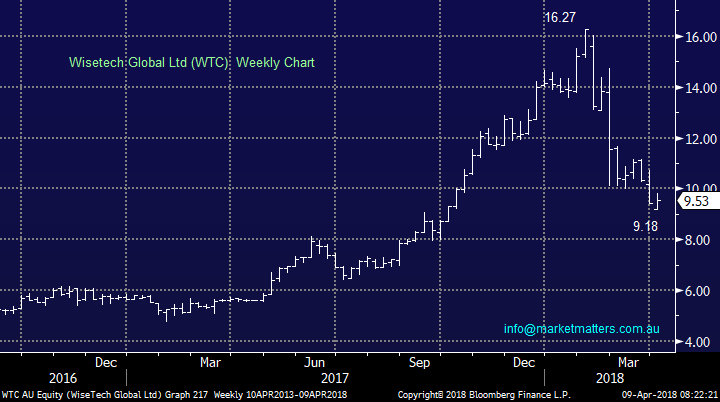
“A question you may wish to answer in tomorrow’s newsletter. Is Wisetech (WTC) a buy down around $9.30 – $9.50” – Thanks Graeme D.
Morning Graham, for those not familiar WTC the company designs and develops cloud-based logistics software. Even after the significant correction WTC is trading on as huge multiple (66x 2018 earnings) while paying a 0.22% fully franked dividend – so therefore it all comes down to the likely growth in earnings moving forward. Like many ‘in vogue’ stocks, the market becomes very glass half full about earnings and the stock rallies, partially on an uptick in earnings but mostly on a PE rerating. As the business matures these earnings can often be revised lower which has been the case with Wisetech. A high PE stock is higher risk for the same reason that it was bid up hard in the first place, given not only does the share price get hit on lower earnings, it gets hit with a big re-rating in terms of the multiple of those earnings the market is prepared to pay.
WTC Earnings Estimates (Red) v Share Price (White)
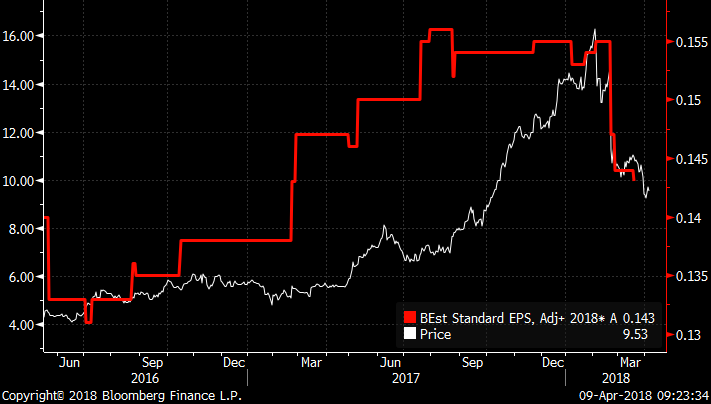
We have not invested in WTC previously and we do not find it very compelling at the moment primarily due to our concerns of companies with high valuations in a rising interest rate environment.
However technically we can see WTC bouncing over $11 from current levels, or 15% higher.
Wisetech Global Ltd Chart
Question 6
“Hi, I found your article interesting on how one might respond to the Franking Credit proposals. Just another comment about the inequity. It is only Commonwealth part & full pensioners who are to be exempt. SMSF pensioners are exposed, although those who have high balances above $1.6m could use franking credits on the excess which is taxed at 15%. Hence those sandwiched in between lose out at the company rate of 30% paid by their investments.” – Regards Jack F.
Thanks Jack – yes you’re certainly correct. We made mention of the ‘age pension’ which was implying a Govt pension – those in pension mode in their Super Fund will not comply. While I think a change to the taxation system to incentivise Australian companies to invest in growth (rather than simply pay income) is worthwhile, I don’t believe this is a smart way of doing it.
Question 7
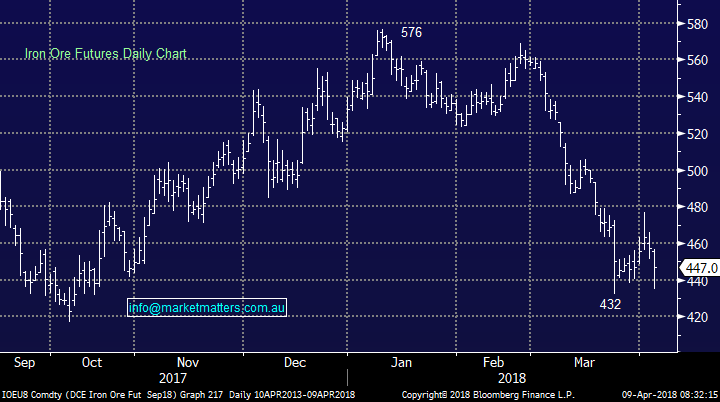
“Hi Interested in your thoughts of iron ore at these levels?” – Thanks Nathan I.
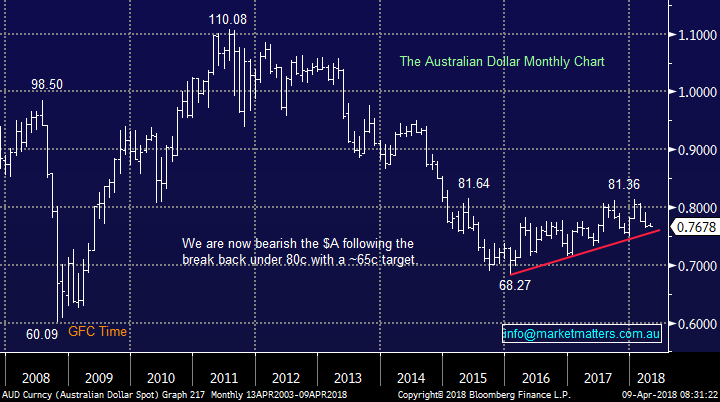
Morning Nathan, iron ore has certainly had an awful 2018 tumbling well over 20%. I can see a month or two of consolidation between say 420 and 480 in terms of the Futures contract but I am concerned as to the long term outlook when I switch my attention to the little “Aussie Battler”. One of our strongest views for 2018/9 is that the $A will eventually test the 65c area against the $US and so far we have seen nothing to alter this opinion. Our concern is the $A is highly correlated to the iron ore price as its one of our largest exports from the likes of BHP, RIO and Fortescue. This week we’re starting to see divergent views from analysts towards say BHP and RIO, with BHP being rated more highly given it’s diversified approach.
Hence I would call ourselves short-term buyers of the iron ore but medium term sellers which is not a good news for our important resources sector.
Iron Ore Chart
Australian Dollar ($A) Chart
Question 8
“Hi James +Co, just wondering if you have a "plan B" in place if we don't get the bounce you are expecting. Is there a level below which you would bail out? Also, for us nervous nellies, is it appropriate to dollar cost average out when you feel we are getting close to a market level you believe to be near the top?” - Thanks for your ideas, Radley S.
Hi Radley, two excellent and topical questions which I’m sure a lot of subscribers are asking themselves – as we constantly do.
1. Considering we see a further 15-20% downside for stocks if we have already seen the top of the post GFC 9-year bull market there remains plenty of time to increase cash levels, position ourselves negative stocks via say ETF’s, plus consider more defensive positions within stocks themselves. Rather than be specific around a level at this point in time where we would “bail out” we would be looking at a number of indicators / signs to redesign our investment portfolio – alerts will obviously be flying if / when this occurs.
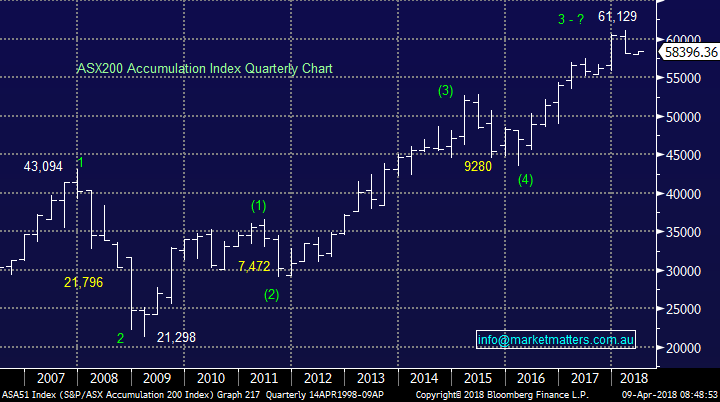
2. The simply answer in our view is yes to averaging our market exposure, just like we average into anticipated market bottoms. Picking exact tops and bottoms is pure luck and it makes far more sense to gradually sell into strength if this does unfold in 2018. Remember:
- “I will tell you my secret if you wish. It is this: I never buy at the bottom and I always sell too soon.” – Baron Rothschild
ASX200 Accumulation Index Chart
Question 9
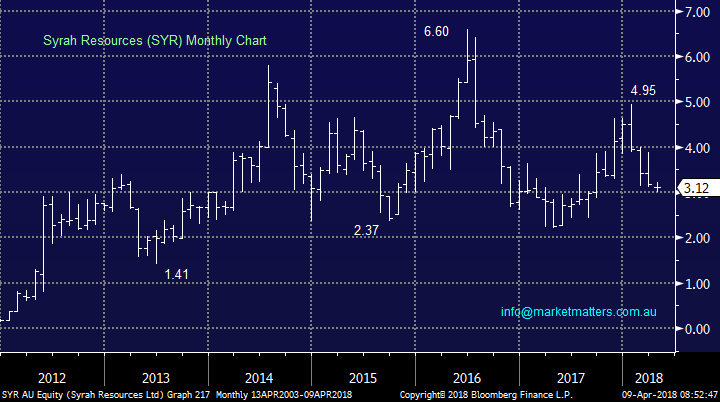
“Hi James, Firstly, love your daily updates. Very informative. My question is about short selling and how stocks can break through. Take Syrah Resources (SYR) for instance. Company seems strong but I gotta say, it’s a pretty stressful stock to hold. Does it fundamentally come down to the fundamentals or is there a technical aspect to this that I’m missing?” - With thanks Troy H.
Morning Troy, the professional market certainly does not believe the SYR story with 20.6% of its stock sold short. I would be wary taking on the hedge funds that aggressively short sell stocks because they are right more often than wrong and they certainly are taking a big stick to mineral exploration company SYR.
When I was starting out a very wise person once told me that a mineral exploration company is simply a believable guy/girl standing at the top of a pit telling a good story. At the start there are those who simply believe the story and buy early while there are those that wait to see the story is coming to fruition. At the vortex of share price growth, the majority are now ‘believing’ the story. The risk though is at its peak when a miner has huge expectations built into the share price while they’re starting / about to start production. This is often the ultimate test of whether or not the story has substance. It’s also the point of most variables and the short positon in SYR shows the market now sees a lot of opportunity where it can go wrong.
Simply at this point the company needs to come out with some news to prove the market is wrong, the only solace I can offer at the moment is the short position is unlikely to increase above 20%. Sorry Troy but we are neutral SYR at best seeing no real reason to buy the stock.
Syrah Resources (SYR) Chart
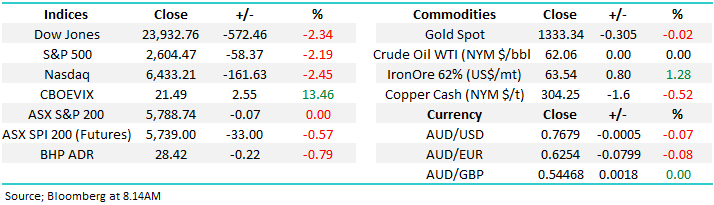
Overnight Market Matters Wrap
· Stocks sunk to close out the week as a combination of potential trade war and disappointing jobs data gave traders little cause for optimism. The 2.3% decline on the Dow Jones saw the index now back into correction territory, off more than 10% from January’s all-time highs.
· President Trump threatened to slug $100B worth of imports from China with further tariffs. Payroll numbers at 103,000 came in well below expectations of 180,000 and held the unemployment rate steady at 4.1%. A slight uptick in wages growth, however, was enough for the Fed to reiterate their path of gradual rate increases over the year.
· Volatility is certainly back, with the Dow Jones trading in a 400 point range 22 times already this year, compared to just once for the whole of 2017. Reporting season kicks off in the US this week, with analysts expecting 18.4% profit growth in Q1, mainly due to newly passed accommodative tax policy.
· The June SPI Futures is indicating the ASX 200 to open 34 points lower towards the 5755 level this morning.
Have a great day!
James & the Market Matters Team
Disclosure
Market Matters may hold stocks mentioned in this report. Subscribers can view a full list of holdings on the website by clicking here. Positions are updated each Friday, or after the session when positions are traded.
Disclaimer
All figures contained from sources believed to be accurate. Market Matters does not make any representation of warranty as to the accuracy of the figures and disclaims any liability resulting from any inaccuracy. Prices as at 09/04/2018. 8.26AM
Reports and other documents published on this website and email (‘Reports’) are authored by Market Matters and the reports represent the views of Market Matters. The MarketMatters Report is based on technical analysis of companies, commodities and the market in general. Technical analysis focuses on interpreting charts and other data to determine what the market sentiment about a particular financial product is, or will be. Unlike fundamental analysis, it does not involve a detailed review of the company’s financial position.
The Reports contain general, as opposed to personal, advice. That means they are prepared for multiple distributions without consideration of your investment objectives, financial situation and needs (‘Personal Circumstances’). Accordingly, any advice given is not a recommendation that a particular course of action is suitable for you and the advice is therefore not to be acted on as investment advice. You must assess whether or not any advice is appropriate for your Personal Circumstances before making any investment decisions. You can either make this assessment yourself, or if you require a personal recommendation, you can seek the assistance of a financial advisor. Market Matters or its author(s) accepts no responsibility for any losses or damages resulting from decisions made from or because of information within this publication. Investing and trading in financial products are always risky, so you should do your own research before buying or selling a financial product.
The Reports are published by Market Matters in good faith based on the facts known to it at the time of their preparation and do not purport to contain all relevant information with respect to the financial products to which they relate. Although the Reports are based on information obtained from sources believed to be reliable, Market Matters does not make any representation or warranty that they are accurate, complete or up to date and Market Matters accepts no obligation to correct or update the information or opinions in the Reports.
If you rely on a Report, you do so at your own risk. Any projections are estimates only and may not be realised in the future. Except to the extent that liability under any law cannot be excluded, Market Matters disclaims liability for all loss or damage arising as a result of any opinion, advice, recommendation, representation or information expressly or impliedly published in or in relation to this report notwithstanding any error or omission including negligence.
To unsubscribe. Click Here