Subscriber Questions (TCL, KDR, ORE, CBA, AWC, RMD)
The news flow over the weekend was relatively light but not surprisingly it did not go too far beyond trade wars and unfortunately cricket. Two things caught my eye that were net positive but President Trump was probably playing golf and we all know it’s his comments / plans that are creating the major fireworks:
- US Treasury Secretary Steve Mnuchin said he’s optimistic the US can reach a trade agreement with China.
- The US and South Korea have agreed to an agreement on trade including compromise on the volume of steel Korea sends into the US.
It remains our opinion that the last few weeks have been classic Donald Trump negotiating i.e. go in hard banging your chest followed by strong negotiation to the get the best deal – sounds like “The art of the deal” by you know who!
Overall we agree with an article on Bloomberg on the weekend by US giant JP Morgan – US stock conditions remain favourable with inflation and the Fed throwing up no surprises which leaves a trade war as the major market risk, no surprise there.
- However, we believe that the volatility to the downside in both February and March tells us equities have reached / are close to fully valued hence any risks of bad news has a significant impact.
We have again received a record number of questions this week, I have answered 15 today but please excuse the brevity at times. Thanks – keep them coming!
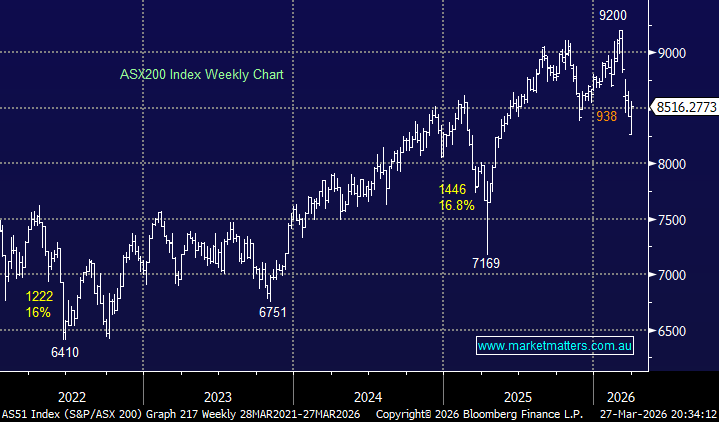
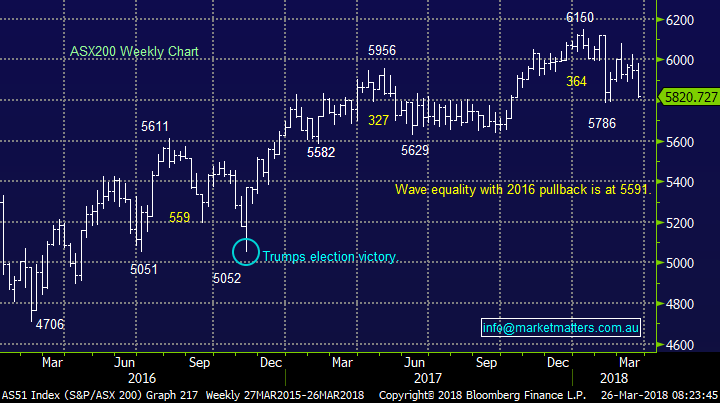
ASX200 Chart
Question 1
“Hi, Given the potential for a bear market are you able to comment on BEAR / BBOZ to hedge a portfolio. It seems a quick way to take insurance on the market at the moment, rather than selling and rebuying equities. I'm aware that such positions would need to be under careful consideration and reversed if market steadies.” – Thanks Denis W.
Morning Denis, an excellent and as you point out extremely timely question.
Our simple answer is yes, there is definitely an opportunity to hold negative market exposure via BEAR / BBOZ ETF’s while still holding a portfolio. With say for example NAB yielding 6.83% fully franked it feels a bad time to panic out of the “Big four banks” which makes up a significant portion of the ASX200.
So far we have only sold stock when it has reached our targeted areas like Kidman Resources (KDR), Iluka (ILU) and Orocobre (ORE), if / when were convinced the market is headed down say 15% we are likely to implement a combination of selling stock and hedging at the very least by buying bearish facing ETF.
ASX200 Chart
Question 2
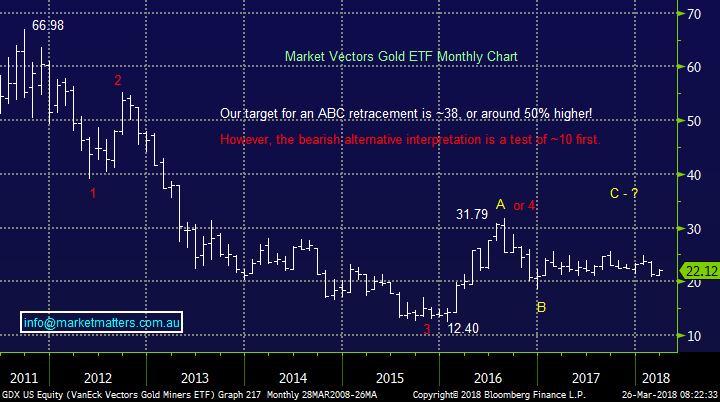
“A question for your Monday comments: Since the market is now so jittery, and the doom and gloom merchants are becoming ever louder, is it timely to get back into gold stocks? Is so which are your preferred investments?” – Thanks Richard C.
Morning Richard, a very interesting question in today’s uneasy market environment.The answer is probably not, we see gold as a 50-50 play at best especially if things calm down and global interest rates continue their ascent. As touched on in question 1 if we believe that markets are in trouble we would rather use negative facing ETF’s as opposed to gold stocks that really only rally if markets fall e.g. Australian heavyweight Newcrest is down -9.1% over the last month. A rising $US would also be a negative for Gold.
Market Vectors Gold ETF Chart
Question 3
“You wrote on the weekend - We see global equities unfolding in one of 2 very different scenarios moving forward etc……Hmmmm....... If you were to do the weather, it would sound like "It's gunna be wet if it rains". I expect a bit more confidence, one way or the other, in your predictions. You are making me very nervous. But I am hanging in there so far....... hope that is the right move.... ?????” – Waz
Hi Waz, I definitely understand your thoughts but markets basically go in 3 directions – up / down and sideways with the sideways the most dominant direction from a time perspective. Hence it’s not surprising that we are often going to be neutral or in this weekend’s case have 2 scenarios which we see unfolding. We have been preaching for the last few months that markets are entering a period where volatility is likely to increase hence investors must remain open-minded. All we are asking today is that people remain both open-minded and flexible because these are exciting times but most definitely not the time to assume anything.
We undoubtedly feel a little uncomfortable with our market exposure at present although as you know we have not pressed the panic / eject button. As we said on the weekend:
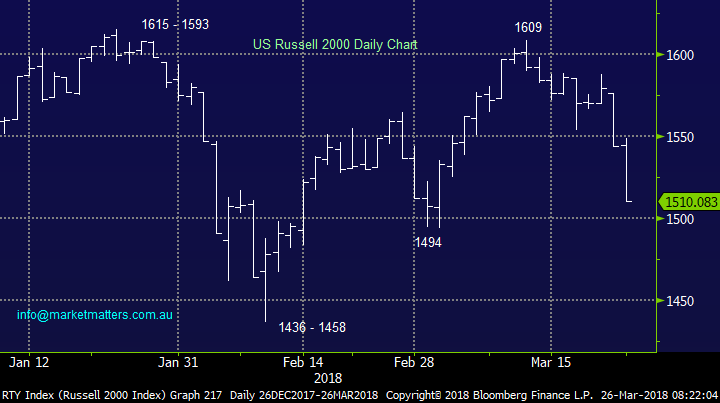
- Scenario 1 – Stocks are close to a decent low and should hold reasonably close to recent Februarys lows before rallying back towards January’s highs at the very least.
- Scenario 2 – Equities have topped for a few years and acceleration down should continue over the coming weeks – our ultimate target would be at least 20% lower.”
US Russell Index Chart
Question 4
“Hi MM, could you answer a couple of questions for me? Thanks David H.
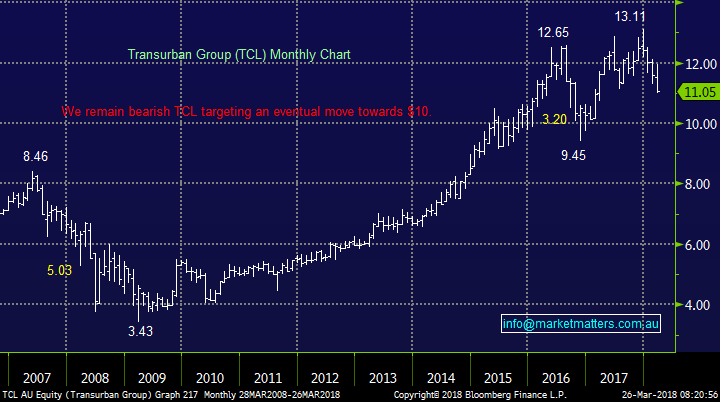
1 TCL, hold it with a view to sell into the rise as it gets close to results announcement midyear. Now slightly below my buy price. Hold or sell?
- We have been bearish TCL and the yield play” since the start of 2018 and see no reason to change our outlook.
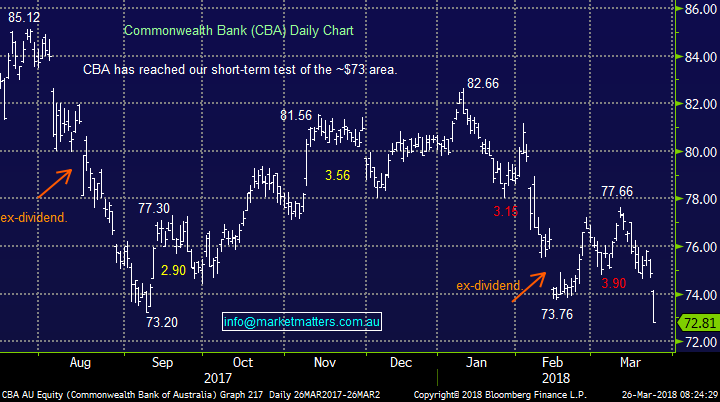
2 TLS and CBA, are we at a re-entry point or do we wait for a bottom to establish?
- As we have said in a few reports recently MM believes both TLS and CBA are at levels where they could be accumulated into further weakness from Fridays levels i.e. TLS $3.22 and CBA $72.81 – at least for short-term positions.
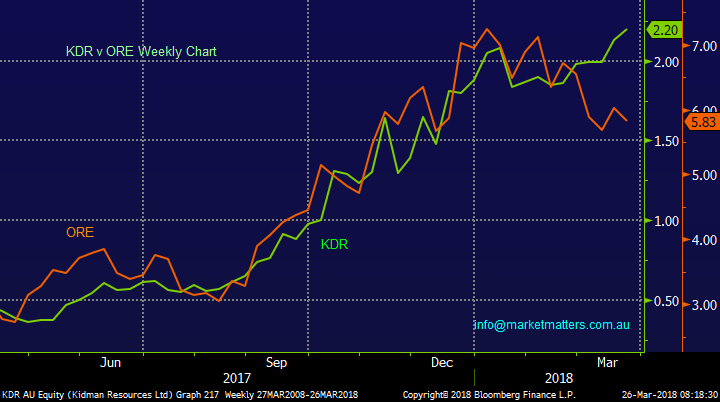
3 KDR, sold this week, do you have a suggested re-entry point? Will recent announcements and price targets dissuade short selling or is the price likely to come back if the market pulls back?”
- We like KDR but see better value in ORE at current levels as is illustrated by the chart below. I can see the short-selling in KDR subsiding following recent bullish announcements.
Transurban Group Ltd (TCL) Chart
Kidman Resources (KDR) v Orocobre (ORE) Chart
Question 5
“Hi guys, a question for Monday. You have been calling CBA to fall from around $77 to around $73, which it has. Why then would you continue to have it as a buy in your portfolio. Surely selling at $77 and rebuying at $73 would be as good as buying at $77 and selling at $81?” – Neil W.
Morning Neil, you are 100% correct in hindsight, our actions / lack thereof were based on the below:
1 Seasonally - Over the last 10-years CBA is up close to 7% during March / April.
2 Negatives – the chart pattern as you said implied CBA could reach ~$73 plus we had the uncertainty of the Royal Banking Commission.
Hence when we combined the above we decided to sit on our hands, if the same circumstances had occurred going into May when CBA usually falls ~-4% we would have very probably sold out all / some of our CBA / banking exposure.
Commonwealth Bank (CBA) Chart
Question 6
“Hi James, once again thanks to you and the team for the MM material. Back in Sept last year you shared a video update with Peter O'Connor regarding his thoughts and analysis on resources. Six months on and the resources landscape looks to be changing, I was wondering if MM could do an update with Peter to get his views on how he sees resources (Fe, Cu and Al) tracking over the next 6 months?” - Thanks, and Regards, Jan
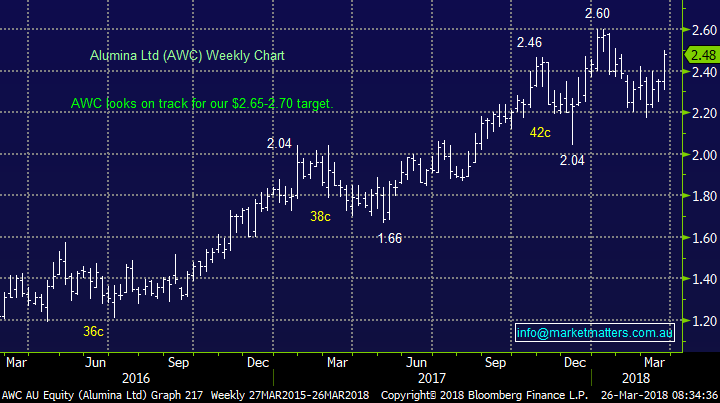
Hi Jan, a great thought and I’ll get Peter back on for a run down on his views now. One of his key bullish calls at present is AWC, which we hold, with a target ~8% higher.
Alumina (AWC) Chart
Question 7
“Assuming some stocks such as the banks may be approaching a threshold that you would want to buy for yield, would you consider put options as a method to buy shares at the prices you want and slightly reduce your entry price? Or conversely take small profits on positions that don't meet your threshold.”- Regards James D.
Morning James, a question for the more sophisticated investor who looks to use options to improve their portfolios performance.
This idea, which in principle I like, can be approached in 2 different ways:
1 Sell puts at levels an investor is happy to purchase the shares, and the investor will keep the premium if they stay above those selected levels.
2 Buy stock and sell calls (buy / write) which may suit some people more as we enter May when ANZ, NAB and WBC trade ex-dividend.
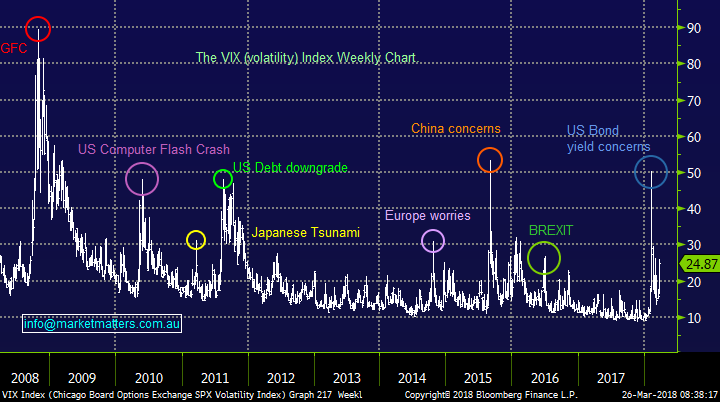
Rather than go into details here if any subscribers want further help / information on options please contact me directly through the MM email – we run a very busy options desk - thanks James G.
Volatility / Fear Index (VIX) Chart
Question 8
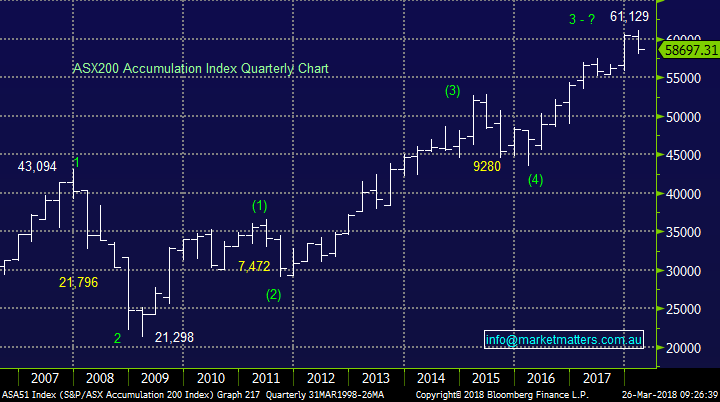
“Hi James, this is the first time I have come across the ASX100 Accumulation Index Chart. Can you clarify what it is and how to interpret it?” - Thanks Chris.
Hi Chris, Simply the accumulation index assumes all dividends are re-invested.
ASX200 Accumulation Index Chart
Question 9
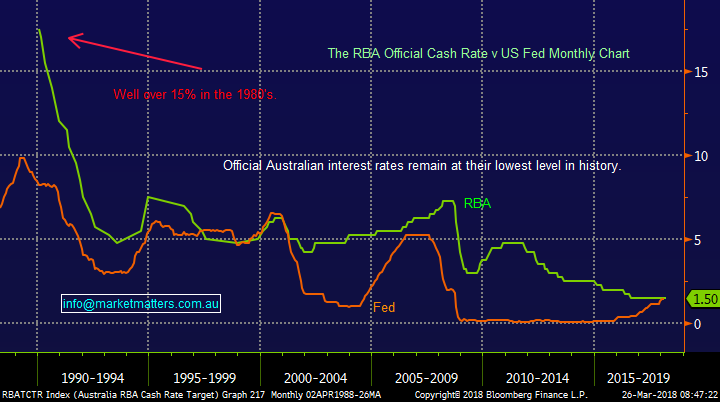
“Hi, Thanks again for your excellent insights delivered clear and concisely. Just wondering whether the chart shown in this morning’s report of Oz v US interest rates would be better if the rates where on the same scale so we could see the relativities and actual cross over points better.” - Regards Peter L.
Hi Peter, your wish is my command, see below.
Australia’s RBA Cash Rate v US Fed Rate Chart
Question 10
“Hi James, I look forward to reading your reports each day and the insights they offer. I have a query regarding the CBA hybrid offer currently open. I accepted the recent offer from Westpac for their WBCPH which around 2 weeks after listing they are now trading at $98.00. Do you think that the new CBA hybrid will trade under or over $100 in the short term? Regards Paul B.
Morning Paul, thanks for the kind words.
Theoretically, CBA will trade under the $100 when it lists if all things remain as they stand. The WBCPH was issued at 3.20% over the bank bill rate, while the CBA was issued at 3.40% over. If WBCPH was trading at $98.80 the CBA Hybrid would be worth $100. At $97.98, the WBC hybrid is trading on a margin of 3.53% over swap, which pretty much seals the fate of CBA to open below $100…somewhere around $99 would be my estimation.
Question 11
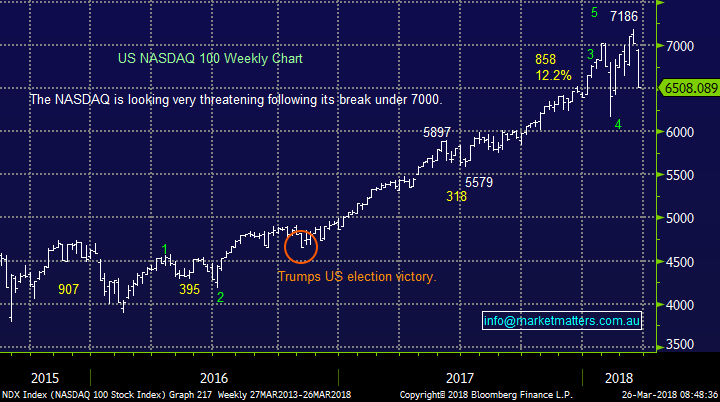
“Hi guys, what is your technical view of the Nasdaq?” – Thanks Sean C.
Hi Sean, as you probably know we lost our bullish stance when the NASDAQ broke back beneath the 7000 level, already 7% ago!
From here we would expect an eventual test of the 6200 area before its make our mind up time i.e. around 4% lower.
Our “best guess” for what follows would be another assault over 7000 before its time to again look for sell areas but clear risks are looming to the downside now.
NASDAQ Chart
Question 12
“Just saw the email about, "Views at a Glance". The link did not find it. Where do we find, "Views at a Glance" in MM? Be great if someone would update Top 10 ideas every week, rather than every few months. You used to include some short-term trades with entry/exit anticipated profit %. Can you bring this feature back? Love the website up to date information and commentary.” - Regards Geoff
Morning Geoff, a great and well timed question. We intend to survey our subscriber base in the coming weeks to improve our offering, the ideal forum for such questions.
Please answer the survey so we can take our service to the next level, thanks James.
Question 13
“A few weeks ago, I sent you a suggestion to compile a list of commonly-used abbreviations in Market Matters bulletins (exclusive of stock codes). To date I’ve had no acknowledgement – even whether you think it’s a good idea or should be consigned to the dustbin.” - John W.
Morning John, I’m very sorry your question slipped through to the keeper. I think it makes total sense and I will endeavour to explain abbreviations whenever I can / remember. Again, we’re about to embark on a big rejuvenation of the MM product offering and these comments will certainly be taken into consideration.
Question 14
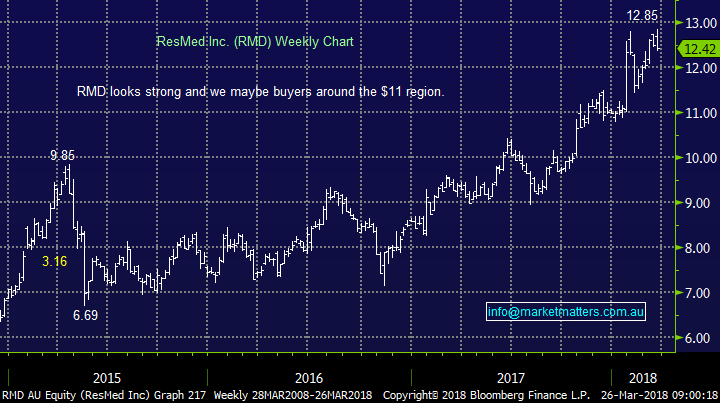
“A question on RMD - I bought in at 11.06 in February and I was wondering if you had a suggested exit level? Also, thanks for the heads up for ORE in this morning’s report - I had a contingency loaded in time before the stock shot down this morning!” – Lachlan O.
Morning Lachlan,
We have touched on RMD a few times in recent months, we like the company and its $US earnings.
- We are buyers of RMD back around the $11 region.
PS Great news on ORE entry and of course fingers crossed it behaves for us all.
ResMed (RMD) Chart
Question 15
“Hi James & Team,
Hoping you might be able to help me out with a question I have. A number of your recent reports have commented on the increase in interest rates being as a result of US money being pulled out of US corporate bonds and flowing back into safe haven government bonds.
Is it just the case that money is flowing back into existing government bonds or is the US government rapidly issuing new bonds? I’m trying to get an understanding of why the 3-month BBSY has seen such a rapid increase from around 1.75-1.80% since mid-2016 to now suddenly up around 2.015%. Your comments and insights as to the underlying reasons behind/causing this recent BBSY increase would be really helpful. It would be fantastic if I could get a reply from you as soon as possible.
Thank you in advance.” - Kind regards, Henry W.
Hi Henry a pretty in-depth question to end today’s report!
In a nutshell the BBSY (Bank Bill Swap Rate) is the interest rate used in the financial markets for the pricing and valuation of Australian dollar securities, and used by banks to borrow money. Since it’s a floating rate, banks and borrowers are not privy to what the rate will be in the short-term until the BBSY is published. The BBSY is set by a panel of 10 banks and published at 10:15 a.m. daily on Thomson Reuters and on Bloomberg LLP.
Ignoring all the current press around “fixing” of the rate which is leading to huge ructions within the banking industry it’s simply a function of supply and demand. Hence markets are telling us that interest rates in Australia will eventually start trending up locally as they are in the US. Hence banks want a higher rate to lend out money plus of course there is the perceived increased risks of a trade war making cash feel like “king”.
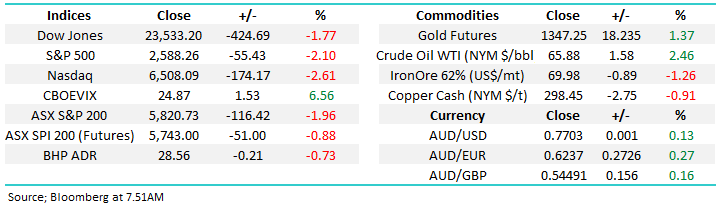
Overnight Market Matters Wrap
· Recent ‘global trade war games’ has brought fear back to the tip of investors’ tongues with the US indices all in negative territory.
· For the week, the Dow fell over 1400 points, or 5.7%, which was the biggest weekly loss in more than two years. The biggest losses were in the banking and tech sectors.
· The June SPI Futures is indicating the ASX 200 to open 65 points lower, towards the 5755 level this morning.
Disclosure
Market Matters may hold stocks mentioned in this report. Subscribers can view a full list of holdings on the website by clicking here. Positions are updated each Friday, or after the session when positions are traded.
Disclaimer
All figures contained from sources believed to be accurate. Market Matters does not make any representation of warranty as to the accuracy of the figures and disclaims any liability resulting from any inaccuracy. Prices as at 26/03/2018. 8.26AM
Reports and other documents published on this website and email (‘Reports’) are authored by Market Matters and the reports represent the views of Market Matters. The MarketMatters Report is based on technical analysis of companies, commodities and the market in general. Technical analysis focuses on interpreting charts and other data to determine what the market sentiment about a particular financial product is, or will be. Unlike fundamental analysis, it does not involve a detailed review of the company’s financial position.
The Reports contain general, as opposed to personal, advice. That means they are prepared for multiple distributions without consideration of your investment objectives, financial situation and needs (‘Personal Circumstances’). Accordingly, any advice given is not a recommendation that a particular course of action is suitable for you and the advice is therefore not to be acted on as investment advice. You must assess whether or not any advice is appropriate for your Personal Circumstances before making any investment decisions. You can either make this assessment yourself, or if you require a personal recommendation, you can seek the assistance of a financial advisor. Market Matters or its author(s) accepts no responsibility for any losses or damages resulting from decisions made from or because of information within this publication. Investing and trading in financial products are always risky, so you should do your own research before buying or selling a financial product.
The Reports are published by Market Matters in good faith based on the facts known to it at the time of their preparation and do not purport to contain all relevant information with respect to the financial products to which they relate. Although the Reports are based on information obtained from sources believed to be reliable, Market Matters does not make any representation or warranty that they are accurate, complete or up to date and Market Matters accepts no obligation to correct or update the information or opinions in the Reports.
If you rely on a Report, you do so at your own risk. Any projections are estimates only and may not be realised in the future. Except to the extent that liability under any law cannot be excluded, Market Matters disclaims liability for all loss or damage arising as a result of any opinion, advice, recommendation, representation or information expressly or impliedly published in or in relation to this report notwithstanding any error or omission including negligence.
To unsubscribe. Click Here