Subscriber Questions (MQG, CGL, CYB, WOR, SVW, MAQ, KDR, HVN, VOC)
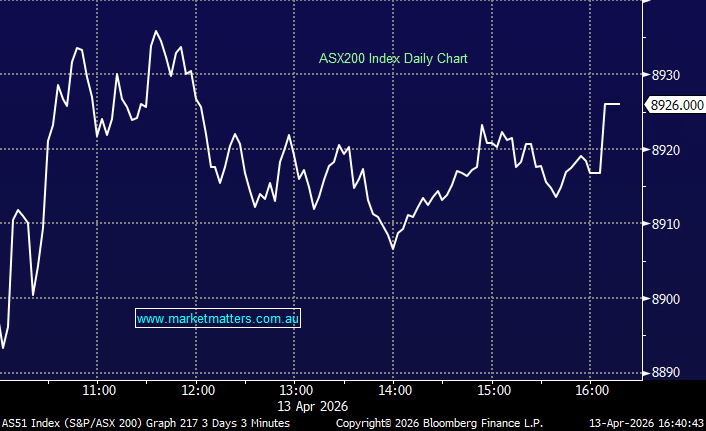
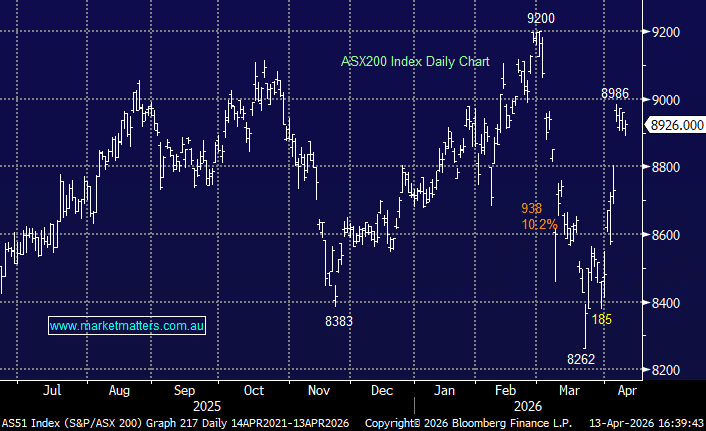
This morning feels likely another test of the ASX200’s resolve but we have a better feeling in the old “gut” today following the local markets strong recovery late on Friday and the US managing to regain a significant portion of its losses Friday night / Saturday morning.
Sydney’s property market appeared to level off on the weekend which should calm some jitters but of course it depends which paper you read:
“Saturday’s auction clearance rate recovered at the margins, rising to 48 per cent after slumping to 44.5 per cent a week earlier. Buyers are competing vigorously for renovated homes and attractive land sites in prized pockets of the city, but are giving a wide berth to some second-tier properties.” – Domain.com.
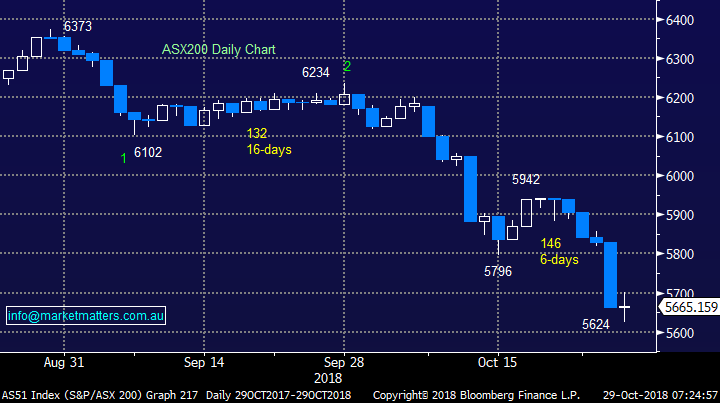
This morning we believe there’s a strong possibility the ASX200 will spend the next few weeks grinding its way higher towards the 5900 area.
We are mildly bullish the ASX200 short-term targeting the 5900 area.
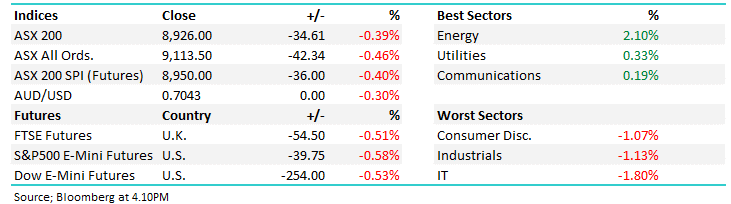
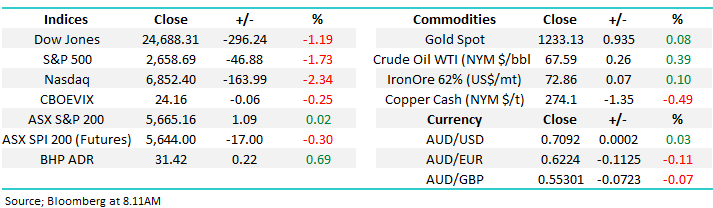
This morning even with the S&P500 falling -1.7% and the Dow almost 300-points the SPI futures are pointing to an optimistic unchanged open by the ASX200 helped by BHP closing up +0.7%.
Interestingly the Russell 2000 index, which MM has been following particularly closely, finished the session only down -1.1%. This small cap index has been the weakest on the way down leading the US indices, its relative strength is a small sign of a temporary bottom at the least.
Thanks again for some more great questions, market volatility is certainly a great tonic for investor focus – the length of this Weekend Report illustrated how much time we have spent pondering over what next.
ASX200 Chart
The US & China currently appear to be vying for the position of primary catalyst of the upheaval in global stock markets.
In China it’s all about the trade war and a slowing economy, very real issues.
Whereas in the US we are less than half way through their reporting season, although it feels much longer, and the markets interpreting results through very different glasses to recent years.
Every sector is beating expectations, with the average “beat” for all securities an impressive +6.2% but beating this quarter is not enough investors are looking forward, and forward earnings are being reduced as the 2 questions being asked are:
1 – Have expectations / optimism become too elevated.
2 – Are the positive earnings momentum from Trumps tax cuts and the lifting of regulatory restraints now behind us?
However, the largest drop off in forward earnings estimates has been in Utilities / Consumer Staples sectors and they have been the recent market leaders i.e. they are regarded as “safe” sectors.
In the US the glass has suddenly become half empty as valuation rerating / derating kicks in with safety becomes the number one priority for most i.e. sell anything with a cyclical angle i.e. things that boomed after Trumps election victory.
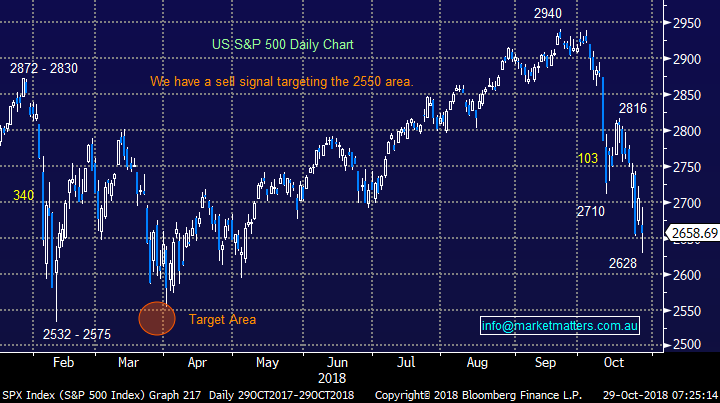
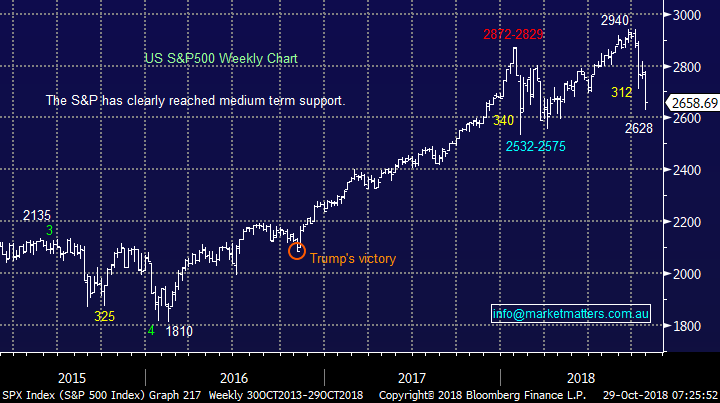
US S&P500 Index Chart
Question 1
“Hi James, I think you possibly need more positive feedback rather than investor frustration. Thanks to the great information in your newsletters I have successfully got into BBUS at $4.28 and out today at $5.20. The hedge worked perfectly given the fundamental and technical set-up in recent months. I always make my own decisions but your 'feel' of the market as expressed in your newsletters is invaluable input into the process.” - Best regards, Robert J.
Hi Robert,
Buy that man a beer! A over 20% return from a ETF hedge is a great result. These plays are very useful to many long term holders of stocks where selling is hard due to tax reasons but they are worried about the markets at this / any point in time.
As subscribers know we believe that the post GFC bull market is very mature at the very least hence we can see ourselves using the BBUS with increasing regulatory moving forward – the BBUS is a leveraged bearish ETF over US stocks.
We are considering buying the BBUS back around the 2800 area.
We do understand the frustrations of our subscribers at times - markets are fluid and they can be very frustrating – that’s simply the reality of it.
US S&P500 Chart
Question 2
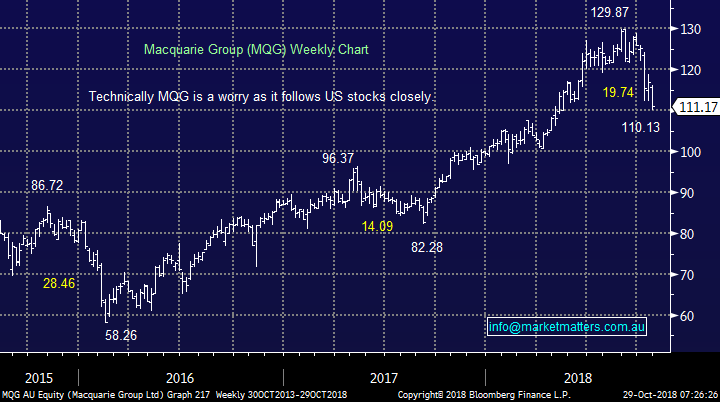
“Hi MM Team, any thoughts on Macquarie Group both technical and fundamental analysis, plus Citadel Group (CGL)” - Thanks Tim C.
Hi Tim,
Macquarie Group (MQG) has undoubtedly been a huge success since its early 2016 low but the recent 15% decline has a lot to do with the stocks strong correlation to the US market. Fundamentally we like the business and while they have a new captain at the helm we like the stock long-term.
However, if the post GFC bull market is complete for US stocks a decline back to the $100 feels likely hence for the buyers out there I would be keeping some ammunition up the sleeve to average into further declines.
Technically we can see a short-term bounce of ~6% back towards the $118 area but ultimately as period of choppy price action.
Macquarie Group (MQG) Chart
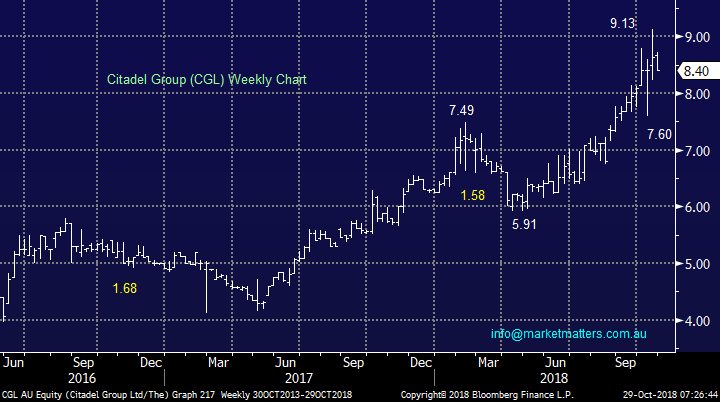
Citadel Group (CGL) is a stock we don’t follow closely due to its extremely low day to day turnover although its $412m market cap is healthy – CGL develops / delivers systems to the government and private sector.
Technically CGL looks likely to test under $8, or ~8% lower.
Citadel Group (CGL) Chart
Question 3
“Theresa May has been digging in on BREXIT, something she was very anti before the fateful vote. The market is now expecting a bad outcome but in our opinion the surprise is more likely from the positive corner. Last week 700,000 people marched to demand a fresh vote, c’mon Britain everyone wants it go back to the polls, our politicians do it all the time! Appreciate if you would put this into English such that I can understand what you are driving at.” – Regards Milton S.
Hi Milton,
The EU is under significant pressure as was shown on the weekend in Germany with Angela Merkel’s state election drubbing. Over recent weeks we’ve had issues with Italy and other popularist parties that favour leaving the EU are gaining momentum in a number of countries.
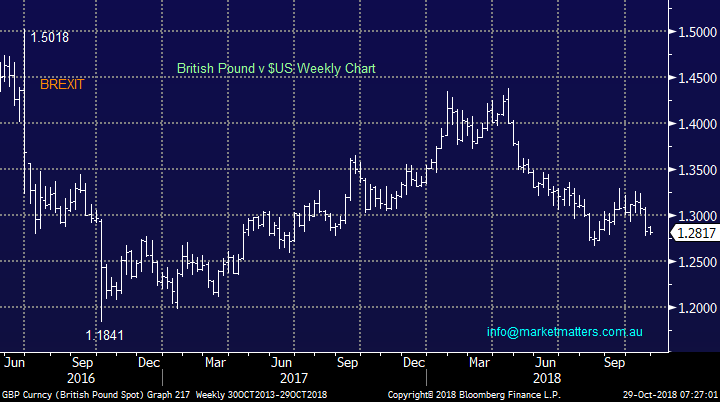
BREXIT is not running smoothly for Theresa May, the UK and the EU – we believe there are no winners here. The decline of the British Pound since April illustrates this perfectly, BREXIT may cost the UK much more than first feared.
We believe the UK now strongly regrets their decision to leave the EU as the anti-BREXIT’er Theresa May is now left to negotiate its conditions.
With 700,000 people marching in protest against BREXIT a second vote is always possible on such an important issue.
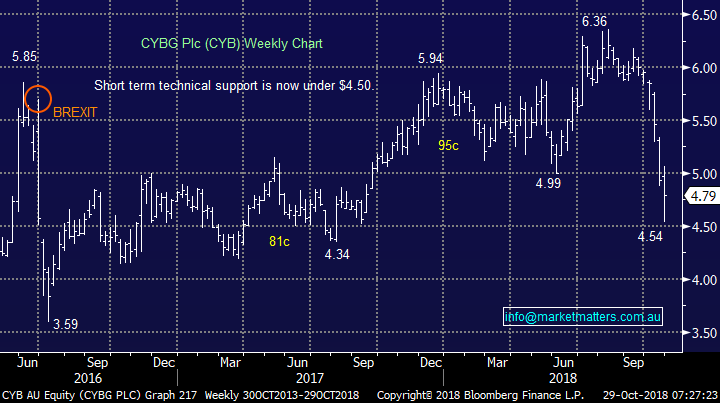
Just a sniff of a second vote would send stocks like CYB and Janus Henderson (JHG), with UK exposure, soaring – in essence we are saying these 2 stocks may be offering some excellent risk / reward at these depressed levels.
British Pound v $US Chart
CYBG Plc (CYB) Chart
Question 4
“Hi James, thanks for your update yesterday on WOR’s major acquisition. Is WOR a stock we should perhaps be buying on current weakness due to its growth prospects on a longer term (say 2 to 5 years) basis? i.e.: could it now be considered more a ‘growth’ stock than a ‘value’ stock?” – Regards Gil.
Hi Gil,
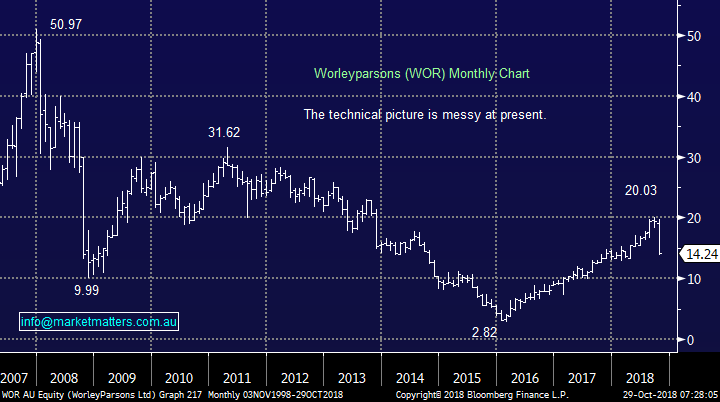
Australia’s largest oil and gas contractor looks set to double its revenue following the huge $4.6bn acquisition of Jacobs Engineering Group Inc.
We like the deal but obviously the companies longer term prospects are strongly linked to the oil & gas industry i.e. energy prices – always a wild card.
However on balance we like WOR and the current weakness does look like an opportunity to accumulate WOR for investors keeping half an eye on the oil price – Technically we can see oil ~5% lower over the short-term which would likely provide a better entry into WOR.
Worley Parson (WOR) Chart
Question 5
“James, a quick question for Monday. You have discussed the Labor governments franking credit policy in past commentary and it has been widely written about in the media. What I have not seen a lot of widespread comment on is the impact this may have on the hybrid market. With the hybrid market smaller, less liquid, subject to wider bid-ask spreads and having been popular over the last 5-10 years as investors seek yield, do you see the hybrid market as carrying higher risk of capital volatility/re-rating should Labor win the next election and implement their franking policy? From a risk reward perspective, with a loss of some, or all franking credits, hybrids may not stack up for many investors on a risk/reward basis. Thankyou in advance for your comments/analysis.” – Grant L.
Hi Grant,
I’ll write about this more in time, specific to the income report as I think it’s an important issue. At Shaw I work closely with the guys who run a Hybrid fund so I’ll also aim to catch up with them either through a video or podcast for the MM community.
Ultimately, franking provides are an important component of returns for some investors holding hybrids, but the key is to obviously understand the quantum of those holding hybrids that are impacted by Labors proposed change – a hard task.
Stay tuned – more on this topic to come.
Question 6
“Hi James. I am interested in two companies - Seven Group Holdings (SVW) and Macquarie Telecom (MAQ) for a long-term position, they have dropped and I would like to know your thoughts on these. They both look good from what I have read, but would like MM to add anything - positive/ negative that may help my decision.” – John L.
Hi Len,
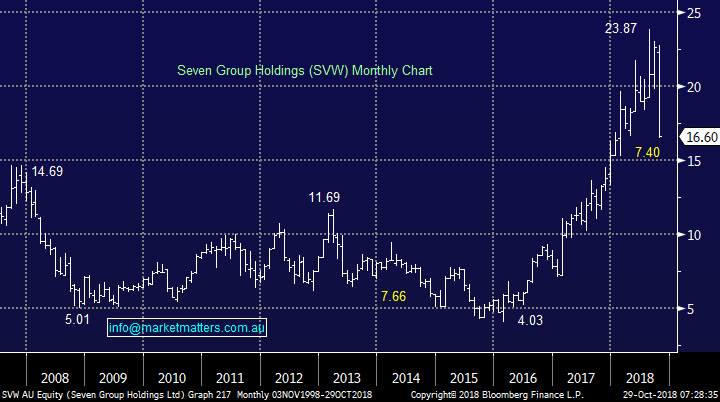
SVW delivered over 30% growth on its FY’17 numbers showing the problem with the share price was more around valuation as opposed to underlying business performance.
SVW has been slammed over 30% from its August high, pretty much in line with the high growth / valuation / top performance stocks – just like in the US discussed earlier.
Overall we prefer SVW over many in its group due to conservative 13.x Est 2019 valuation plus small but useful 2.53% fully franked yield.
MM likes the idea of accumulating SVW into current aggressive weakness.
Seven Group (SVW)Chart
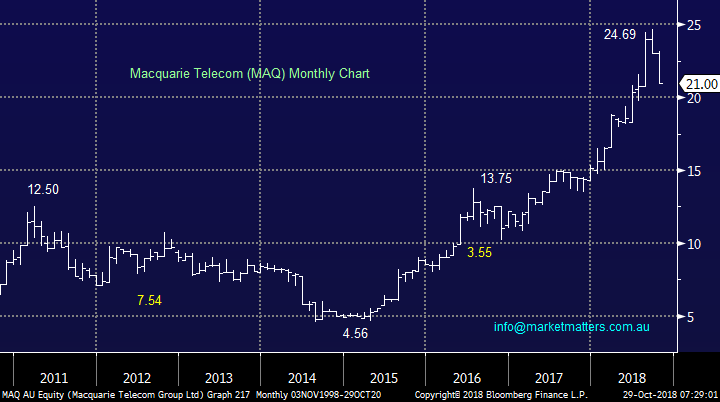
MQA is an infrastructure company which has enjoyed an excellent 3-years.
Technically we could be buyers / accumulators of MQA between $19 and Fridays close.
Macquarie Telecom (MAQ)Chart
Question 7
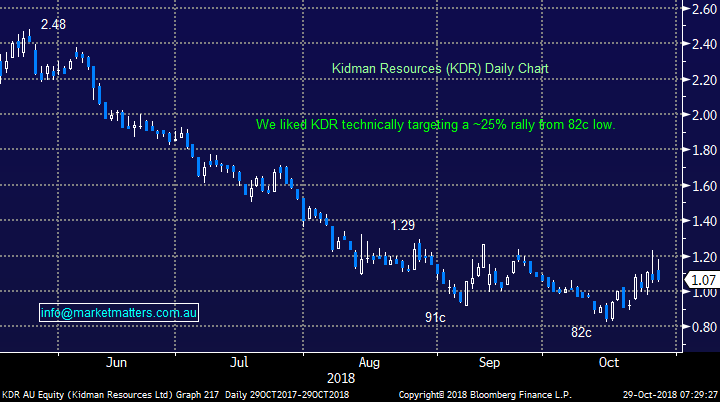
“Hi James, in relation to KDR technical setup, one could also have used Japanese Candlestick Charting using the bullish engulfing pattern which presented itself on the 16th October, was very close to text book pattern.” – Regards Steve S.
Hi Steve,
I agree totally, we look at a number of technical methods / indicators, primarily in the subjective group, and candlesticks is one we like.
Not surprisingly you often see a few line up at decent buy / sell opportunities.
Were keen to see the next one you find in case we missed it!
For those that don’t know what we are talking about it’s the second white bar after the 82c low which triggered a buy signal by closing above 93c.
Kidman Resources (KDR) Chart
Question 8
“Which group of shares TEND to do better in a bear market top 50, 100, 200, Small Ords or maybe which sector. I am not asking for a definitive answer just an Historical observation” – Bryan H.
Hi Bryan,
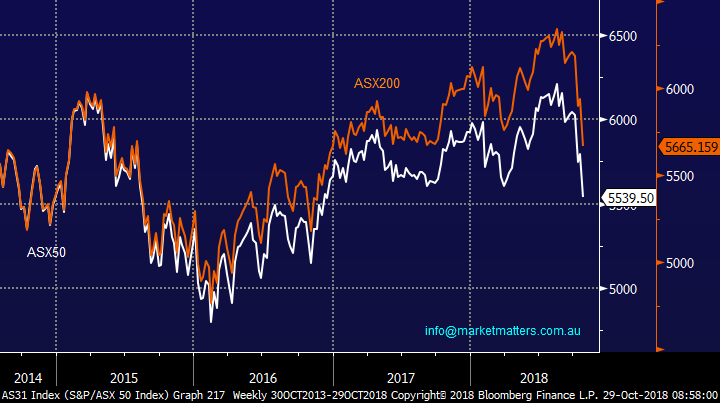
While we believe performance really comes down to individual shares and the below comparison of the ASX200 and ASX50 illustrates this:
1 – They clearly track each other very closely no surprise there.
2 – This correction has seen the ASX50 fall 11.7% and the ASX200 11.8%.
3 - The 2015/6 correction saw the ASX50 fall 23.3% and the ASX200 21.5%.
The reason behind the correction will determine what stocks / sectors get hit the hardest, the last few weeks has seen the end of GAAP – growth at any price.
Also most stocks that have run hard have experienced aggressive profit taking hence in today’s case it’s been the smaller stocks but this wasn’t the case in 2015/6 when banks corrected.
Australian ASX200 v ASX50 Chart
Question 9
“How do BBUS, BBOZ and BEAR ETF's. Obviously, they are taking short positions on the market but what would happen if there was another GFC with a lot of companies going to the wall and being delisted e.g. ABC Learning, HIH, BNB of the GFC period. Who would pay out for the short positions? The broker may also go bust as happened with US brokers domiciled in Switzerland. These ETFs would not have any positions. I have BBUS, BBOZ and BEAR positions at the moment which are holding my portfolio up but if we went for a serious GFC downturn should I be exiting early these ETFs early?” – David R.
Hi David,
I understand your concern but the ETF’s that are focused on indices are hedged via the futures markets which held up perfectly well during the GFC.
When you trade in an ETF or any share through an exchange, you are not exposed to the broker failing, the exchange novates the transaction (sits in the middle).
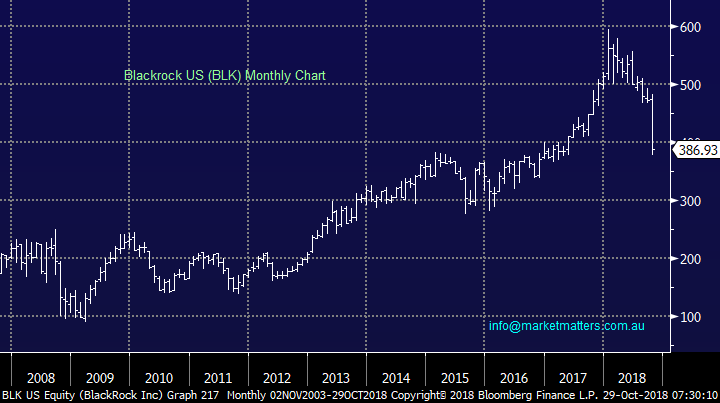
Below is a chart of one ETF provider Blackrock out of interest and clearly we’re seeing a move away from the providers or passive products as the market volatility heats up.
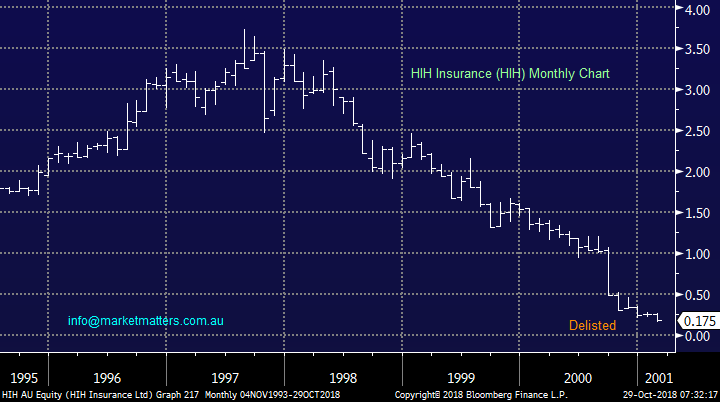
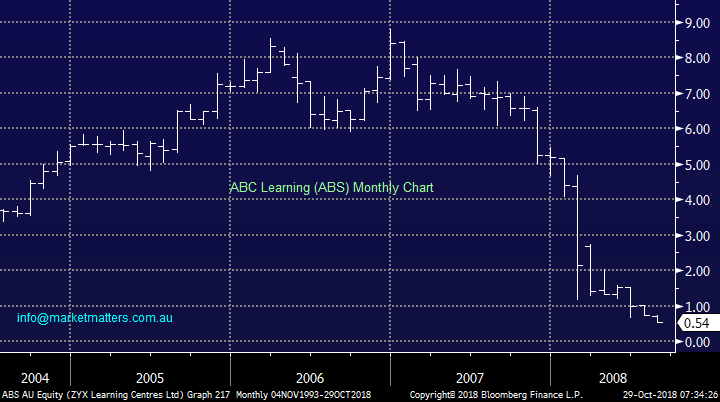
When you look at the chart of HIH Insurance and ABC Learning the writing was clearly on the wall and importantly investors had plenty of time to exit.
Blackrock (BLK) US Chart
HIH Insurance Ltd (HIH) Chart
ABC Learning (ABS) Chart
Question 10
“Hi James, thanks for all your insight in the market. Given all the recent upheavals, could I please have your thoughts on the following stocks that I own:
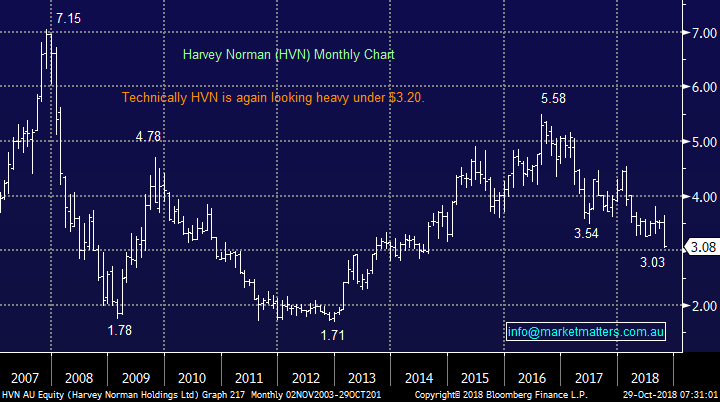
HVN – I noted your advices that a stockbroker had placed a $ 2.70 price tag on HVN?
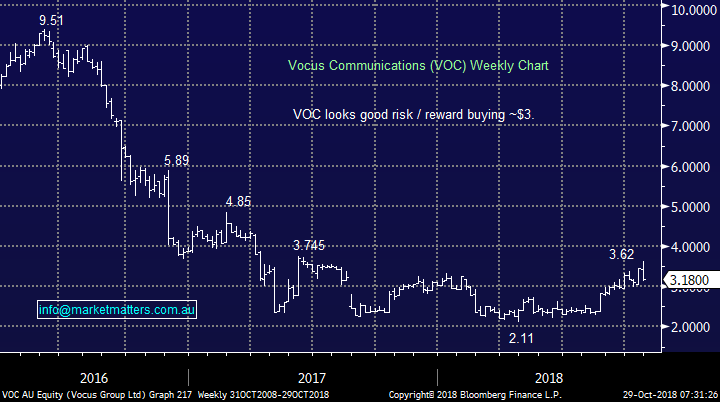
VOC – I have been watching and trying to exit at my average buy-in price of around $3.75. I was hoping that VOC would use $3.30 as support and bounce. As it has fallen through this area I am now worried! “-Thanks George T
Hi George,
ON HVN we remain concerned with the general health of our retail market until we see a decline in household debt.
HVN also needs to see calm return to the Australian property market before it will feel particularly exciting.
Technically we now have no interest in HVN until it can recover back above $3.40.
Harvey Norman (HVN) Chart
Vocus is in the telco sector that we do like moving forward but its volatility should not be underestimated.
VOC traded within 13c of your target but has now fallen 44c – not great and I stress an entry into a stock should have zero impact on your planned exit.
However, we like VOC around $3 and a another test of $4 would not surprise moving forward.
Vocus Limited (VOC) Chart
Overnight Market Matters Wrap
· The US ended last Friday on its lowest level in 6 months, bond traders are also starting to reweight their positions as any further downside risk will likely impact on any further rate hikes by the US fed in the short term.
· On the commodities front, most LME metals were lower, led by nickel, while oil and iron ore were trading higher. BHP is expected to outperform the broader market after ending its US session up an equivalent of 0.69% from Australia’s previous close.
· The December SPI Futures is indicating the ASX 200 to open with little change this morning, around the 5,665 level this morning.
Have a great day!
James & the Market Matters Team
Disclosure
Market Matters may hold stocks mentioned in this report. Subscribers can view a full list of holdings on the website by clicking here. Positions are updated each Friday, or after the session when positions are traded.
Disclaimer
All figures contained from sources believed to be accurate. Market Matters does not make any representation of warranty as to the accuracy of the figures and disclaims any liability resulting from any inaccuracy. Prices as at 29/10/2018
Reports and other documents published on this website and email (‘Reports’) are authored by Market Matters and the reports represent the views of Market Matters. The MarketMatters Report is based on technical analysis of companies, commodities and the market in general. Technical analysis focuses on interpreting charts and other data to determine what the market sentiment about a particular financial product is, or will be. Unlike fundamental analysis, it does not involve a detailed review of the company’s financial position.
The Reports contain general, as opposed to personal, advice. That means they are prepared for multiple distributions without consideration of your investment objectives, financial situation and needs (‘Personal Circumstances’). Accordingly, any advice given is not a recommendation that a particular course of action is suitable for you and the advice is therefore not to be acted on as investment advice. You must assess whether or not any advice is appropriate for your Personal Circumstances before making any investment decisions. You can either make this assessment yourself, or if you require a personal recommendation, you can seek the assistance of a financial advisor. Market Matters or its author(s) accepts no responsibility for any losses or damages resulting from decisions made from or because of information within this publication. Investing and trading in financial products are always risky, so you should do your own research before buying or selling a financial product.
The Reports are published by Market Matters in good faith based on the facts known to it at the time of their preparation and do not purport to contain all relevant information with respect to the financial products to which they relate. Although the Reports are based on information obtained from sources believed to be reliable, Market Matters does not make any representation or warranty that they are accurate, complete or up to date and Market Matters accepts no obligation to correct or update the information or opinions in the Reports. Market Matters may publish content sourced from external content providers.
If you rely on a Report, you do so at your own risk. Past performance is not an indication of future performance. Any projections are estimates only and may not be realised in the future. Except to the extent that liability under any law cannot be excluded, Market Matters disclaims liability for all loss or damage arising as a result of any opinion, advice, recommendation, representation or information expressly or impliedly published in or in relation to this report notwithstanding any error or omission including negligence.