Stepping back & reviewing our “underwater positions” – Part 2 (BEN, CTD, SSM, BIN, NWH)
LOCAL REPORTING CALENDAR: CLICK HERE **Please note, data sourced from Bloomberg, not all ASX companies are on this list and dates can vary**
Today we have a long list of results, below I cover BHP, COH, COL, MND, EHE & WBC

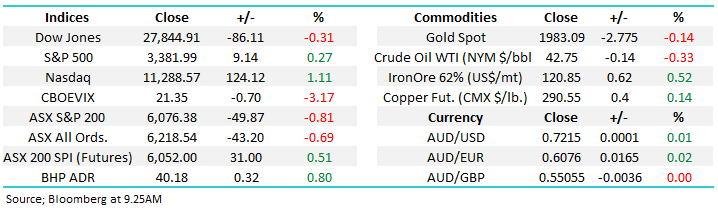
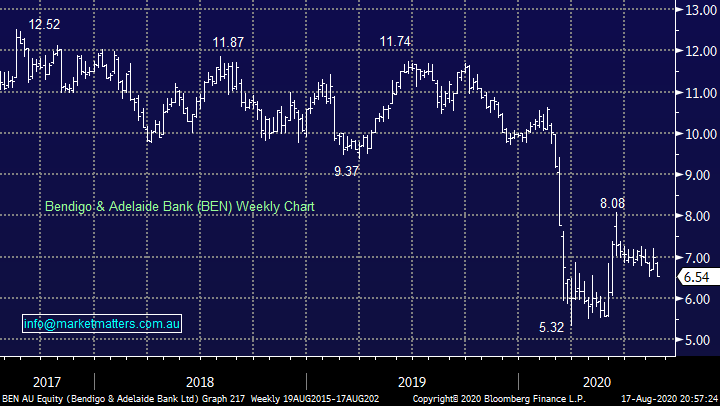
The ASX200 is often referred to as a Banking Index which makes a degree of sense with the “Big 4” alone making up ~20% of the market, although it used to be much higher before their market underperformance, hence when Bendigo & Adelaide Bank (BEN) delivered an awful report it’s no real surprise that it brings the whole sector down in sympathy, creating a headwind which was too much for the broader market to overcome. The Australian regional banks may have disconnected from the heavyweights on the performance front but the negative sentiment created by BEN’s result was enough to bring NAB, the recent sector outperformer, down by over -2.5% on Monday. This morning we’ve just had a Q3 trading update from WBC, and while they confirmed no interim dividend, the update itself was largely in line with expectations.
As we said in yesterday’s Afternoon Report “its all too hard” for BEN at the moment but MM remains optimistic towards the quality end of the Banking Sector. I reiterate we have no interest in migrating up the risk curve within the group, however stretched the elastic band may feel, plus BEN looks unlikely to pay a reliable dividend for the foreseeable future diminishing its appeal still further. Our largest holding in the banks by a decent margin is CBA which continues to feel correct at present, the country’s largest bank keeps proving its relatively expensive for a reason.
MM sees no reason to buy BEN.
Bendigo Bank (BEN) Chart
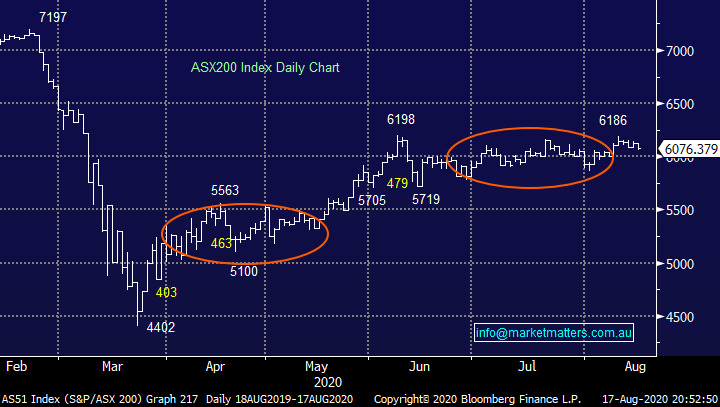
No change on the index level with the psychological 6000 level continuing to win the battle between both the bulls & bears. The US market has tried to come to our assistance but the domestic negative influences have remained too prevalent – since mid-June the S&P500 has rallied almost 15%, well over double the +6.2% the local market has managed to rally. We need a week where the ducks a line for the Banks, Resources & Healthcare but all we keep seeing is rotation between the varying stocks and sectors.
MM remains bullish the ASX200 medium-term.
ASX200 Index Chart
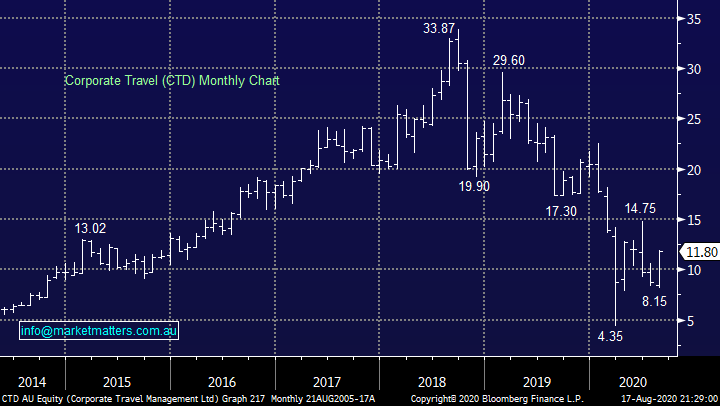
The recovery trade continues to forge ahead with the likes of Corporate Travel (CTD) and Sydney Airports (SYD) residing in the “Top 15 performers” on Monday even while reporting season is underway, investors appear to calling the bottom in the travel market. Sydney Airports (SYD) which we own in our Income Portfolio recently raised $2bn via a rights issue at $4.56 per share, MM will take up our entitlement and happily so considering they finished yesterday at $5.42. Interestingly, the entitlement short fall was placed into a bookbuild which clearer at $5.30, showing that there is strong demand for SYD at that price.
We’ve been reticent in the past to get too excited around CTD but following its report tomorrow we will be looking at the numbers and watching the stock closely to determine if it’s a recovery story to warrant investing.
MM is considering CTD targeting ~25% upside but it’s a coin toss into its result.
Corporate Travel (CTD) Chart
Overseas Indices & markets
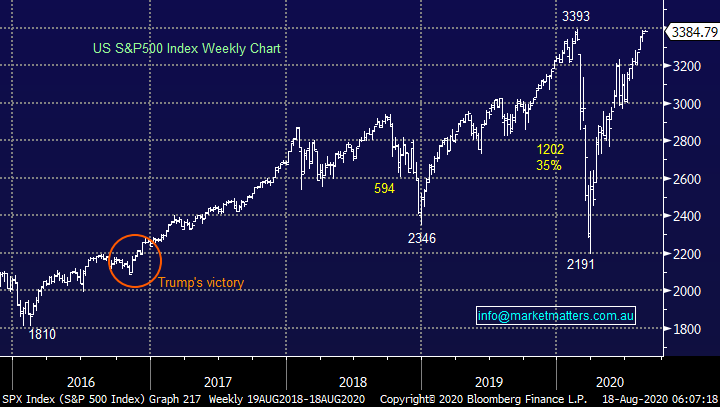
US stocks had a mixed night with tech stocks forging ahead to fresh all-time highs while the Dow actually slipped lower as their financials endured a tough day like our own. The largely followed S&P500 continues to hover just below its highs reached in February but it feels like just a matter of time before these levels are breached and its off to pastures new, this week would actually be my best guess – I imagine the non-believers will be feeling increasingly uncomfortable by the day.
MM remains bullish US stocks medium-term.
US S&P500 Index Chart
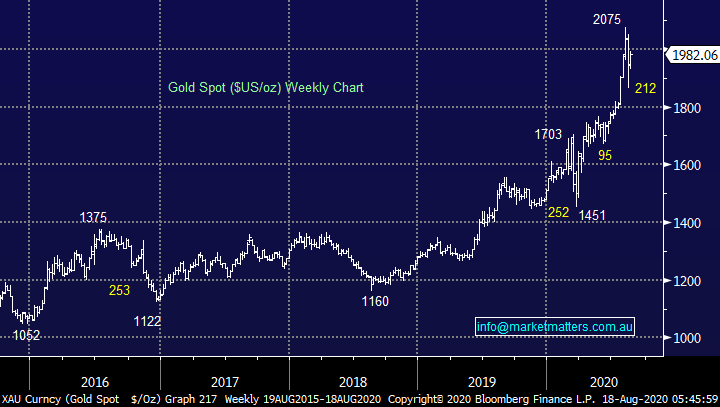
Overnight we saw the precious metals complex regain its mojo with gold up over $US40 and it now looks destined to test the $US2100 area although again we wouldn’t be surprised to see it struggle on its first attempt – gold feels “hot” at present which makes its susceptible to short-term washouts as we witnessed last week. Our attitude towards the complex is: we are bullish but happy to take profits into strong rallies into fresh yearly highs but the core view is to buy sharp pullbacks which we do believe will continue to present themselves.
MM remains bullish precious metals.
Gold ($US/oz) Chart
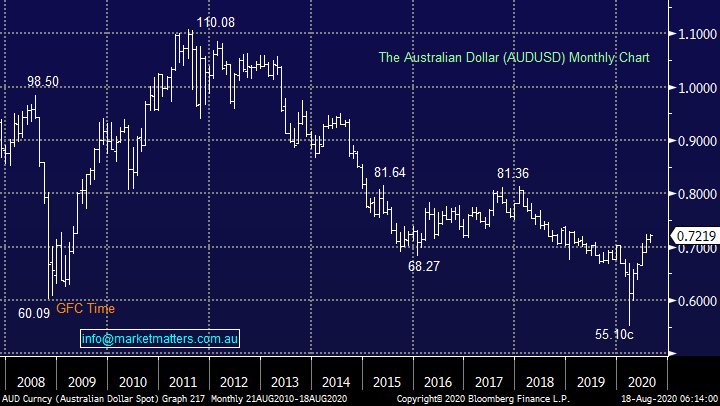
Monday night in the US was another great illustration of how interlinked financial markets are, we saw US bond yields drift slightly lower, after their recent strong gains, which sent the $US lower and commodities such as gold, copper, crude oil and silver all higher. Obviously, commodities in the bigger picture are driven by supply and demand but the day to day swings are hugely influenced by the $US in which they are denominated.
MM remains bullish the $A.
Australian Dollar ($A) Chart
Reviewing our “underwater positions” in the MM Growth Portfolio Part 2.
As we said in Part 1 of this piece (click here) the backbone of successful investing is to “look after the losers as the winners will look after themselves”, this undoubtedly overlaps with the old market adage which the vast majority of successful investors swear by – “run your profits and cut your losses”.
Today I have simply revisited an additional 3 investments MM holds in our Growth Portfolio which are showing paper losses, happily that’s all folks and we don’t have to repeat the exercise on further mornings. Our job to determine whether we believe they will outperform from today, entry levels are irrelevant to decision making moving forward, the rear vision mirror can often be a hindrance with regard to investing but again as we said last week if MM is correct and equities continue to rally over the next 12-18 months there’s a strong possibility that a number of the “dogs” of 2020 will recover as economic optimism improves. Firstly, a quick summary of our conclusions from last week’s Part 1:
1 – Emeco Holdings (EHL) was $1.02, now $1.03, the healthy mining sector is great news for EHL and we believe this backdrop should aid outperformance moving forward : MM is bullish EHL at current levels.
2 – Beach Petroleum (BPT) was $1.45 now $1.58 up 9%, we should have averaged before its report as the deep value on offer is starting to shine through: MM remains bullish BPT medium-term.
3 – Costa Group (CGC) was $2.90 now $2.93, Australia’s largest agricultural business whose recovery could be dramatic if our reflation view plays out: MM is leaning towards a bullish to neutral stance on CGC.
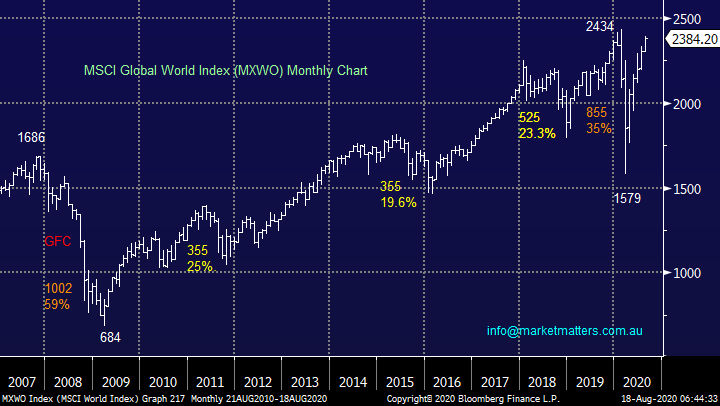
Similar to the S&P500 earlier we believe it’s just a matter of time until the Global World Index scales fresh all-time highs, it’s a shame the same cannot be said of the ASX but at least we are well above our panic March lows.
MM remains bullish global equities medium-term.
MSCI Global World Index Chart
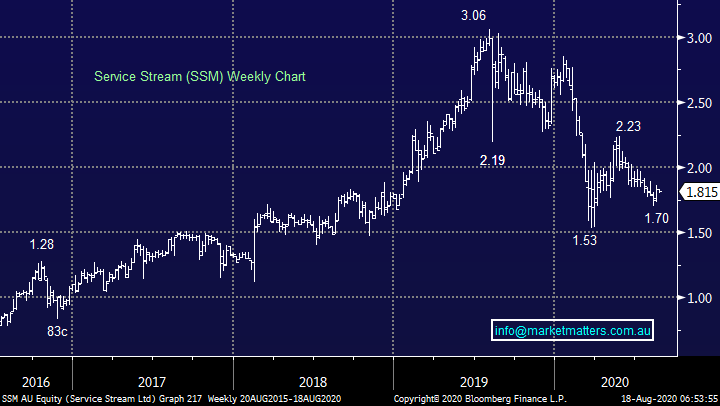
1 Service Stream (SSM) $1.81.
Networking infrastructure specialist SSM scope encompasses new and old energy plus Telcos. The business was growing earnings at an impressive rate before COVID-19 which led to the stock almost halving but we feel the company is well positioned to benefit from increasing infrastructure spend and the much discussed 5G network plus for good measure a forecast yield of ~5% fully franked is not to sniffed at.
They are scheduled to report FY20 earnings today, although this is not our yet. We’re currently looking for revenue of $950m, EBITDA of $107m and NPAT of $59.5, up 19% on FY19. FY21 looks less optimistic with profits flat year on year, although on a P/E of just 12x, not a lot of optimism is baked into the SSM cake.
We feel this is a turnaround story that’s being overlooked at present and the risk / reward is very attractive at current levels but out of prudence we are not tempted to increase our 3% position size. Let’s hope they report ‘okay’ today.
MM is bullish SSM at current levels.
Service Stream (SSM) Chart
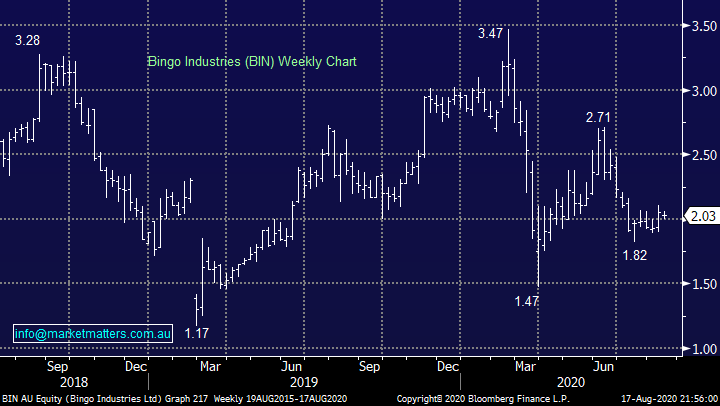
2 Bingo Industries (BIN) $2.03
We feel recycling and waste business BIN is perfectly positioned for the long haul but the current pandemic is significantly weighing on its current earnings as would be expected for the country’s largest player in building waste in Sydney. I feel this stock will snap back into favour potentially when least expected, its another holding we like moving forward but one we see no reason to increase our exposure at the stage.
They report next week and many in the market I speak to are worried about this result. Shorts have increased in BIN recently, moving from 4% in May to above 6% today. This sets up the potential for a short covering rally ‘if’ BIN can deliver a decent set of numbers on the 24th August. Currently, expectations are for FY20 EBITDA of $146m, with an analyst range of $138-$158m. Of all the stocks across our portfolios, I’m most nervous about BIN, hence our decision to reduce our position size a few months ago.
MM remains bullish BIN medium-term.
Bingo Industries (BIN) Chart
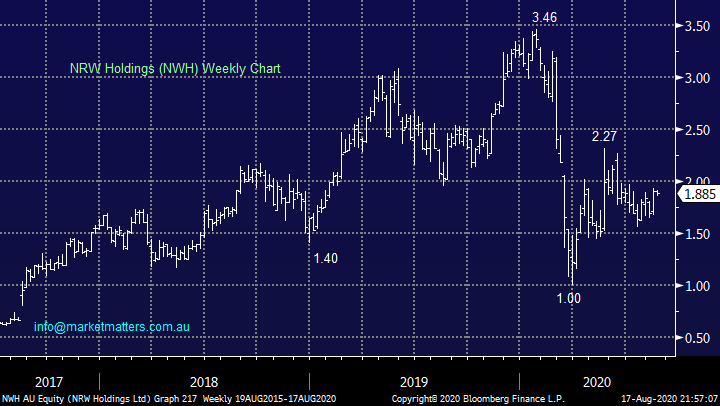
3 NRW Holdings (NWH) $1.88.
Mining / construction services business resides exactly where we would want from a fundamental perspective but until last week’s bounce it’s been a mixed recovery since March. The company is operating well, winning new projects like the Bunbury outer ring road project earlier in the month, its recent acquisition of BGC Contracting should help with more major public works moving forward just as the government is priming its fiscal stimulus pump. MM likes the company’s exposure at this stage of the cycle we just need to see some performance on the results front to warrant a rally in the stock.
MM remains bullish NWH.
NRW Holdings (NWH) Chart
Conclusion
MM continues to like SSM, BIN and NWH who are all exposed to a turnaround in economic activity, hopefully they will start to show some share price appreciation like CTD mentioned earlier in the days report.
Watch for alerts.
Have a great day!
James & the Market Matters Team
Disclosure
Market Matters may hold stocks mentioned in this report. Subscribers can view a full list of holdings on the website by clicking here. Positions are updated each Friday, or after the session when positions are traded.
Disclaimer
All figures contained from sources believed to be accurate. All prices stated are based on the last close price at the time of writing unless otherwise noted. Market Matters does not make any representation of warranty as to the accuracy of the figures or prices and disclaims any liability resulting from any inaccuracy.
Reports and other documents published on this website and email (‘Reports’) are authored by Market Matters and the reports represent the views of Market Matters. The Market Matters Report is based on technical analysis of companies, commodities and the market in general. Technical analysis focuses on interpreting charts and other data to determine what the market sentiment about a particular financial product is, or will be. Unlike fundamental analysis, it does not involve a detailed review of the company’s financial position.
The Reports contain general, as opposed to personal, advice. That means they are prepared for multiple distributions without consideration of your investment objectives, financial situation and needs (‘Personal Circumstances’). Accordingly, any advice given is not a recommendation that a particular course of action is suitable for you and the advice is therefore not to be acted on as investment advice. You must assess whether or not any advice is appropriate for your Personal Circumstances before making any investment decisions. You can either make this assessment yourself, or if you require a personal recommendation, you can seek the assistance of a financial advisor. Market Matters or its author(s) accepts no responsibility for any losses or damages resulting from decisions made from or because of information within this publication. Investing and trading in financial products are always risky, so you should do your own research before buying or selling a financial product.
The Reports are published by Market Matters in good faith based on the facts known to it at the time of their preparation and do not purport to contain all relevant information with respect to the financial products to which they relate. Although the Reports are based on information obtained from sources believed to be reliable, Market Matters does not make any representation or warranty that they are accurate, complete or up to date and Market Matters accepts no obligation to correct or update the information or opinions in the Reports. Market Matters may publish content sourced from external content providers.
If you rely on a Report, you do so at your own risk. Past performance is not an indication of future performance. Any projections are estimates only and may not be realised in the future. Except to the extent that liability under any law cannot be excluded, Market Matters disclaims liability for all loss or damage arising as a result of any opinion, advice, recommendation, representation or information expressly or impliedly published in or in relation to this report notwithstanding any error or omission including negligence.


