Some reliable market correlations are questioning current stock market levels & valuations.
The ASX200 roared back to life yesterday after a shaky open as solid buying in the futures market dragged stocks impressively higher from around 11am, during the 60-point intra-day rally there wasn’t one pullback of 10-points as there appeared to be a distinct lack of sellers following the markets begrudging 2.8% pullback over the last few weeks. Overall it was an impressive performance with both Asia and the US futures weak throughout our day, while both the Australian & New Zealand indices rallied almost +0.7% - the Antipodean investors are embracing their respective dovish central banks.
Every local sector closed positive for the day with the Consumer Discretionary stocks leading the charge while the IT space was the weakest group struggling to close in the black – arguably the complete opposite to what you would expect for an economy slipping into recession. Additionally all the Retail stocks in the ASX200 closed positive with an average gain of +1.4%, it felt like fund mangers were again searching for anything that might be regarded as vaguely “cheap” after the last 3-months strong rally.
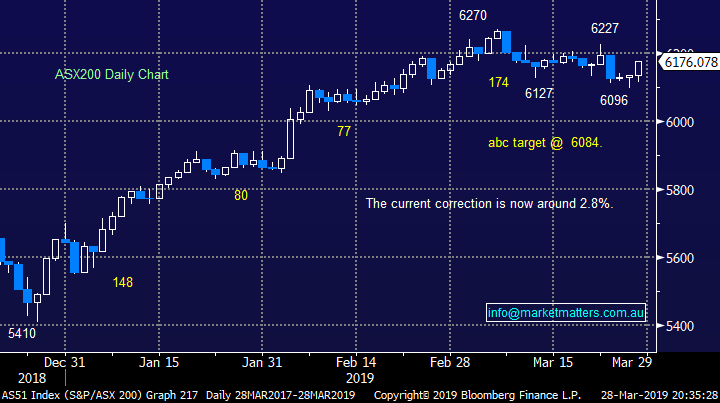
As we’ve discussed a few times over the last week billions of dollars of dividends are being paid into the accounts of investors this week, and it now appears some of this money is finding its way back into the market following the recent small correction. Medium-term we can see stocks regaining their bullish tone of the last few months with an eventual target above 6300 but from a risk / reward perspective we are not excited by the general value on offer.
The ASX200 has now basically achieved our initial downside target and we are switching back to a neutral stance short-term.
Overnight US markets were firm with the S&P500 futures closing almost 1% higher than when our market was open, the local market picked it again! The SPI futures are pointing to flat open to end the week implying that we already priced the bounce by US stocks into our market.
Today we are going to look at 5 market correlations we watch carefully that are diverging from their usual path.
ASX200 Chart
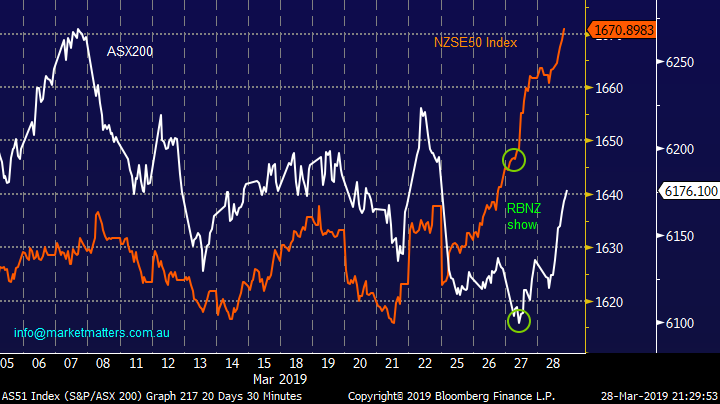
The RBNZ joined the dovish party this week as we have mentioned over the last few days and it appears to have ignited stocks both sides of the Tasman. The NZ market has rallied to fresh all-time highs although the below 30-minute chart shows its was already rallying when the central bank did an about turn on interest rate policy but the ASX200 reacted almost immediately – both markets are embracing the idea of lower rates.
The ASX200 and the NZSE50 Index Chart
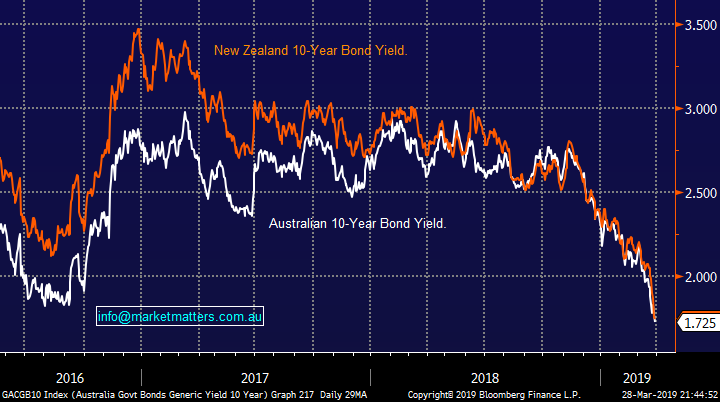
Also, both the Australian and New Zealand 10-year bond yields are now trading at all-time lows illustrating that financial markets are very concerned with the health of both economies, and hence they are targeting rate cuts on both sides of the ditch.
In fact the futures market has now fully priced in 2 rate cuts in Australia by August 2020 i.e. from 1.5% down to 1%.
The New Zealand RBNZ cash rate is higher than our own at 1.75% but it feels like both central banks might have started a race to the bottom, wherever that is – German 10-year bunds are back into the amazing negative territory at -0.05%.
New Zealand Dollar v Australian 10-year bond yield Chart
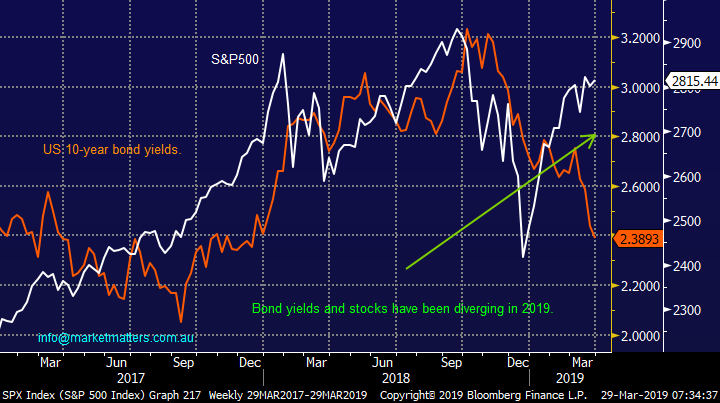
1 Bond yields are diverging with stocks.
I imagine many investors are almost becoming bored with the level of recent discussion around bond yields but it should not be underestimated how often they are the tail that wags the stock market dog.
The correlation between US stocks and 10-year bond yields has been excellent for the last 2-years but its been clearly diverging in 2019, we must question if the interrelationship is about to unwind or is one of these major markets about to reverse?
Our preference fundamentally medium-term is equities correct but there are no signs of this at present.
US S&P500 v 10-year bond yields Chart
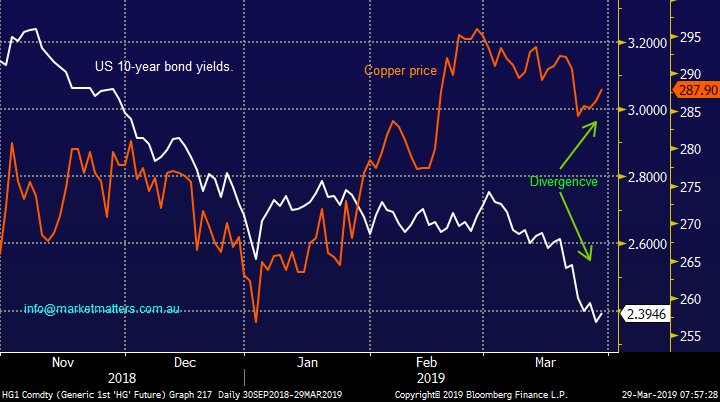
2 Bond yields are diverging with Copper.
Bond yields and Dr. Copper are diverging, especially over the last 6-weeks. Copper is regarded as a leading indicator for global economic strength – an easy one to comprehend due to its applications in many sectors of an economy from industrial and electronics to the simple home.
We feel the copper price is holding up because investors anticipate the current Chinese stimulus to increase demand while they are complacently assuming a positive outcome for the US – China trade talks, although this is our anticipated scenario.
At this point in time the perceived risk to us is for copper and base metal prices top pull back.
Copper v 10-year bond yields Chart
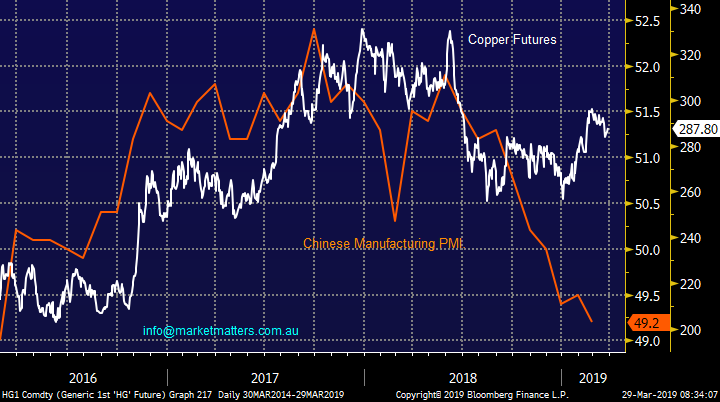
3 Chinese economic strength is diverging with Copper.
Similarly to point 2 the copper price is diverging / ignoring the economic slowdown in China which is illustrated below by the Manufacturing PMI.
We believe the market is pricing in a successful result from the current Chinese stimulus and a positive outcome from US – China trade talks i.e. markets expect Chinese growth to again turn higher – markets are positioned for a positive outcome.
At this point in time the perceived risk to us is for copper / base metal prices and related stocks.
Copper v Chinese Manufacturing PMI Chart
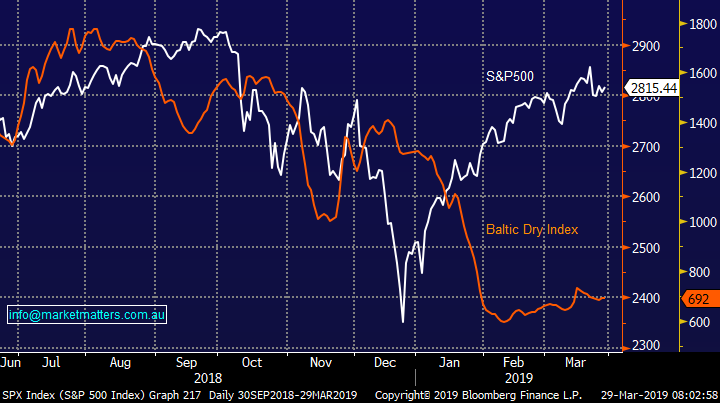
4 Stocks are diverging with the Baltic Dry Index.
The list of disconnects continues with the Baltic Dry Index falling sharply while US stocks remain firm – The Baltic Dry Index is the bell weather indicator used to measure current shipping costs and its often used as a leading indicator of future economic growth.
The aggressive decline in the Baltic Dry Index correlates perfectly with bond yields pointing to an aggressive economic slowdown and a potential recession – stocks are not pricing in the risk of a recession in our opinion.
At this point in time the perceived main risk to us is for US and global stocks to pullback.
US stocks v Baltic Dry Index Chart
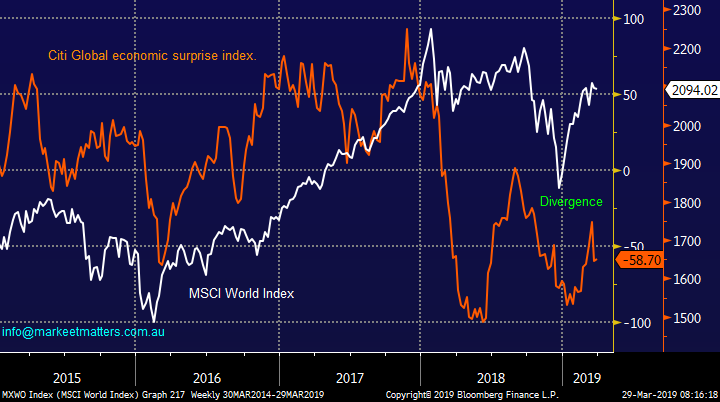
5 Global stocks are ignoring poor economic surprises.
A new one for many subscribers – the Citi Global Economic Surprise Index which shows how global data has performed, making it a gauge of optimism hence its not surprising after the last few months that the gauge has struggled badly.
Again global stocks have largely ignored poor / disappointing economic data – this can also be interpreted positively if stocks shrug off bad news - we often regard it as a strong market. In this case our opinion is stocks are relying on the “Fed Put” i.e. the US FED, and other global central banks, will again pump “free money” into the system to avoid a recession.
At this point in time the perceived main risk to us is again for stocks.
Global stocks v economic surprises Chart
Conclusion
Global equities remain firm aided by the central bank liquidity and cheap money – with the chance or more liquidity to come. However we are wary / mindful that a number of positive outcomes are built into current stock market valuations – for now we will let the market tell us where it’s going.
Global Indices
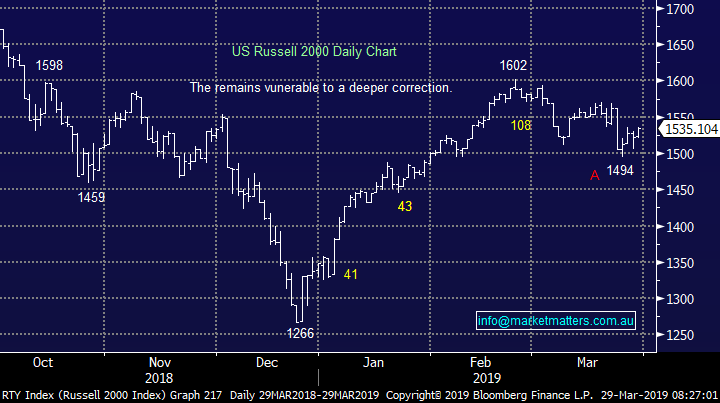
US stocks closed higher last night with the small cap Russell 2000 again leading the recovery. Until we again see this index start to underperform US stocks are likely to remain firm.
US S&P500 Chart
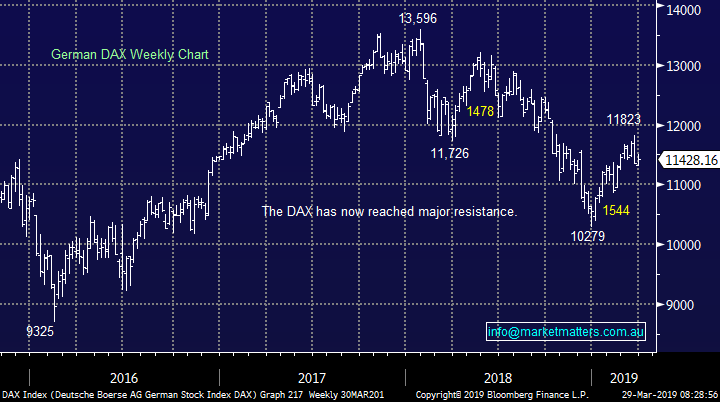
No change, European indices are encountering some selling from our targeted “sell zones”, we remain cautious or even bearish the region at this stage.
German DAX Chart
Overnight Market Matters Wrap
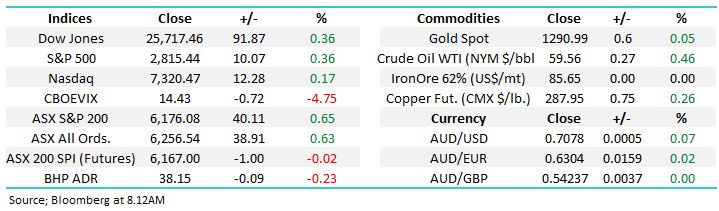
· The SPI is down just one point after US equities had a slight bounce overnight. The Dow, S&P 500 and NASDAQ all closed off their highs, but still up ~0.35%, while the FTSE was 0.6% in the black.
· US-Sino trade talks are continuing with the Chinese seemingly allowing foreign companies more technology access than previously announced. The negotiations could potentially drag on for many more months.
· On the LME, copper was better but nickel fell more than 1%. Iron ore fell 0.5% and oil was relatively flat despite Trump saying oil is getting too high. Gold fell 1.6% to $US1290/oz.
· The March SPI Futures is indicating the ASX 200 to open flat.
Have a great day!
James & the Market Matters Team
Disclosure
Market Matters may hold stocks mentioned in this report. Subscribers can view a full list of holdings on the website by clicking here. Positions are updated each Friday, or after the session when positions are traded.
Disclaimer
All figures contained from sources believed to be accurate. Market Matters does not make any representation of warranty as to the accuracy of the figures and disclaims any liability resulting from any inaccuracy. Prices as at 29/03/2019
Reports and other documents published on this website and email (‘Reports’) are authored by Market Matters and the reports represent the views of Market Matters. The MarketMatters Report is based on technical analysis of companies, commodities and the market in general. Technical analysis focuses on interpreting charts and other data to determine what the market sentiment about a particular financial product is, or will be. Unlike fundamental analysis, it does not involve a detailed review of the company’s financial position.
The Reports contain general, as opposed to personal, advice. That means they are prepared for multiple distributions without consideration of your investment objectives, financial situation and needs (‘Personal Circumstances’). Accordingly, any advice given is not a recommendation that a particular course of action is suitable for you and the advice is therefore not to be acted on as investment advice. You must assess whether or not any advice is appropriate for your Personal Circumstances before making any investment decisions. You can either make this assessment yourself, or if you require a personal recommendation, you can seek the assistance of a financial advisor. Market Matters or its author(s) accepts no responsibility for any losses or damages resulting from decisions made from or because of information within this publication. Investing and trading in financial products are always risky, so you should do your own research before buying or selling a financial product.
The Reports are published by Market Matters in good faith based on the facts known to it at the time of their preparation and do not purport to contain all relevant information with respect to the financial products to which they relate. Although the Reports are based on information obtained from sources believed to be reliable, Market Matters does not make any representation or warranty that they are accurate, complete or up to date and Market Matters accepts no obligation to correct or update the information or opinions in the Reports. Market Matters may publish content sourced from external content providers.
If you rely on a Report, you do so at your own risk. Past performance is not an indication of future performance. Any projections are estimates only and may not be realised in the future. Except to the extent that liability under any law cannot be excluded, Market Matters disclaims liability for all loss or damage arising as a result of any opinion, advice, recommendation, representation or information expressly or impliedly published in or in relation to this report notwithstanding any error or omission including negligence.


