Some Energy Stocks are Hitting our Targets, is it Time to Buy? (BHP, BPT, ORG, VALE.US, WSA)
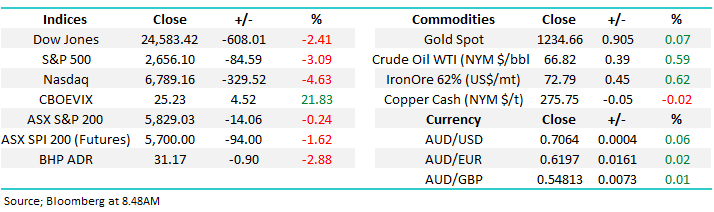
The ASX200 tried to get up off the floor yesterday morning, but alas the recently ingrained negativity was simply too much and the market drifted lower to close down -0.2% for day – pretty tame stuff for this month. It was actually a very quiet session throughout Asia, with none of the big indices +/- more than 0.4%. In hindsight our markets lack of motivation to rally after the US stocks had enjoyed such a strong recovery proved on the money as overnight the US market gave back the bounce and some with the Dow closing down over 600-points.
Across the boards we had some standout pockets of both strength and weakness with banks, healthcare and real estate sectors adding some support while the energy, resources and retail groups were sold off throughout the day i.e. the market had a clear penchant for the more risk adverse sectors. It’s tough on our market from both a points and sentiment perspective when BHP falls well over 2% with another 3% drop in the US this morning, the $31 area is under threat.
US / Europe indices were weak overnight but the US led the charge, especially in the last hour when its losses basically doubled . It’s very important today not to freeze in the headlight of panic but to be pro-active.
Firstly let’s focus on the US which is clearly the tail wagging the dog:
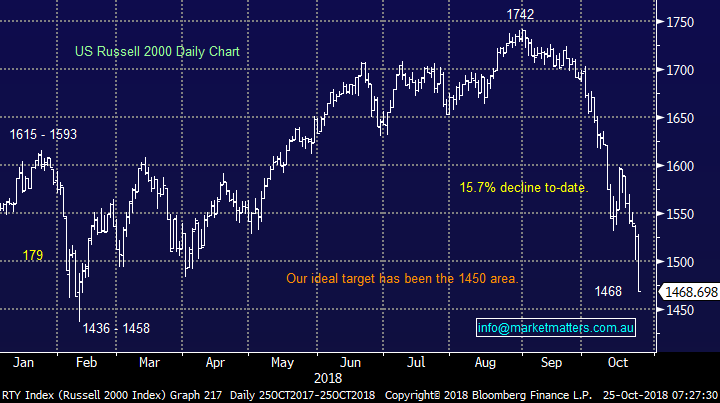
1 – MM has been targeting the 1450 area for the Russell 2000 for many weeks, while we didn’t expect last night’s sharp decline, the index is less than 1% above this area having declined over 15% since late August.
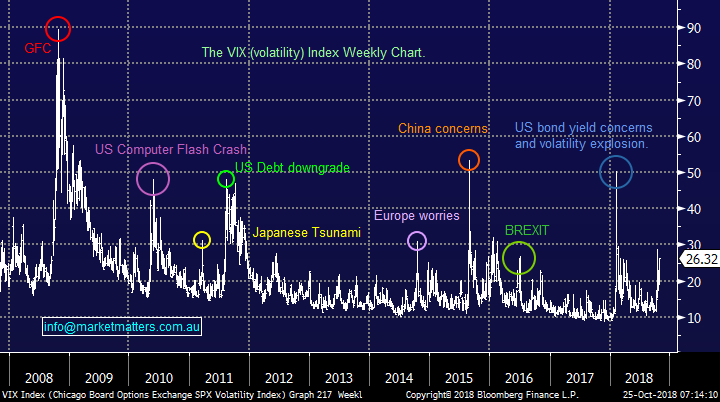
2 – The Volatility Index still remains below last week’s high, even after the last nights plunge.
Hence we are now neutral /bullish US stocks in the short-term although we would reiterate one underlying theme which we believe will remain:
The longest bull market in history is mature or even finished, we believe with confidence that volatility will remain elevated moving into 2019/20 and this a perfect market for the active investor prepared to buy weakness and sell strength
US Russell 2000 Index Chart
Fear Index / Volatility Gauge (VIX) Chart
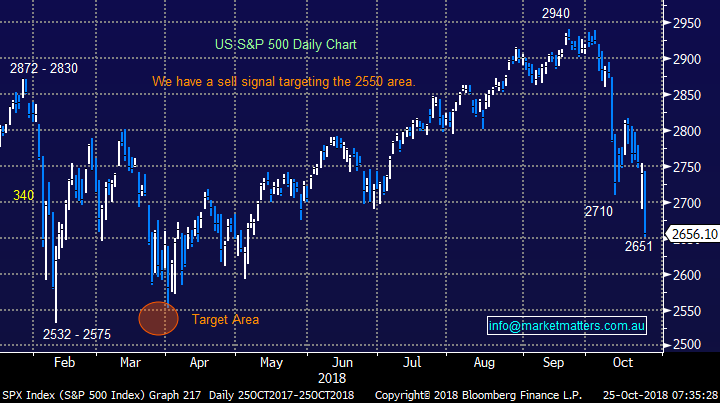
Our exit from our BBUS short equities ETF position is obviously frustrating this morning – clearly a day early however we simply followed our plan to buy the S&P500 on a spike below 2700.
Given the falls last night and the S&P’s failure to hold onto the solid gains from the lows the prior session we still have an eventual technical target of ~2550, 4% below this mornings close, however our preference remains that the S&P rallies from the current area back above 2800 as a “washout” certainly feels behind us / underway.
We will be watching the market very carefully for a reversal in the Russell 2000, it has led the decline and is likely to lead the recovery, even if it’s only a minor bounce.
US S&P500 Chart
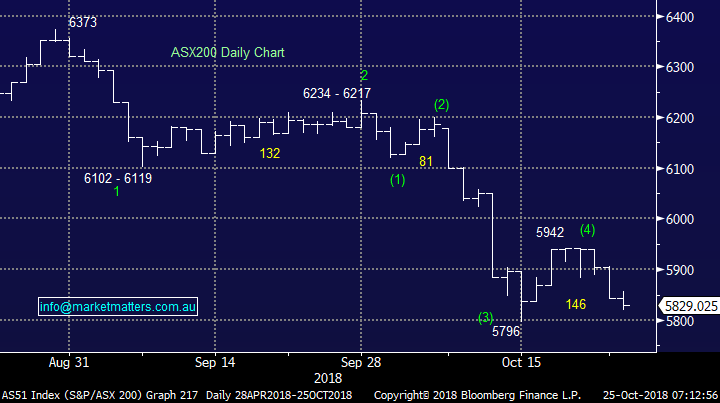
Looking locally, we have been looking for the 5750-5800 area in the ASX200 to complete this leg of the decline by local stocks, the futures are pointing to an open around 5775, or down 75-points / 1.5% this morning.
MM will turn short term bullish this morning after the markets gap lower on open looking to be on the buy side.
If we follow the US significant weakness will be experienced in the energy, resources and IT space whereas the consumer staples, real estate and utilities actually closed in the green – looks like we also pre-empted the move on the sector level yesterday.
ASX200 Chart
Today’s report was initially going to focus on the oil sector but obviously with huge volatility unfolding overnight its almost taken a secondary spot.
The markets shifted very “anti-risk” over the last 2-months, it’s time to query if this has gone too far and oil is regularly regarded as risk / growth indicator making it an excellent place to start.
Crude Oil
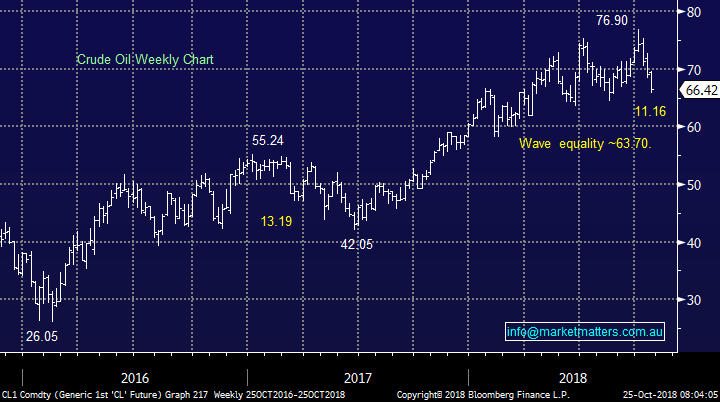
Crude oil was the flavour of the month at the start of October but as we so often see when too many people have the same opinion it’s likely to go “pear shaped”. Santos announcing plans to double production has proved to be the canary in the coal mine! Crude has corrected almost 14% in just 4-weeks taking our energy sector down over 8% in the last month and if BHP is a reasonable guide it’s likely to be over 10% this morning.
We now believe crude is close to a decent risk / reward buy with our ideal target around the $US64/barrel area, or 3-4% lower i.e. the market should bounce shortly.
Two points to consider at this moment in time:
1 – resource / energy stocks usually bottom before their underlying related commodities.
2 – we could no longer be short crude oil and believe it will be higher in ~2-weeks.
Crude Oil Chart
Now we are going to briefly look at 3 prominent Crude oil producers to see if any attractive risk / reward opportunities are close to hand:
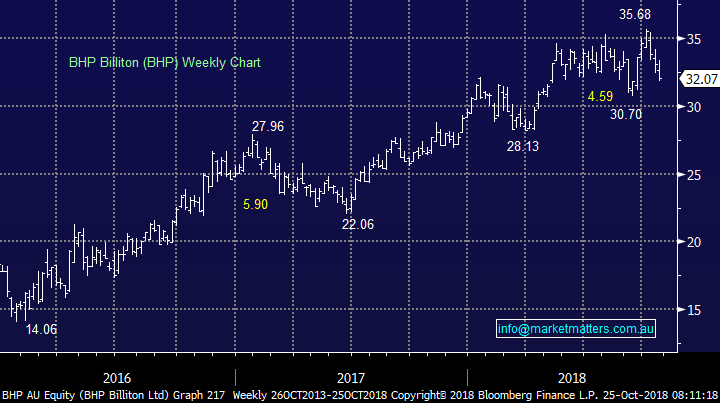
1 BHP Billiton (BHP) $32.07
BHP looks set to open close to $31 this morning, around 13% below its high at the start of this month.
We sold out of BHP a few months ago around $34 and have been waiting for the opportunity to re-enter around $30.
It’s tempting to buy BHP into today’s panic with the plan to average around $30 if the opportunity does present itself.
We are confident that BHP will produce a great result but must question how much is built into today’s price, with its AGM looming in early November we are pondering gaining some exposure in case they literally “knock it out of the park”.
BHP Billiton (BHP) Chart
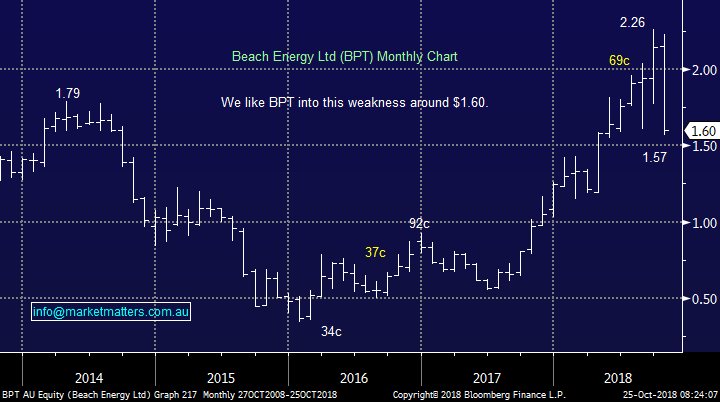
2 Beach Energy (BPT) $1.60
BPT has been slammed over 30% this month by the market as its hit by the double whammy of falling energy prices and lack of support for its agreed sale of 40% of its Victorian Otway interests to Eyal Ofer’s O.G. Energy for $344 million.
By definition its 2019 FY 2019 guidance was reduced due to its diluted position.
We now like BPT from a risk / reward perspective into weakness around $1.50.
Beach Energy (BPT) Chart
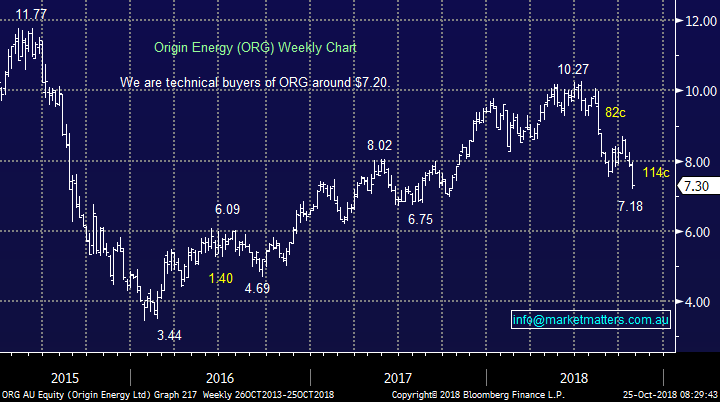
3 Origin Energy (ORG) $7.30
ORG has been slammed over 30% from its 2018 high, just like BPT.
We have had the energy producer in our “chart of the week” a few times this year calling it a sell targeting a break below $7.50, we are now there.
MM likes ORG from a risk / reward perspective close to $7.
Origin Energy (ORG) Chart
Resources
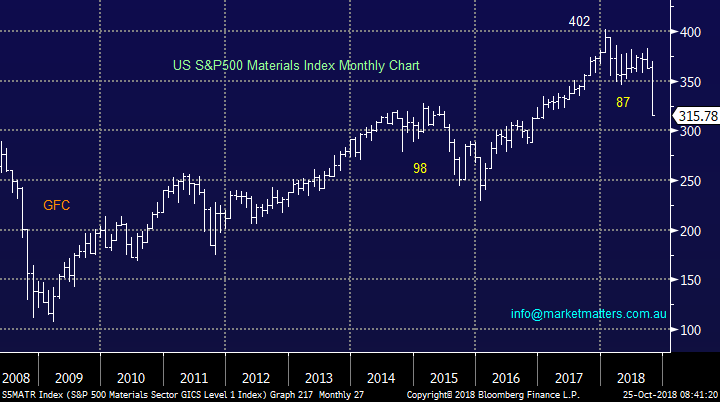
The US materials / resources sector was slammed overnight taking its decline in 2018 to 21.3%, its approaching now or never in our opinion for this sector to hold onto its bullish stance.
We believe that China has flexed its muscles around their stock market and more is likely and this would clearly benefit this sector – potentially dramatically.
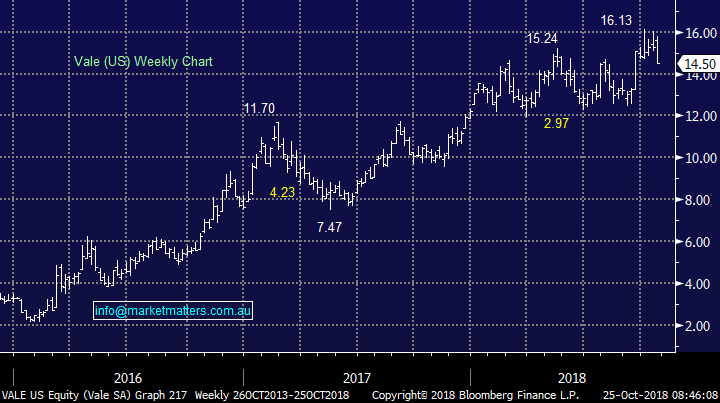
Vale is highly correlated to the likes of BHP and RIO and unfortunately its generating sell signals for us targeting more than 15% downside a warning flag and reason tom perhaps not chase BHP / FMG above our targeted buy areas.
S&P500 Materials Index Chart
Vale US (VALE) Chart
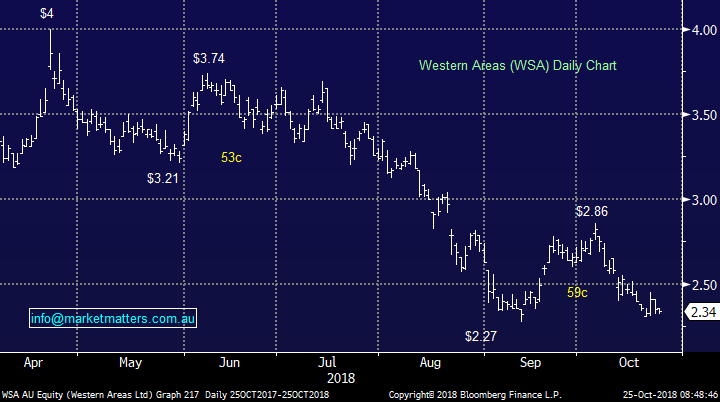
We believe any catching of this falling knife in the resources sector should be stock specific.
Our favoured short term is stock remains WSA where we are a buyer around / below $2.20.
Western Areas (WSA) Chart
Conclusion
1 - MM is bullish the ASX200 from the 5775 area it looks set to open today.
2 - We remain mildly bullish US stocks, at least in the short-term although this was a shot we fired too early yesterday.
3 – We like energy stocks and selective resources into current weakness.
4 – If / when we use our free cash up to buy this current weakness we will be looking to reduce our exposure to certain stocks into a bounce e.g. ALL around $29.50, CSL ~$195, COH ~$185, RHC above $58 and of course HSO depending on the takeover.
We maybe be buyers of weakness BUT we will also be sellers of strength / bounces
Overnight Market Matters Wrap
· The US equity markets extended its selloff aggressively overnight, erasing all of this year’s gains, with the tech. heavy Nasdaq 100 losing the most.
· The defensive sectors were the clear winners overnight, with the utilities up 2.30%, followed by the real estate and consumer staples.
· October has been an exhausting month for the markets, with the Nasdaq now down over 11%, the S&P 500 -8.9% and the Dow -7.1% in moves similar to the early year selloff.
· The volatility index (VIX) sold off to 24 (up 100% this month) while the US bond market rallied to 3.1% on fears of slowing growth after data showed new home sales fell to two year lows.
· Commodities were slightly weaker again with crude oil dropping to US$66.82/bbl. while the Aussie dollar is slightly lower at US70.64c.
· An expected sharp sell-off from the get go is expected to be experienced this morning, with the December SPI Futures indicating the ASX 200 to open 110 points lower towards the 5720 level.
Have a great day!
James & the Market Matters Team
Disclosure
Market Matters may hold stocks mentioned in this report. Subscribers can view a full list of holdings on the website by clicking here. Positions are updated each Friday, or after the session when positions are traded.
Disclaimer
All figures contained from sources believed to be accurate. Market Matters does not make any representation of warranty as to the accuracy of the figures and disclaims any liability resulting from any inaccuracy. Prices as at 25/10/2018
Reports and other documents published on this website and email (‘Reports’) are authored by Market Matters and the reports represent the views of Market Matters. The MarketMatters Report is based on technical analysis of companies, commodities and the market in general. Technical analysis focuses on interpreting charts and other data to determine what the market sentiment about a particular financial product is, or will be. Unlike fundamental analysis, it does not involve a detailed review of the company’s financial position.
The Reports contain general, as opposed to personal, advice. That means they are prepared for multiple distributions without consideration of your investment objectives, financial situation and needs (‘Personal Circumstances’). Accordingly, any advice given is not a recommendation that a particular course of action is suitable for you and the advice is therefore not to be acted on as investment advice. You must assess whether or not any advice is appropriate for your Personal Circumstances before making any investment decisions. You can either make this assessment yourself, or if you require a personal recommendation, you can seek the assistance of a financial advisor. Market Matters or its author(s) accepts no responsibility for any losses or damages resulting from decisions made from or because of information within this publication. Investing and trading in financial products are always risky, so you should do your own research before buying or selling a financial product.
The Reports are published by Market Matters in good faith based on the facts known to it at the time of their preparation and do not purport to contain all relevant information with respect to the financial products to which they relate. Although the Reports are based on information obtained from sources believed to be reliable, Market Matters does not make any representation or warranty that they are accurate, complete or up to date and Market Matters accepts no obligation to correct or update the information or opinions in the Reports. Market Matters may publish content sourced from external content providers.
If you rely on a Report, you do so at your own risk. Past performance is not an indication of future performance. Any projections are estimates only and may not be realised in the future. Except to the extent that liability under any law cannot be excluded, Market Matters disclaims liability for all loss or damage arising as a result of any opinion, advice, recommendation, representation or information expressly or impliedly published in or in relation to this report notwithstanding any error or omission including negligence.


