Should we “dump” the disappointing Australian gold sector? (NEA, GDX US, NCM, EVN, RRL, NST, GOR)
The ASX200 drifted lower slowly but surely throughout the session on the penultimate trading day of the week with a combination of worsening news around coronavirus and falling global equity markets the obvious catalysts. While the selling was fairly broad-based volumes remain subdued with noticeable profit taking in the previously hot sectors, as opposed to the China facing names e.g. Healthcare, IT and Utilities. Just for good measure we had another couple of negative downgrades for stocks in the ASX200, Nearmap Ltd (NEA) -29.8% & Pilbara Minerals (PLS) -11.9%
The big 4 banks contained any meaningful market decline with the indexes largest stock CBA up an impressive 1%, we continue to believe the banking sector will outperform in 2020. CBA is up over $20 / 30% since its October 2018 low, not bad when we consider its also paid $4.31 in fully franked dividends during this advance. I still feel like we are in the minority with this view but as CBA’s still likely to yield over 5% fully franked it’s hard for me to imagine the stock being sold particularly aggressively unless some fresh negative sector news crosses my desk.
The coronavirus pandemic saw the number of cases and related deaths increase by a scary 30% over the last 24-hours, it appears the virus is far more infectious than SARS but not as deadly.
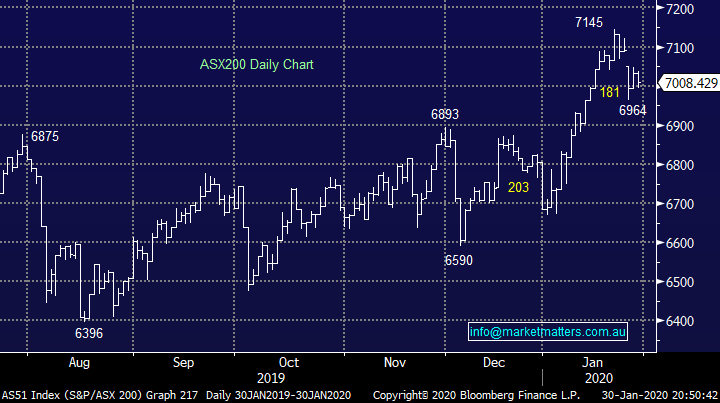
MM remains bullish the ASX200 while it holds above 6930.
Overnight US stocks were weak early but strong late to close higher on the day. The catalyst was the World Health Organisation (WHO) declaring a global emergency on coronavirus which means a more coordinated global effort now plays out. That led to an aggressive move up from the daily lows with the Dow Jones rallying an impressive 370pts to close near the session highs. At our close yesterday, US Futures were down 0.6% hence the SPI futures hence SPI Futures are pointing to a gain of +37 points / 0.53% for the final day on January.
Today we’ve taken another look at the Australian gold sector which has failed to embrace gains in the precious metal – generally MM is very wary of stocks that don’t embrace good news.
ASX200 Chart
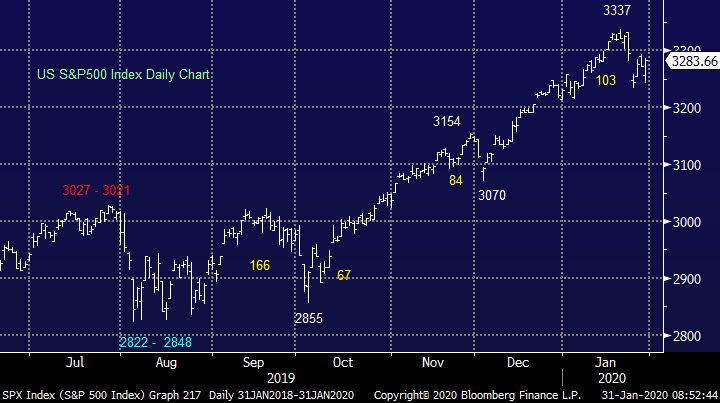
US stocks are now chopping around after a 3% pullback from recent highs. While January has been an exception month for global equities, we expect February will see more volatility, our ideal technical target for the S&P500 is below 3200, or ~2.5% lower.
MM is still looking for lower levels before considering buying opportunities in general.
US S&P500 Index Chart
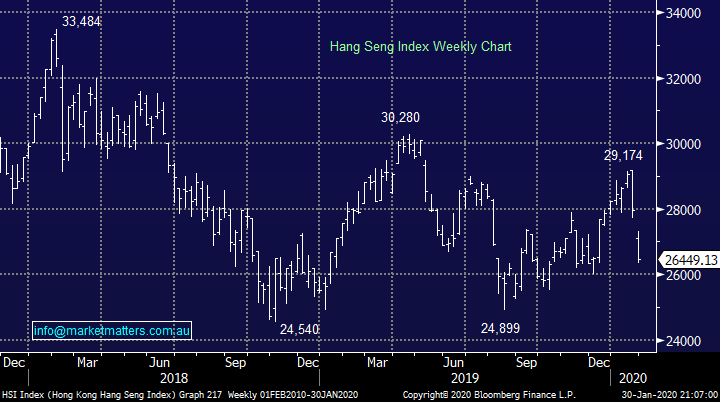
Yesterday saw Hong Kong stocks whacked another 711--points / 2.6% but this time the Asian selling did spread, dragging down both the US futures and our own index in the process. Its worth noting that the Chinese Index is closed until at least Monday hence if investors want / need to exit Chinese stocks the likelihood is they would do at least in part through a quasi-method of selling across the whole region - in my experience if Chinese stocks do actually reopen on Monday and we see an early flurry of panic selling it could end up being the low for equities.
MM still likes Asian stocks into current weakness.
Hong Kong’s Hang Seng Index Chart
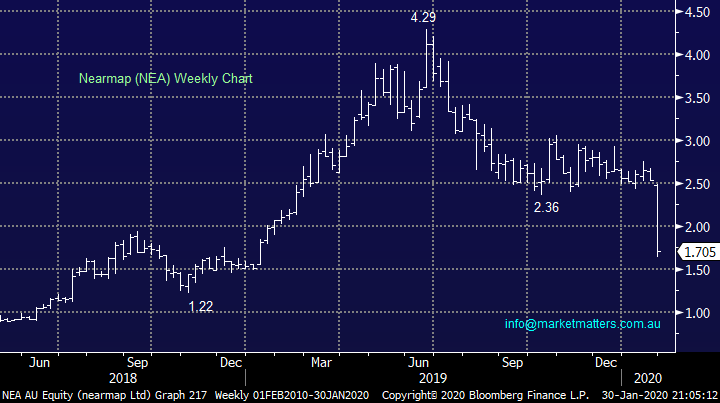
Again yesterday we saw “confession season” produce one extremely painful landmine as Nearmap (NEA) was hammered almost 30%, it’s a negative thought process but from MM’s perspective it’s always a relief every time the downgrade occurs and we have no exposure to the casualty. We were actually asked a question on NEA this week and our answer in the report was on the money, although in hindsight probably not bearish enough! Worth also noting that NEA was the 4th most tipped small cap stock for 2020 in a wide-ranging LiveWire Markets survey (behind EML, PBH, & EOS).
“NEA is a $1.1bn business which continues to carry a short position of over 12% making it the 7th most shorted stock in the ASX, very rarely an attractive indicator. The markets concerned around the company’s future growth as competition increases from the likes of AMX which you mentioned in the question hence NEA is not one for us at this stage: MM is neutral / bearish NEA.”
MM still has no interest in Nearmap (NEA).
Nearmap (NEA) Chart
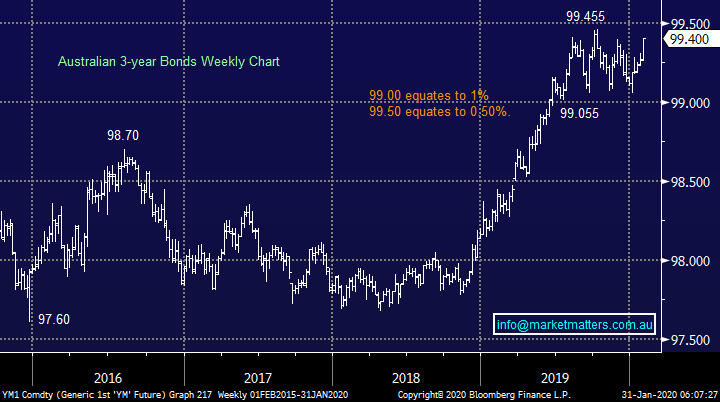
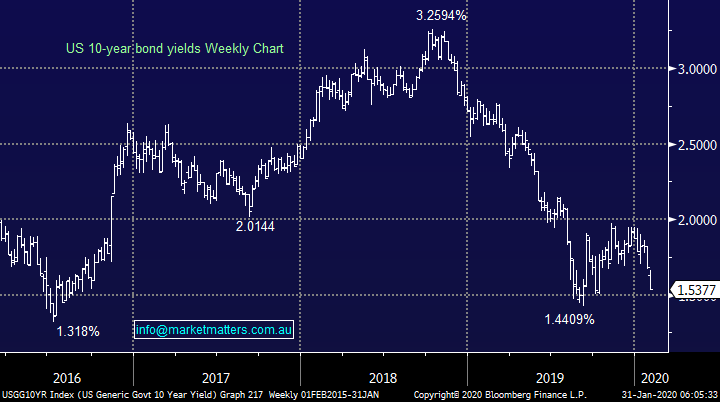
The safety of bonds continues to attract investors with the Australian 3-years and US 10-years rallying, sending their respective yields tumbling. MM expects global bond yields to make fresh lows as concerns escalate around how much the coronavirus will curtail China’s GDP (growth) – our opinion is short-term a lot but medium-term we feel they will throw the proverbial “kitchen sink” at their economy to get growth back above their minimum target of 6%.
MM remains bullish both the Australian and global bonds i.e. short- term yields lower.
Australian 3-year Bonds Chart
US 10-year Bond Yield Chart
Re-evaluating the Australian gold sector
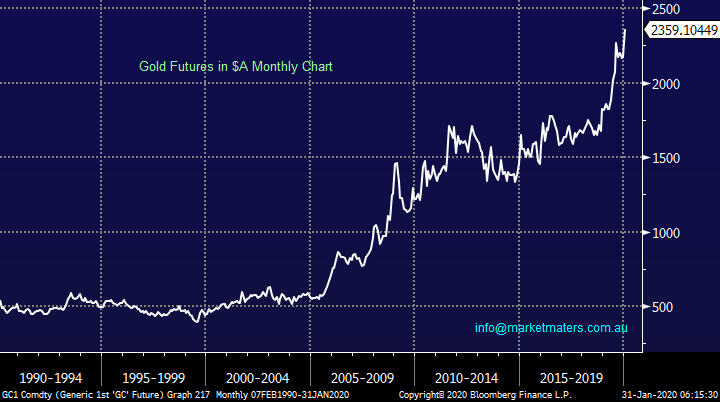
The underlying gold price in Aussie Dollar terms is surging to fresh all-time highs enjoying a positive 2-edged sword:
1 – The gold price in its usually quoted $US/oz is making 6-year highs as bond yields fall on global growth concerns and of course the coronavirus increases the attraction of safe assets.
2 – The $A is falling, again because investors are concerned around how much the Chinese economy will slow down leading to a lower demand for our commodity exports.
Here lieth the problem, everything is suggesting the local gold sector should be enjoying strong tailwinds but stocks like Newcrest (NCM) and Regis Resources (RRL) remain well over 20% below their 2019 highs. Potentially this is a sign that investors remain underlyingly bullish equities and safe havens like gold stocks aren’t appealing although this thought process is contradicted by the underlying gold price.
MM’s primary focus is on our 6% exposure to the sector via Newcrest (NCM) and Evolution (EVN) in our Growth Portfolio – as we often say “look after your downside and the upside will look after itself” or reworded look after the positions that are not performing.
Gold Futures in $A Chart
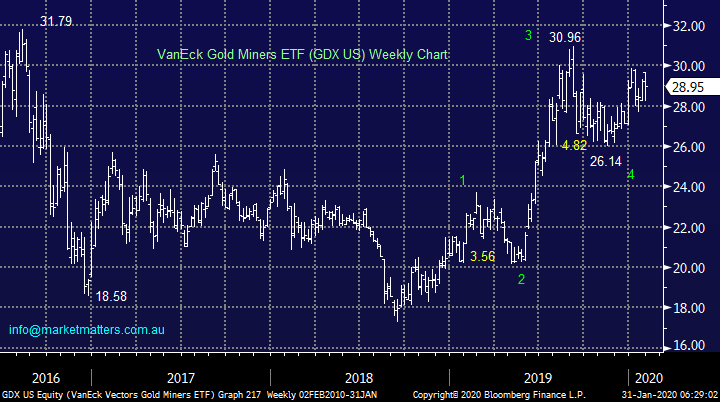
As we can see below its not just the Australian gold sector that’s not performing in 2020, gold miner’s ETF’s like the GDX shown below are not following the underlying precious metal to fresh multi-year highs. However, these ETF’s are only ~7% below their 2019 highs, significantly outperforming our own sector over the last 5-6 months.
We regard the gold sector as a relatively speculative / sentiment driven asset class and recent times have illustrated this clearly i.e. investors got way too bullish as buying primarily out of China pushed stocks higher in 2019.
MM remains bullish gold ETF’s with a 2020 upside target ~8-10% higher.
VanEck Gold Miners ETF (GDX US) Chart
So far it’s been an uncomfortable ride for MM in our gold positions, I would have thought they would be soaring if I just knew the gold price and Chinas evolving issues, a great illustration that short-term stock movements is not a logical / perfect science. Today I have briefly looked at 5 major Australian gold stocks, including the 2 we own Newcrest (NCM) and Evolution Mining (EVN).
I sort of feel our gold sector is about as pessimistic as it was optimistic around 6-months ago.
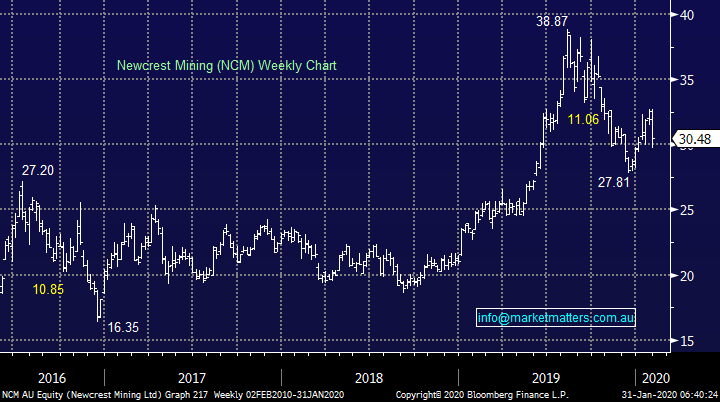
1 Newcrest Mining (NCM) $30.48
Australian gold heavyweight NCM has struggled this week after raising concerns around water becoming an issue at the end of 2020 if current conditions persist, a prudent warning which we feel the market probably took worse than it should. If we had no position, we would be tempted to buy around the $30 area from a risk / reward perspective hence patience feels logical at this point in time.
Our ideal exit for NCM is now ~$34.
Newcrest Mining (NCM) Chart
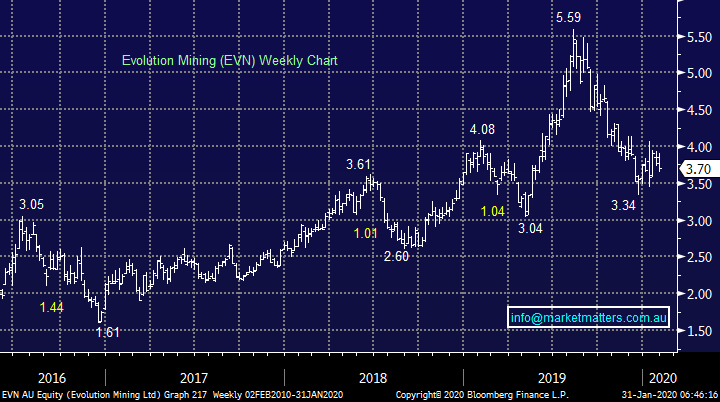
2 Evolution Mining (EVN) $3.70
EVN has clearly struggled since 2019 and it disappointed the market again this week with its quarterly update although it showed strong free cash flow allowing it to pay down debt and increase cash levels to over $170m – not too bad. The company-maintained guidance while it has an all-in cost of ~$US965 leaving plenty of margin at today’s gold price of $US1585.
Our ideal exit for EVN is now ~15% higher.
Evolution Mining (EVN) Chart
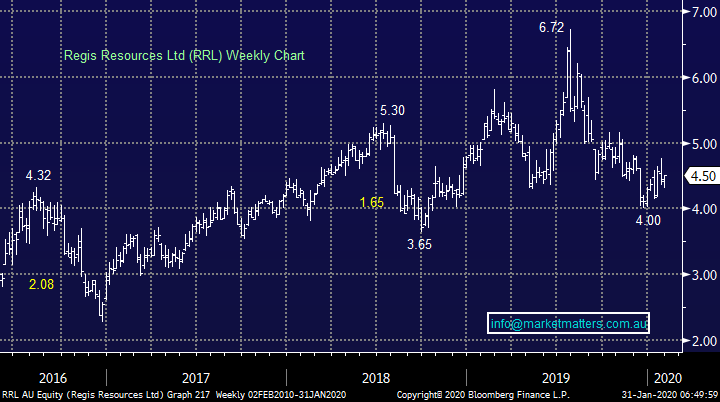
3 Regis Resources (RRL) $4.50
RRL has followed a similar path to both EVN and NCM but it’s encouraging to see a bullish technical picture initially targeting ~10% upside.
MM is bullish RRL short-term targeting ~$5.
Regis Resources (RRL) Chart
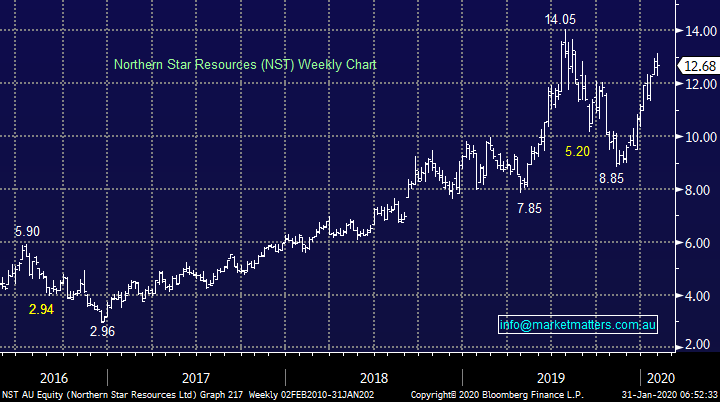
4 Northern Star Resources (NST) $12.68
NST has significantly outperformed in the sector in 2020 showing how gold stocks can turnaround from looking their worst. The catalyst being a good acquisition (along with Saracen) of the Kalgoorlie Super Pit.
Impressively the stock has absorbed 2 major broker downgrades of late without any material reflection in price, a great sign.
MM is bullish NST ultimately looking for a break of $14.
Northern Star Resources (NST) Chart
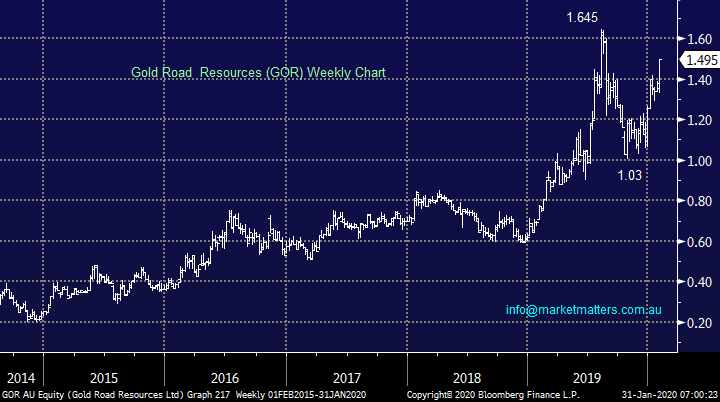
5 Gold Road Resources (GOR) $1.495
GOR soared over +11% yesterday after releasing a positive quarterly update which showed a strong finish to last year. As opposed to NCM who are on track to hit the lower end of their guidance GOR is at the other end of the spectrum achieving the top end of their target while enjoying a high gold price and reduced costs which obviously equals solid cash flow.
This relatively junior gold miner already has a market cap above $1.3bn and looks destined to outperform the sector in 2020 – unfortunately we seem to be sitting on the back of two gold donkeys at present as the thoroughbreds speed past!
MM is bullish GOR targeting fresh highs over $1.65.
Gold Road Resources (GOR) Chart
Conclusion
While MM is frustrated by our gold positions at present, we still don’t feel it’s the optimum time to be selling – patience for now grasshopper!
Overnight Market Matters Wrap
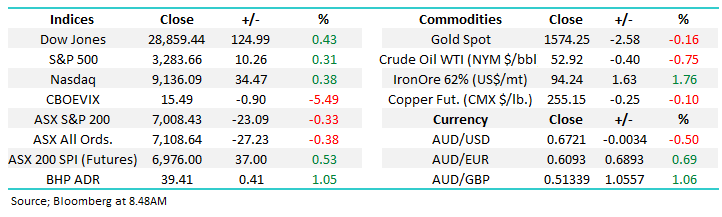
· Wall St staged a late rally to recoup early losses, with the Dow closing over 120 pts higher (+0.43%), having been 250 pts lower in earlier trading. The World Health Organisation (WHO), declared China’s coronavirus a global health emergency, as the death toll rose to 171 and the number affected by the disease to over 8200. However, investors were encouraged by the WHO endorsement that China had the situation under control.
· The commodity market also staged a late rally, having earlier sold off again on concerns about the disease’s impact on China’s and global economic growth. Copper prices hit a new 3 month low of US$2.52/lb before recovering to US$2.55/lb, while the Brent oil price recovered from below US$58/bbl to around US$59/bbl (-1.6%). Earlier, European markets closed about 1.4% weighed down by material stocks.
· The late rally on Wall St has seen the local futures rally 0.5%. Investors will be watching for key manufacturing and services PMI data in China for January, which is due to be released at midday, for early signs of the impact of the coronavirus on China’s growth. Safe haven assets US 10 year bonds and gold both rallied again overnight, albeit losing some ground as equity markets rallied, with bonds at 1.55% after hitting 1.54% in earlier trading, and gold around US1577/Oz, while the A$ weakened further to just above US67.2c.
Have a great day!
James & the Market Matters Team
Disclosure
Market Matters may hold stocks mentioned in this report. Subscribers can view a full list of holdings on the website by clicking here. Positions are updated each Friday, or after the session when positions are traded.
Disclaimer
All figures contained from sources believed to be accurate. All prices stated are based on the last close price at the time of writing unless otherwise noted. Market Matters does not make any representation of warranty as to the accuracy of the figures or prices and disclaims any liability resulting from any inaccuracy.
Reports and other documents published on this website and email (‘Reports’) are authored by Market Matters and the reports represent the views of Market Matters. The Market Matters Report is based on technical analysis of companies, commodities and the market in general. Technical analysis focuses on interpreting charts and other data to determine what the market sentiment about a particular financial product is, or will be. Unlike fundamental analysis, it does not involve a detailed review of the company’s financial position.
The Reports contain general, as opposed to personal, advice. That means they are prepared for multiple distributions without consideration of your investment objectives, financial situation and needs (‘Personal Circumstances’). Accordingly, any advice given is not a recommendation that a particular course of action is suitable for you and the advice is therefore not to be acted on as investment advice. You must assess whether or not any advice is appropriate for your Personal Circumstances before making any investment decisions. You can either make this assessment yourself, or if you require a personal recommendation, you can seek the assistance of a financial advisor. Market Matters or its author(s) accepts no responsibility for any losses or damages resulting from decisions made from or because of information within this publication. Investing and trading in financial products are always risky, so you should do your own research before buying or selling a financial product.
The Reports are published by Market Matters in good faith based on the facts known to it at the time of their preparation and do not purport to contain all relevant information with respect to the financial products to which they relate. Although the Reports are based on information obtained from sources believed to be reliable, Market Matters does not make any representation or warranty that they are accurate, complete or up to date and Market Matters accepts no obligation to correct or update the information or opinions in the Reports. Market Matters may publish content sourced from external content providers.
If you rely on a Report, you do so at your own risk. Past performance is not an indication of future performance. Any projections are estimates only and may not be realised in the future. Except to the extent that liability under any law cannot be excluded, Market Matters disclaims liability for all loss or damage arising as a result of any opinion, advice, recommendation, representation or information expressly or impliedly published in or in relation to this report notwithstanding any error or omission including negligence.


