Should we buy more gold stocks as volatility increases? – (CSL, EVN, GDX, MFG, NCM, NST, PGH, RSG, SAR)
Yesterday was another choppy day in the office for the ASX200, after opening strongly up around 30-points, following a strong lead from the US, we slowly slipped into the abyss actually going into the red over lunch before popping higher into the close. Healthcare was the standout sector courtesy of a +6.6% rally by CSL Ltd (CSL) on the back of a strong result while the gold stocks experienced some aggressive profit taking with most of the sector down by 5%, or more. This was not a broad-based strong day with 78% of the days point gain coming from CSL alone. The unpredictable news flow continues to create enormous volatility on stock, sector and index levels, we feel its time to hold on tight as the ride becomes increasingly bumpy but also very exciting!
Yesterday evening saw a sea of red wash over our screens following weak data out of both China and Germany along with a number of Tweets from President Trump criticising the path taken by the Federal Reserve – the combination of factors totally negated any optimism after Trump relaxed his aggressive attack on China through tariffs the prior day. Yield curves continue to invert with the headline US 2 & 10-years & the UK finally reaching the milestone overnight while US 30-years made fresh all-time lows as they flirt with the psychological 2% area – I wish I could borrow money for 30-years at 2%!
Basically the bond markets are painting a very bleak economic picture as we move into the second half of 2019, the only question as far as they are concerned appears to be how deep will the recession become, not if we will actually experience one.
If it wasn’t enough for the huge volatility coming from overseas indices this morning we also have a bumper day of reporting today with 17 companies on my list including the likes of ASX Ltd (ASX), QBE Insurance (QBE), Sydney Airports (SYD), Whitehaven Coal (WHC) and Telstra (TLS), initial coverage here in First Reactions:

MM remains comfortable adopting a conservative stance towards equities.
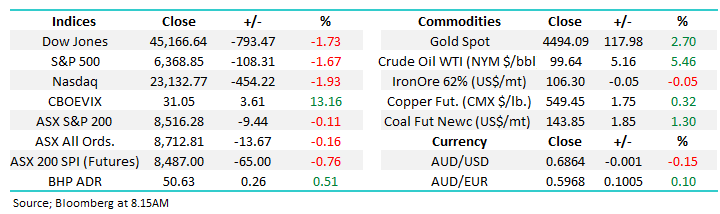
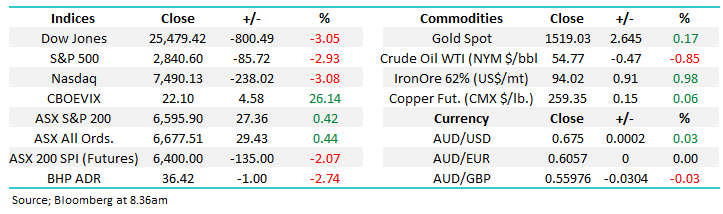
Overnight, US stocks were smacked with the Dow falling 800-points to test this months low, SPI futures are calling the ASX200 to plunge 135-points / 2% this morning, led by BHP which fell 2.5% in the US, not helped by oil tumbling 3.5%. There’s unlikely to be many places to hide this morning although the gold sector did bounce overnight.
Today we are going to focus on the Australian gold sector following yesterday's sharp decline for most of the local stocks and the overnight plunge by the US market.
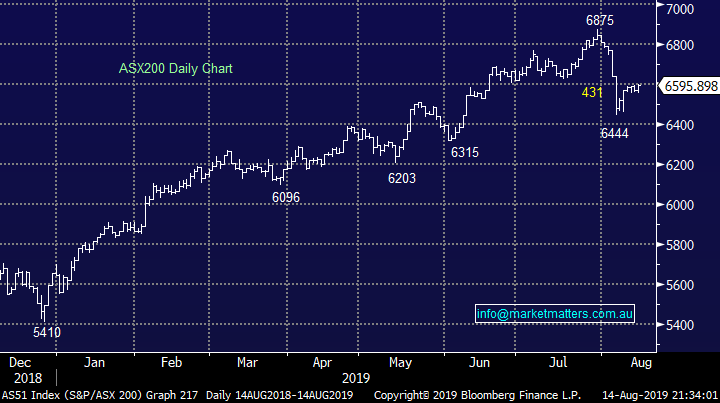
ASX200 Chart
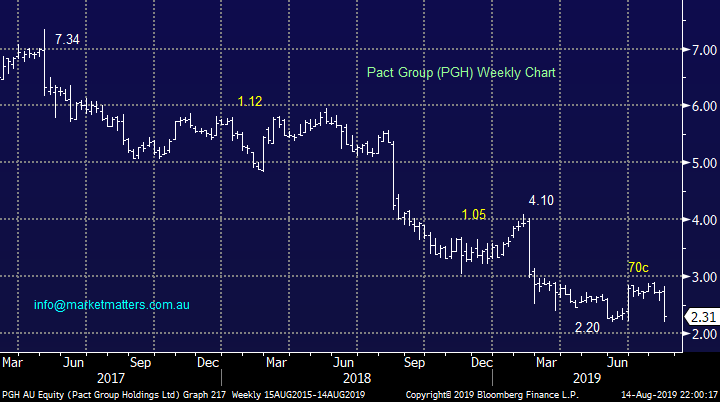
We are living with an unforgiving market as MM witnessed yesterday with Pact Group (PGH), the stock plunged almost 17% after reporting what we thought was an ok set of numbers. The result was broadly in-line with pre-released expectations and while the outlook moving forward was a touch soft it’s easy to describe them as sensibly conservative considering the current economic landscape.
It appears that many participants now have concerns around the company’s balance sheet plus a bit like with Adelaide Brighton (ABC) investors no longer appear prepared to hold / buy turnaround stories that are paying no yield – perhaps positions to cut and re-enter in 6-months’ time?
However, MM believes the fall was an overreaction and we would be looking to buy weakness if we had no existing position.
Pact Group (PGH) Chart
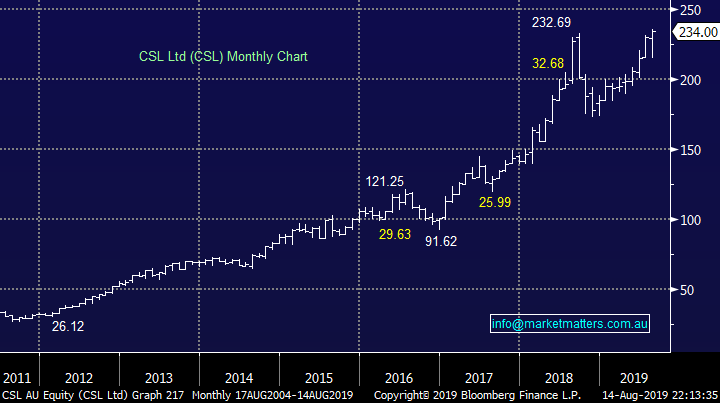
CSL is an undoubtedly a great company, but what price are the shares worth remains the question? Yesterdays solid set of numbers reiterated both of these points as we saw the stock make fresh all-time highs taking the companies Est. P/E for 2002 up to 34x in the process. Over the past 5 years CSL has traded on an average P/E of 26.7x however given the low interest rate environment and consistency of CSL’s growth, then a P/E of 34x is high, but not excessively so.
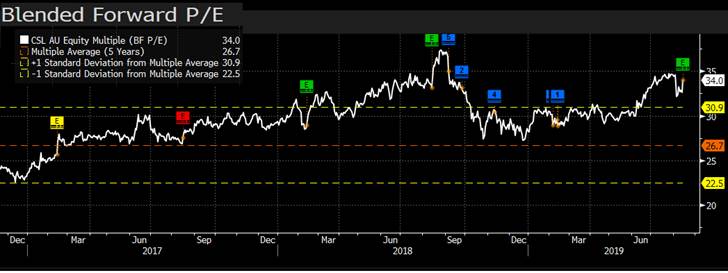
Technically, the stock has already corrected 14%, 17% and 24% over the last 3-years and we feel it’s likely to provide a far better entry opportunity on 2019 / 20 than chasing today's all-time highs. It’s obvious from the above P/E chart that a price on / around its long term P/E has offered support. On 26.7x CSL is worth $183.58 or around 20% lower.
MM is neutral CSL at current levels.
CSL Ltd (CSL) Chart
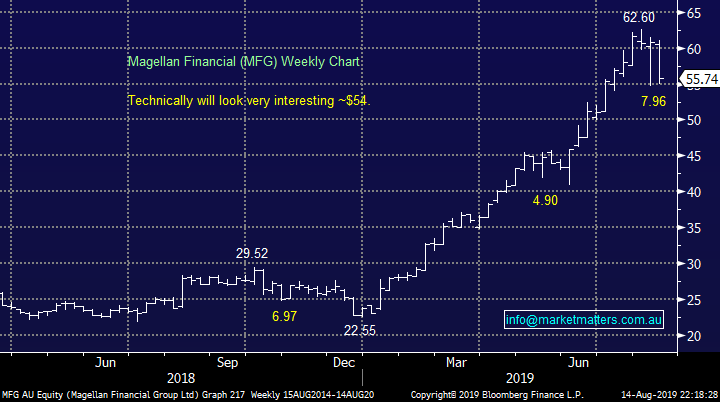
Magellan (MFG) fell 6.8% yesterday, closing above its capital raise price of $55.20 – the stock trades ex-dividend $1.114, 75% franked on Friday.
Magellan (MFG) Chart
Bond yields around the globe are inverting, and falling as they race towards zero, low interest rates appears to be the only thing holding stocks together although this morning that statement should have a “just” added to it.
Overnight the moves were fairly dramatic in bond yields, most professional investors believe that bonds lead equities, hence fund managers are becoming increasingly worried that stocks are likely to struggle in the next 1-2 years. The Fed knows they cannot “fight the market” and further global rate cuts feel close at hand – the futures are telling us the Fed will be cutting rates again soon and fairly hard, one things for sure, central banks will be getting increasingly uncomfortable as stocks tumble.
Interestingly Warren Buffett said back in May, “I think stocks are ridiculously cheap if you believe 3% on the 30-year bonds make sense” and yet here we are today and there almost at 2% implying they are the steal of the century!
MM believes the RBA will cut again in 2019 plus Fiscal Stimulus must be around the corner as ammunition on the interest rate front is almost spent.
US 30-year Bond Yield Chart

Overnight's inversion of the 2 & 10-years yield would probably have triggered some of the aggressive selling in S&P500 futures – when long term interest rates fall below those in the short-term historically it’s a huge warning as to the health of the economy.
MM believes central banks will be acting soon but it’s a big ask for them to stave off the looming global recession hence acts may be aggressive otherwise markets are going to say “too little too late”.
US 2 & 10-year bond yield Chart

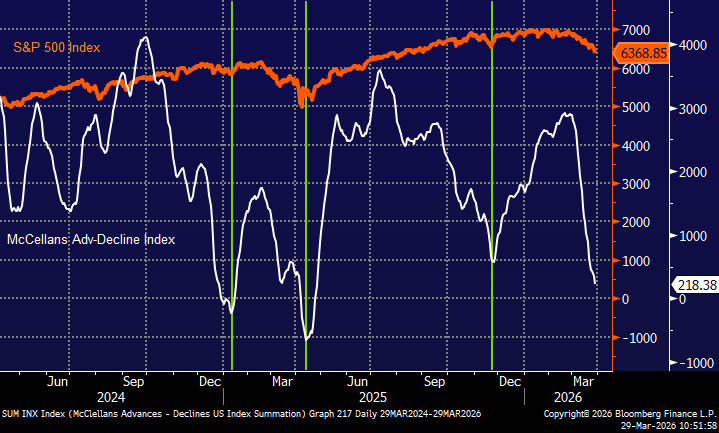
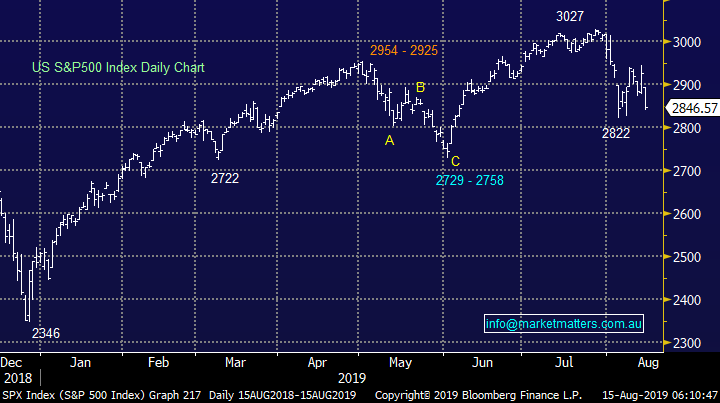
Recently we wrote “MM believes we have entered a new short-term cycle for US stocks where bounces should be sold for the active trader” this continues to feel on the money:
1 - Our initial target for this aggressive market correction is ~2750, now around 3.5% lower – another night like we just saw will probably do it!
2 – However this may only be the initial leg lower, our ultimate target for this market pullback is potentially ~2350, a retest of Decembers panic low – we are certainly getting increasing fundamental “alarm bells” providing reasons to test these levels.
These are exciting times, not ones to panic and runaway but its essential investors have a plan otherwise these dominant human emotions of “Fear & Greed” will wreak havoc on returns. The MM Growth Portfolio is holding 16% in cash plus 5% exposure to the GDX Gold ETF, relatively defensive and not that far before we may increase our short-term market exposure.
Please note we anticipate being relatively active for the Growth Portfolio, no great surprise when we are seeing a normal months volatility unfold in a single day.
Our initial target for this down leg in the S&P500 remains 2750, or ~3.5% lower.
US S&P500 Chart
Gold & its respective stocks
Gold's speculative long position is reaching record levels while the underlying gold miners are slowly losing momentum – importantly the miners usually lead. We feel that the precious metal is close to a short-term top which could easily unfold into an aggressive pullback/washout over the coming weeks.
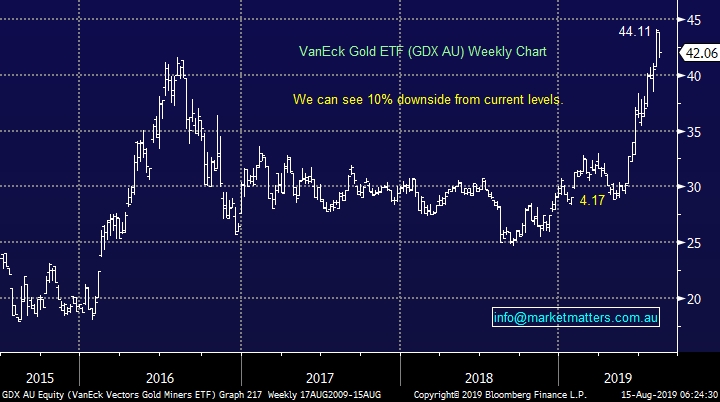
Last night's $US10/oz bounce in gold feels tired when we consider the plunge by both stocks and bond yields, both of which are usually very supportive for gold and the sector. Also the previous night’s reaction to issues in Argentina and Hong Kong was fairly muted, the GDX Gold ETF actually closed in the red hence we are bullish gold and gold stocks but a pullback feels close at hand e.g. Newcrest (NCM) has corrected 4.7% over the last 2-days alone. MM is considering taking our small profit in the GDX position which would increase our cash position in the Growth Portfolio above 20%.
MM remains bullish the gold complex but a pullback feels close at hand.
VanEck Gold ETF (GDX AU) Chart
Today we have briefly looked at 5 Australian gold stocks with one eye firmly on ideal risk / reward buying opportunities.
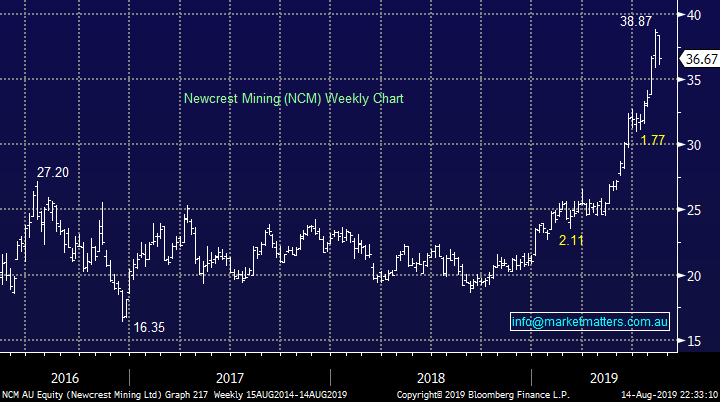
1 Newcrest Mining (NCM) $36.67
Australia’s largest gold miner Newcrest (NCM) has enjoyed a great year which “lined our pockets” in the process but its now got a lot of positive expectations to live up to tomorrow morning when it reports.
Reporting season has already thrown us some curve balls but assuming NCM delivers no surprises we will consider re-entering the gold producer back below the $35 region.
MM likes NCM into weakness.
Newcrest Mining (NCM) Chart
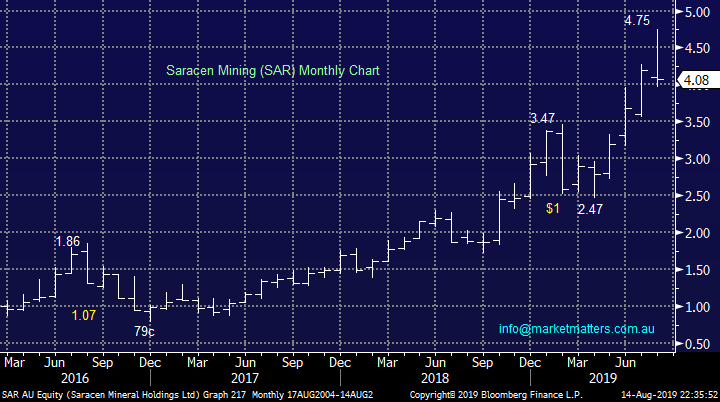
2 Saracen Mining (SAR) $4.08
SAR was smacked close to 9% yesterday illustrating the capability of the sector to experience a significant correction in the ensuing weeks. Technically another ~8% downside and the stock will start to look attractive from a risk / reward perspective.
MM likes SAR around $3.75.
Saracen Mining (SAR) Chart
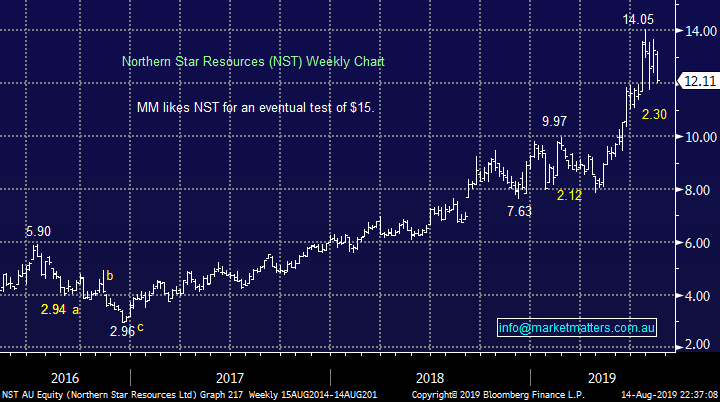
3 Northern Star Resources (NST) $12.11
NST has been a star performer within the sector but not without the volatility – 20% or greater pullbacks being commonplace.
The pattern is not surprisingly pretty similar across the sector with this major player looking attractive around 5% lower.
MM likes NST below $11.50.
Northern Star Resources (NST) Chart
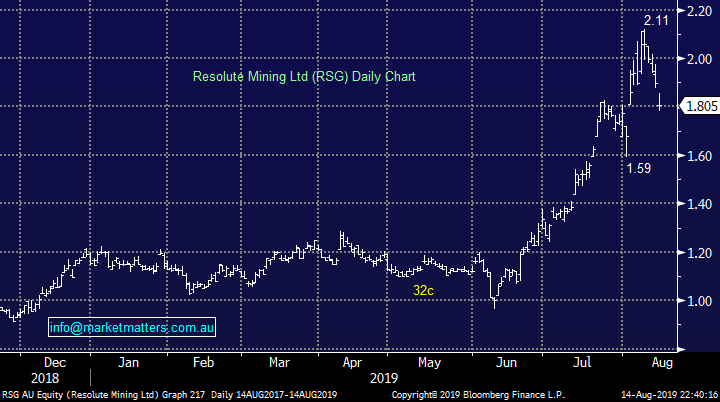
4 Resolute Mining (RSG) $1.80
RSG has been a standout performer amongst the major gold plays over recent weeks with the stock up +22% over the last 3-months, even after its recent 15% pullback.
MM currently likes RSG around the $1.60 area.
Resolute Mining (RSG) Chart
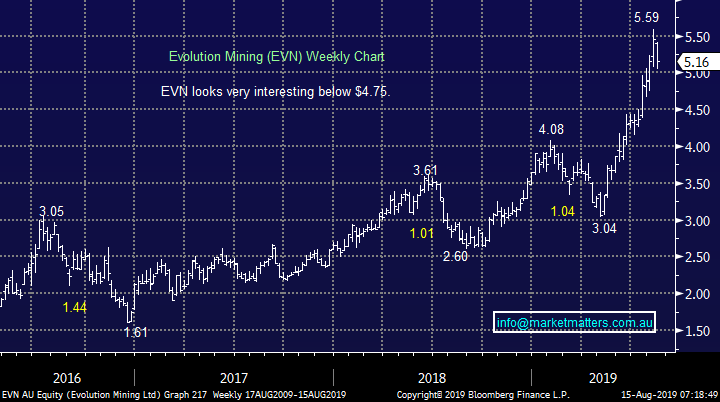
5 Evolution Mining (EVN) $5.16
EVN has surged over 80% from the lows of 2019 which easily provides room for a sharp correction, it closed 8% below its high yesterday. At this stage we would be very keen on EVN below $4.75 but this level might be tweaked in the weeks ahead.
MM currently likes EVN around the $4.60 area.
Evolution Mining (EVN) Chart
Conclusion (s)
MM remains bullish gold in the months ahead but a short-term “washout” feels a distinct possibility.
We are looking at the local individual gold stocks because of their current elevated volatility and we believe after the current pullback finishes we will see one more push higher before they go quiet for an extended period hence vehicles with the ability to rally hard and fast feel ideal if our outlook is correct.
Global Indices
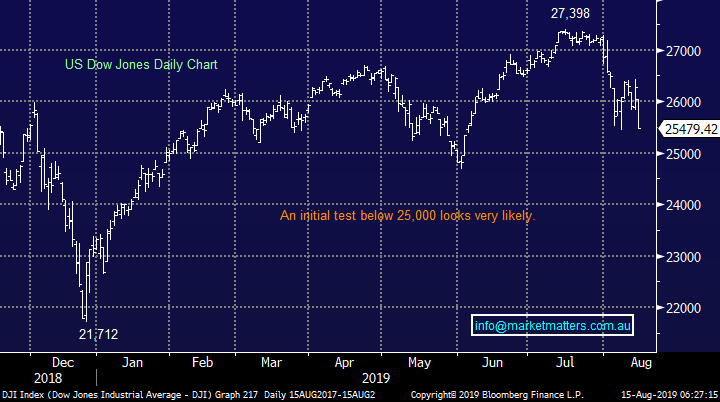
We believe US stocks are now bearish short-term as we touched on earlier. The Dows initial target is ~4% lower.
US stocks having reached our target area plus they have now also generated technical sell signals.
US Dow Jones Index Chart
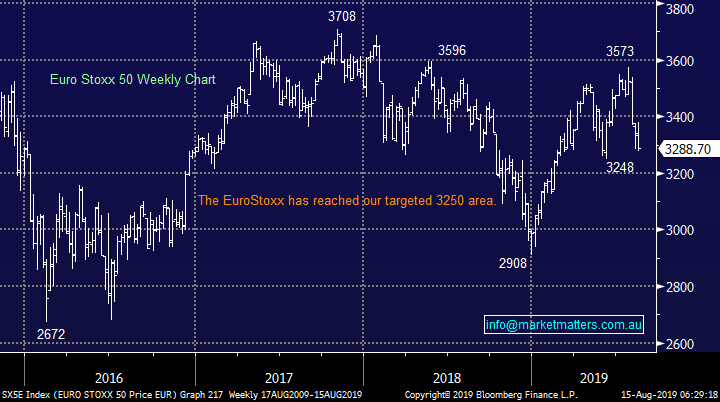
No change again with European indices, we remain very cautious European stocks as their tone has becoming more bearish over the last few weeks - we had been targeting a correction of at least 5% for the broad European indices, this has now been achieved.
Euro Stoxx 50 Chart
Overnight Market Matters Wrap
• The Dow, S&P 500 and NASDAQ all fell around 3% after the 2 year and 10 year Treasury yield curves inverted with the bond market suggesting a recession is a real chance.
• US banks were some of the worst performers while more than a third of S&P 500 companies are now in bear territory, having fallen more than 20%.
• The 10 year Treasury rate fell below the 2 year rate for the first time in 12 years while the 30 year yield fell to its lowest on record. Weak Chinese industrial data and a contraction in Germany’s economy led to fears for global growth.
• Copper fell 1% on the LME and oil gave back yesterday’s gains, down more than 3%. Gold rallied to $US1517. US 10 year bonds are yielding 1.58%
• The September SPI futures is indicating the ASX 200 to gap 140 points lower towards the 6450 level this morning.
Have a great day!
James & the Market Matters Team
Disclosure
Market Matters may hold stocks mentioned in this report. Subscribers can view a full list of holdings on the website by clicking here. Positions are updated each Friday, or after the session when positions are traded.
Disclaimer
All figures contained from sources believed to be accurate. Market Matters does not make any representation of warranty as to the accuracy of the figures and disclaims any liability resulting from any inaccuracy. Prices as at 15/08/2019
Reports and other documents published on this website and email (‘Reports’) are authored by Market Matters and the reports represent the views of Market Matters. The MarketMatters Report is based on technical analysis of companies, commodities and the market in general. Technical analysis focuses on interpreting charts and other data to determine what the market sentiment about a particular financial product is, or will be. Unlike fundamental analysis, it does not involve a detailed review of the company’s financial position.
The Reports contain general, as opposed to personal, advice. That means they are prepared for multiple distributions without consideration of your investment objectives, financial situation and needs (‘Personal Circumstances’). Accordingly, any advice given is not a recommendation that a particular course of action is suitable for you and the advice is therefore not to be acted on as investment advice. You must assess whether or not any advice is appropriate for your Personal Circumstances before making any investment decisions. You can either make this assessment yourself, or if you require a personal recommendation, you can seek the assistance of a financial advisor. Market Matters or its author(s) accepts no responsibility for any losses or damages resulting from decisions made from or because of information within this publication. Investing and trading in financial products are always risky, so you should do your own research before buying or selling a financial product.
The Reports are published by Market Matters in good faith based on the facts known to it at the time of their preparation and do not purport to contain all relevant information with respect to the financial products to which they relate. Although the Reports are based on information obtained from sources believed to be reliable, Market Matters does not make any representation or warranty that they are accurate, complete or up to date and Market Matters accepts no obligation to correct or update the information or opinions in the Reports. Market Matters may publish content sourced from external content providers.
If you rely on a Report, you do so at your own risk. Past performance is not an indication of future performance. Any projections are estimates only and may not be realised in the future. Except to the extent that liability under any law cannot be excluded, Market Matters disclaims liability for all loss or damage arising as a result of any opinion, advice, recommendation, representation or information expressly or impliedly published in or in relation to this report notwithstanding any error or omission including negligence.