Should we buck the trend and buy oil stocks today? (WPL, OSH, ORG, NHC)

The ASX200 tried so hard to hold it together yesterday and at 3.55pm it was down under 50-points, which in effect means local stocks would have been up for the week even following 2 consecutive 500-point falls by the Dow. Unfortunately, a huge sell order via the SPI futures hit the market with just 5 minutes of normal trading remaining taking the market to a close down almost 70-points / 1.2%.
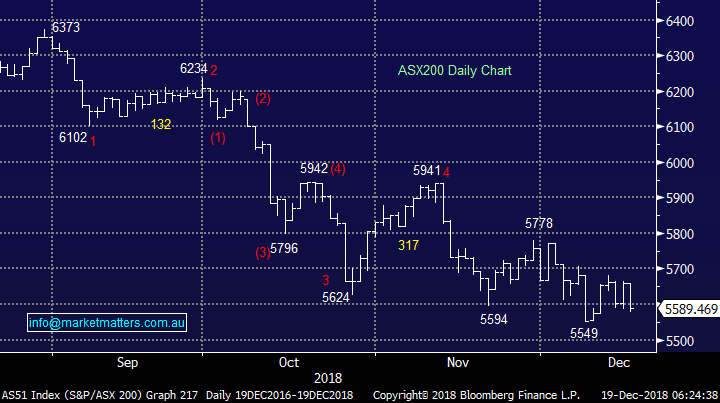
I know a few subscribers are becoming tired with our call for a Santa Rally and it certainly felt a pipedream when the market closed yesterday. However, it’s not all bad news and as we’ve mentioned before our market wants to rally / bounce if external circumstances are not too bad e.g. The Dow has now fallen over 2500-points / 9.7% from this month’s high but the local market has only retraced 182-points / 3.1% - it’s trying in the face of huge adversity.
While US stocks feel more vulnerable to us in the years ahead than most global indices, we are reticent to turn too negative today as traders / investors continue to “bail” ahead of the Fed’s interest rate decision on Wednesday – the short-term selling may become exhausted whatever the outcome.
MM mildly remains bullish the ASX200 short-term targeting a “Christmas rally” but we need to see a close above 5700 to reignite any major degree of confidence.
Overnight US markets were solid for much of the session before another late ‘ nervous’ sell off played out into the close. The Dow dropping ~400points from the session highs to actually trade in the red before a late ~200 point rally saw that index close in the black. The broader S&P 500 closed largely flat while the tech stocks outperformed adding 0.67%. Clearly the market is very skittish ahead of tonight’s meeting of the US Federal Reserve where the market is pricing a 64% chance that Jerome Powell will hike rates.
Today’s report is going to look at the Oil Sector following last night’s greater than 5% plunge which tested the $US47/barrel area – oil has arguably led the decline in equities in 2018.
ASX200 Index Chart
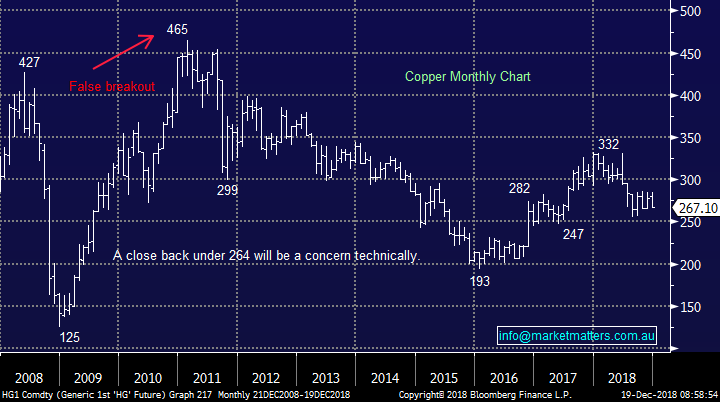
We should also point out that copper also tumbled over 3% last night which is a concern i.e. we have 2 huge leading economic indicators copper & oil both voting with their feet for a recession in 2019 / 2020.
Copper Chart
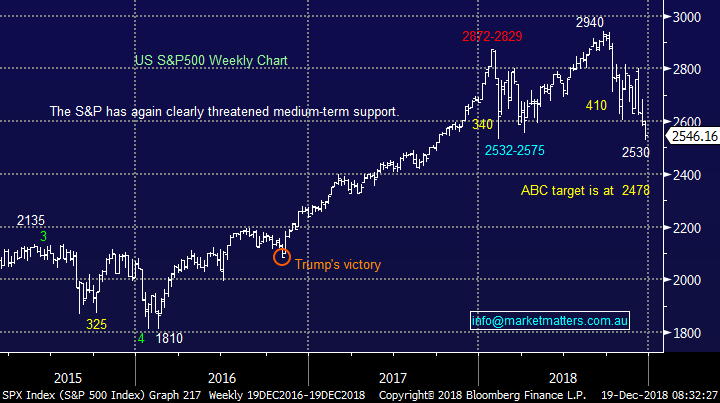
US stocks have had a very tough time since September with the headline index, the S&P500 falling 410-points / 14% while the growth end of town has fared worse - the NASDAQ falling almost 17%.
At MM we look at markets from a number of different angles and while the S&P500 is far from bullish a close back above 2610 would suggest a bounce to 2700, or even 2800 – ideally we are looking for such a move to increase our cash levels and tweak the composition of our portfolios.
A lot’s riding on the Fed tonight, I wonder if they are feeling as nervous / concerned as the millions of investors who have seen their nest eggs diminish considerably over the last few months. Personally I believe the Fed Chair Jerome Powell has one of the hardest tenures in living memory, one heck of a juggling act – plus of course we have Donald Trump just to add some spice!
US S&P500 Index Chart
The Oil price & the Energy Sector
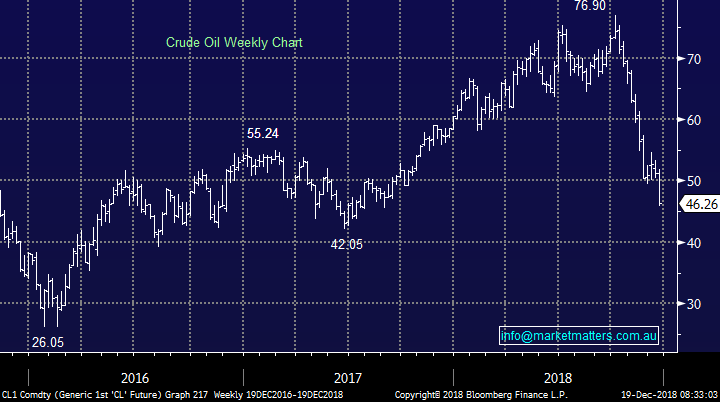
In the Weekend Report we discussed crude and our view that the next $US10/barrel from the $US50 area was more than likely up, this now looks to be wrong with the $US47 being breached overnight. A huge fall from grace.
However, this could easily become an improved buying opportunity in the Energy Sector if we see a close back above $US50/barrel which would generate a bullish technical signal - ultimately though, we’ll let the market be the guide. Fundamentally we can see a number of reasons crude can rebound including resilient global growth, normalising inventory levels, limited spare OPEC capacity plus Saudi needs the price nearer $US85 to balance their books BUT we should never fight the tape.
The question is obviously how to “play” the Oil / Energy Sector from here?
Crude Oil Chart
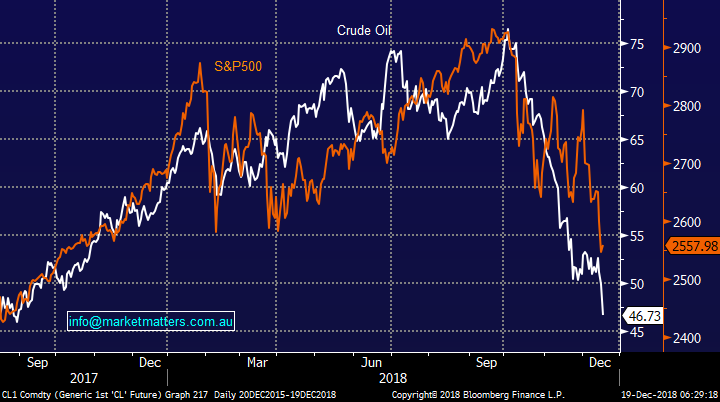
The correlation between US stocks and the crude oil price is very high which leads us to ask the question whether or not, one leads the other.
Unfortunately, we found no useful signals, they simply move in tandem.
Overall this should be no surprise as both the stock market and crude oil are representations of the perceived strength of the US / global economy.
S&P500 v Crude Oil Chart
Today we have looked at 4 major players in the local Energy Sector – MM likes a contrarian investment at times and this certainly fits that bill at the moment!
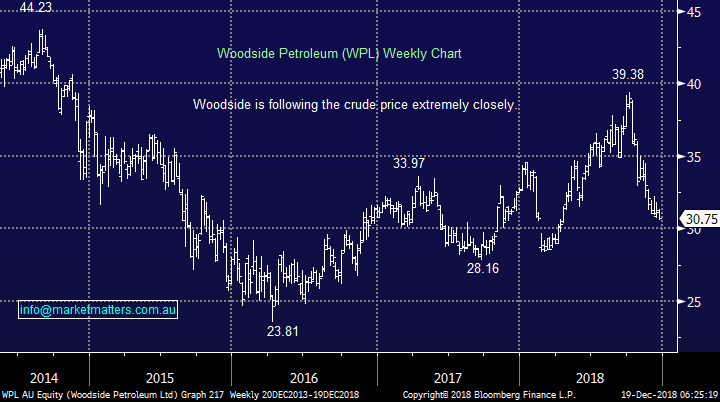
1 Woodside Petroleum (ASX: WPL) $30.75
Heavyweight WPL is positioned strongly for growth in years ahead as they ramp up from 87-91 million barrels of oil equivalent (Mboe) this year to ~100m Mboe in 2020 plus they have a lot of medium term optionality in their offshore business, however all this means little given its share price remains very correlated to the underlying oil price – unsurprisingly so.
Technically WPL looks ready for a few % bounce along with the Oil price but there’s nothing particularly exciting here for MM.
MM is neutral WPL.
Woodside Petroleum (ASX: WPL) Chart
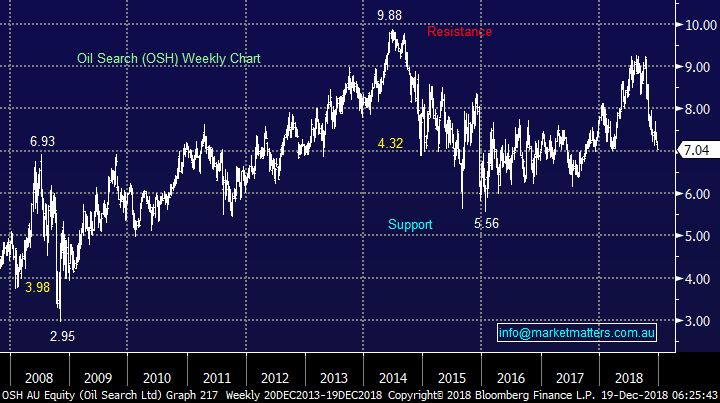
2 Oil Search (ASX: OSH) $7.04
OSH is well positioned to significantly increase its LNG production which coincides with forecasts of a shortage evolving in Asia.
A little side spice with OSH is that Woodside has been an aggressor in the past although the bid was knocked back in no uncertain terms. We question if the current weakness in the sector will create interest for the WPL board especially now the PNG government is no longer a shareholder in OSH. WPL may also like to be involved in the investment decision on whether or not to add a third train to capacity at their PNG LNG project, a decision that gains momentum in the middle part of next year.
Technically OSH has reached support but like WPL it’s not exciting.
MM is neutral OSH.
Oil Search (ASX: OSH) Chart
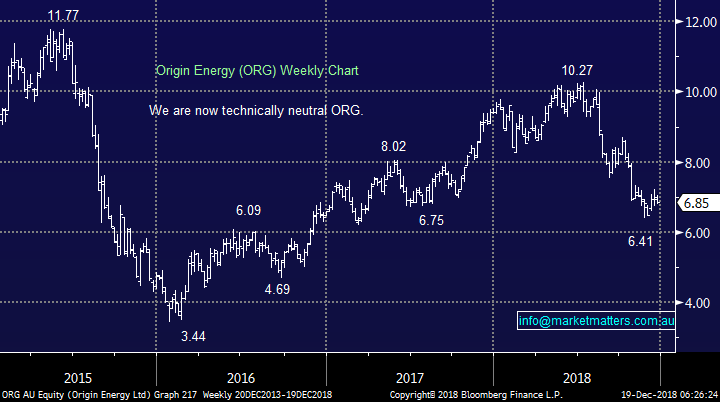
3 Origin (ASX: ORG) $6.85
ORG has suffered from the double whammy of a falling oil price and government interference in the utility sector.
The company is aiming to significantly reduce costs which should keep the company profitable even if oil falls another 10-15% but this clearly demonstrates the dependability of resources stocks on their respective underlying commodities.
Boring but we are also neutral ORG.
Origin (ASX: ORG) Chart
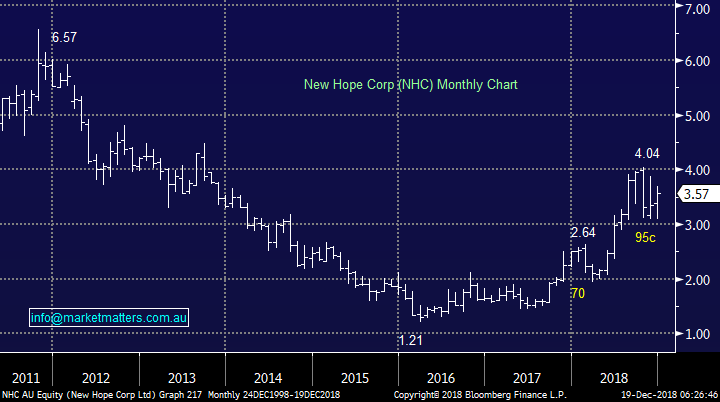
4 New Hope Corp (ASX: NHC) $3.57
While new hope is more exposed to Coal than Oil, it is still worth throwing in the mix especially as we covered it in the Weekend Report. In short, no change from Sunday, MM likes NHC targeting at least 15% upside, with an ideal entry below $3.50.
Unfortunately we are not the only market players liking NHC with both Macquarie and Credit Suisse releasing bullish notes recently on the stock, both with a $4.00 12 month price target implying upside of ~14% from the $3.50 level. The
MM is bullish NHC.
New Hope Corp (ASX: NHC) Chart
The key takeaway here, and it’s similar with all commodities, is that stocks will ultimately follow their underlying exposure. Short term factors like buy-backs or dividends can skew it slightly, but really we just need to get the direction right of the commodity itself. In terms of oil, its cyclical, in so far as when prices rise it incentives new production, but if they fall, production is reduced. We saw it recently with Santos outlining plans to double production just as the Oil price peaked! Energy companies generally get it wrong in my experience.
Conclusion
This morning, we found ourselves trying to like the Oil Sector but to no avail.
In the bigger picture our lack of interest for falling oil stocks is a concern to MM of the health of the underlying global economy.
The stock we particularly like in the broader Energy Sector is New Hope Corp (NHC), ideally below $3.50.
Overnight Market Matters Wrap
· The December SPI Futures is indicating the ASX 200 to open 10 points lower towards the 5580 level this morning.
· After touching a 14 month low yesterday, US equities staged a recovery of sorts overnight. The Dow and NASDAQ closed ahead circa 0.4%, while the S&P 500 made a late recovery into the black. The SPI is unchanged indicating a flat opening to our market.
· Trump again had the Fed in his sights just before their two day meeting to decide on interest rates, urging them to leave rates on hold and telling them to “feel the market”.
· Chinese officials meet for their annual economic conference from Wednesday to Friday. Slowing growth, trade and tariffs will be hot topics. While some information will be made available this week, details won’t be released until March.
· Metals on the LME were weaker with copper down 2.5%. Iron ore fell 2% and oil continues to plummet with Brent down 5% and WTI down 7%.
Have a great day!
James & the Market Matters Team
Disclosure
Market Matters may hold stocks mentioned in this report. Subscribers can view a full list of holdings on the website by clicking here. Positions are updated each Friday, or after the session when positions are traded.
Disclaimer
All figures contained from sources believed to be accurate. Market Matters does not make any representation of warranty as to the accuracy of the figures and disclaims any liability resulting from any inaccuracy. Prices as at 19/12/2018
Reports and other documents published on this website and email (‘Reports’) are authored by Market Matters and the reports represent the views of Market Matters. The MarketMatters Report is based on technical analysis of companies, commodities and the market in general. Technical analysis focuses on interpreting charts and other data to determine what the market sentiment about a particular financial product is, or will be. Unlike fundamental analysis, it does not involve a detailed review of the company’s financial position.
The Reports contain general, as opposed to personal, advice. That means they are prepared for multiple distributions without consideration of your investment objectives, financial situation and needs (‘Personal Circumstances’). Accordingly, any advice given is not a recommendation that a particular course of action is suitable for you and the advice is therefore not to be acted on as investment advice. You must assess whether or not any advice is appropriate for your Personal Circumstances before making any investment decisions. You can either make this assessment yourself, or if you require a personal recommendation, you can seek the assistance of a financial advisor. Market Matters or its author(s) accepts no responsibility for any losses or damages resulting from decisions made from or because of information within this publication. Investing and trading in financial products are always risky, so you should do your own research before buying or selling a financial product.
The Reports are published by Market Matters in good faith based on the facts known to it at the time of their preparation and do not purport to contain all relevant information with respect to the financial products to which they relate. Although the Reports are based on information obtained from sources believed to be reliable, Market Matters does not make any representation or warranty that they are accurate, complete or up to date and Market Matters accepts no obligation to correct or update the information or opinions in the Reports. Market Matters may publish content sourced from external content providers.
If you rely on a Report, you do so at your own risk. Past performance is not an indication of future performance. Any projections are estimates only and may not be realised in the future. Except to the extent that liability under any law cannot be excluded, Market Matters disclaims liability for all loss or damage arising as a result of any opinion, advice, recommendation, representation or information expressly or impliedly published in or in relation to this report notwithstanding any error or omission including negligence.


