Reviewing the local Media & Entertainment sector (DBK GY, REA, OML, NEC, CAR, SXL)
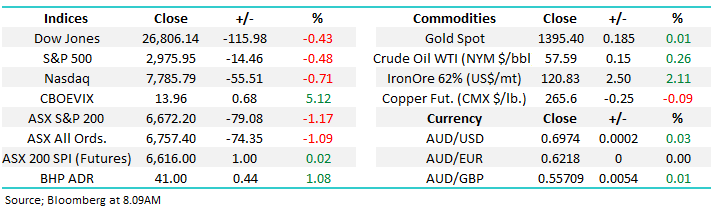
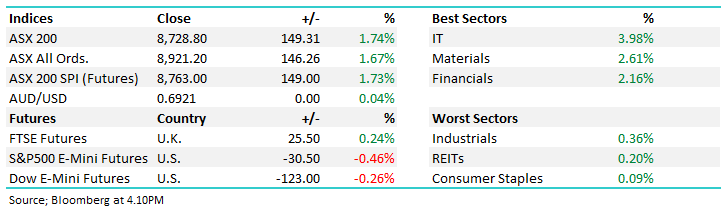
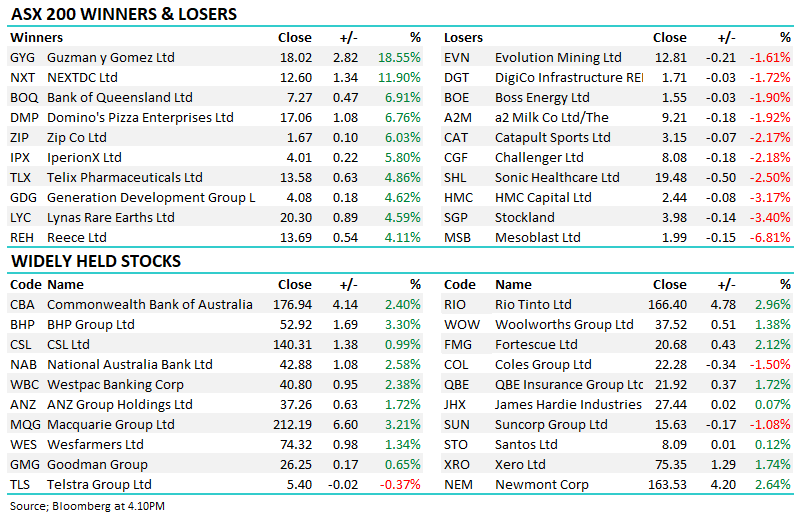
The ASX200 was smacked -1.2% yesterday and in the blink of an eye we are only 0.8% away from being in negative territory for both July and the new financial year. I would describe the selling over the day as constant, as opposed to being particularly aggressive, but with 80% of the ASX200 closing in the red its hard to draw any positives from a day when all sectors closed down. Interestingly weakness was led by the usually defensive Healthcare and Utilities sectors although most gold stocks did enjoy a relative bid tone as the day unfolded.
A clear indicator of the steadiness of the days decline was only 2 stocks or 1% of the ASX200 moved by over 5% with SpeedCast International (SDA) bouncing +6.4% after plunging ~50% last week, while G8 Education (GEM) was hammered almost 10% after the Gold Coast child care centre business was downgraded by a major broker. GEM made fresh 6-month lows on the news but it had been drifting since a spike high in February, this is not one beaten up stock for MM but it does illustrate why a high cash position going into Augusts reporting season can be very useful. Noticeably the ASX200 may have reached fresh 11 ½ year highs on Friday but 30 stocks within the ASX200 have fallen by over 10% in the last 3-months as a number of downgrades wash over our market, it feels like we may be approaching one too many.
In the Weekend Report we wrote – “Importantly no sell signals have been generated but our “Gut Feel” is the next 200-points is more likely down than up.” Not surprisingly after Mondays sharp pullback we are even more confident of this call and technically sell signals are slowly unfolding in some stocks, sectors and the index itself. However we should always be mindful of the usual characteristics of a market top i.e. a begrudging “roll over” type of affair as opposed to a sharp reversal which is how bottoms usually manifest themselves.
MM remains comfortable to adopt a more conservative stance over the next 6-months.
Overnight US stocks fell with the S&P500 closing down -0.5% but a bounce by iron ore has BHP trading up ~1% in the US helping the SPI futures point to an unchanged open this morning by the ASX200.
Today we are going to run the ruler over the often neglected Australian Media & Entertainment sector.
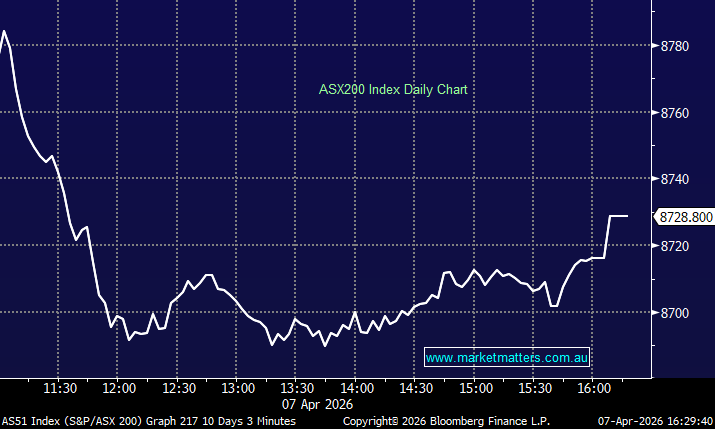
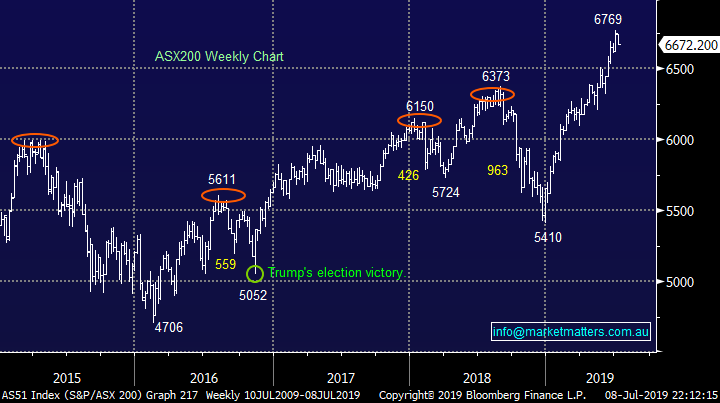
ASX200 Chart
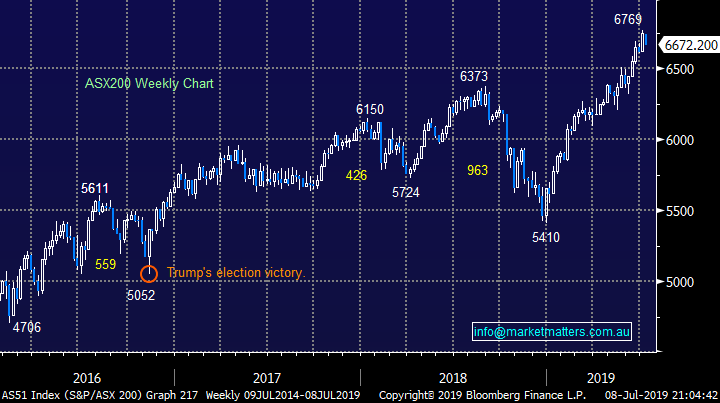
Historically market tops take a while to evolve as traders keep selling dips only to be stopped out by another rally with the bullish trend, generally markets roll over when these sellers throw in the towel and a decline finally unfolds without them.
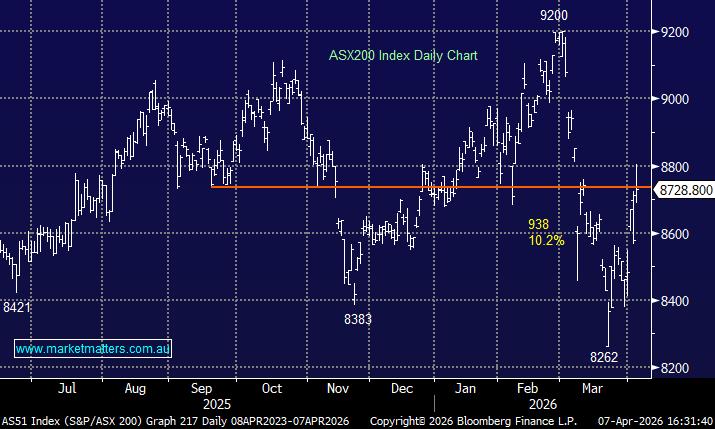
The chart below illustrates the last 4 decent swing highs by the local market, in every case the top has taken 3-4 weeks to form before the decline started in earnest – in 2 of the occasions it was nearer 10-weeks.
Hence at MM while we are now neutral / bearish stocks at current levels but a retest of the 6800 area should not surprise.
ASX200 Index Chart
Yesterday we finally took an initial short position on US stocks via the ProShares Short S&P 500 ETF for our Global ETF Portfolio - https://www.marketmatters.com.au/market-matters-portfolios/
The reason was 2 fold:
1 - US investor sentiment has finally turned bullish, a phenomenon that MM required before we could really start to consider selling the US market.
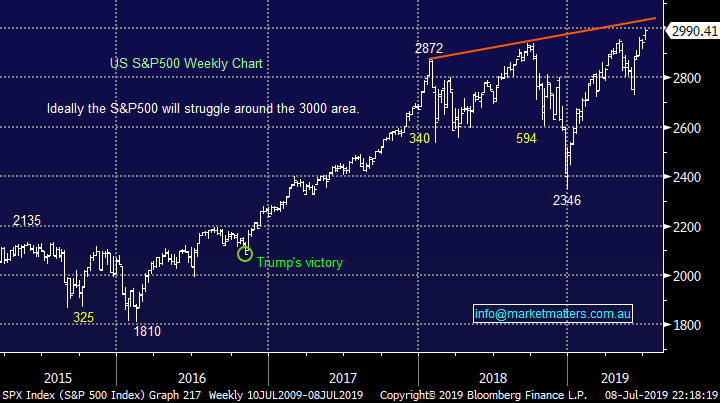
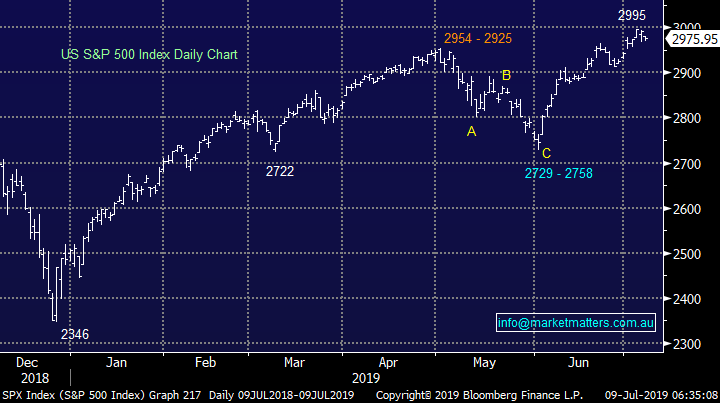
2 – As subscribers know the US S&P500 is finally trading around our medium term target area of 3000.
Our favourite indicator of the US investors mentality comes from the AAII Investors Sentiment Survey which as we said above has finally turned bullish = sell signal our end.
https://www.aaii.com/sentimentsurvey
US S&P500 Index Chart
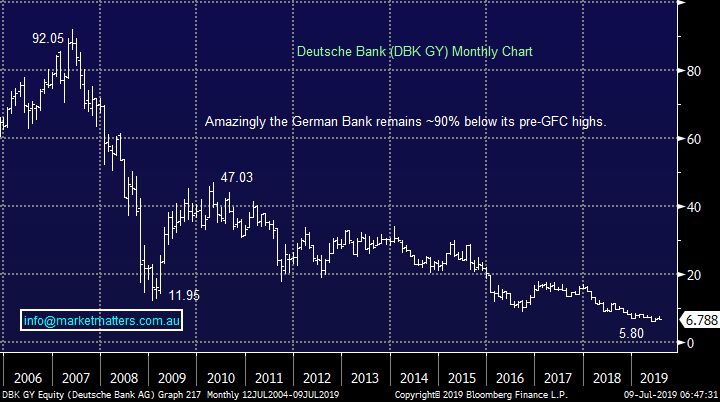
The chart below illustrates one of our favourite comments i.e. always “remain open-minded”. Major German Bank Deutsche (DBK) which has dominated the financial press over the last 48-hours has now fallen over 90% since the GFC, imagine that performance from our own Commonwealth Bank (CBA)!
For the record we have DBK in the too hard basket.
Deutsche Bank (DBK GY) Chart
The Australian Media & Entertainment sector
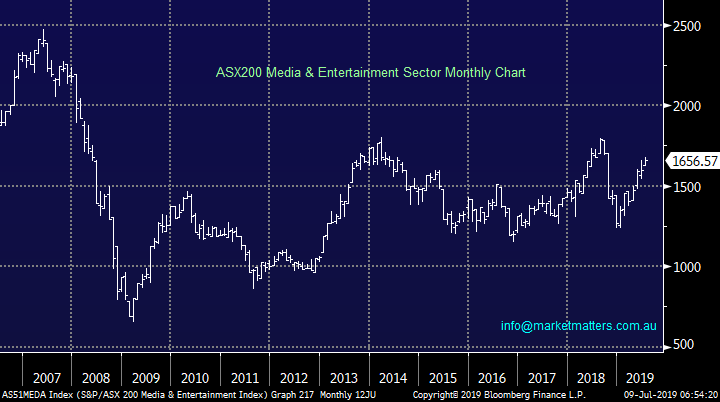
As a sector this group of 7 stocks within the ASX200 has been a clear underperformer as it languishes well below both its 2014 and 2018 swing highs. However there’s often value in a relatively unpopular sector and this is exactly what we are looking for today as we continue to tweak our portfolios to a more conservative / defensive stance.
Australian Media & Entertainment sector Chart
We have taken a quick look at 5 stocks in this often ignored group.
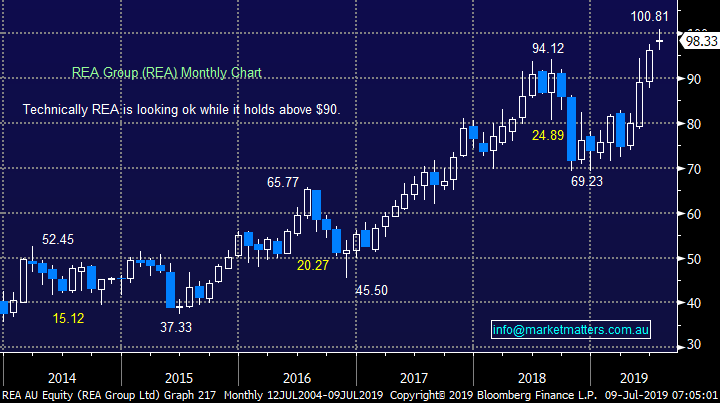
1 REA Group (REA) $98.33
REA group is better known as realestate.com.au and has enjoyed an excellent 5-years with the stock basically doubling. The companies 1H result delivered in February was solid showing revenue growth of 14% to $469m and net profit after tax of $177m but what was particularly impressive was the fact that these numbers were achieved with a 3% fall off in listings nationwide.
While REA is a top quality business, our question is around valuation with the company’s shares trading on a Est P/E for 2019 of 43.6x. This high valuation has helped the stock correct over 25% on 3 separate occasions in the last 5-years boding the question, should we be chasing REA into new highs. At this stage of the bull markets maturity we feel chasing REA is a dangerous game.
MM is a buyer of REA at lower levels.
REA Group (REA) Chart
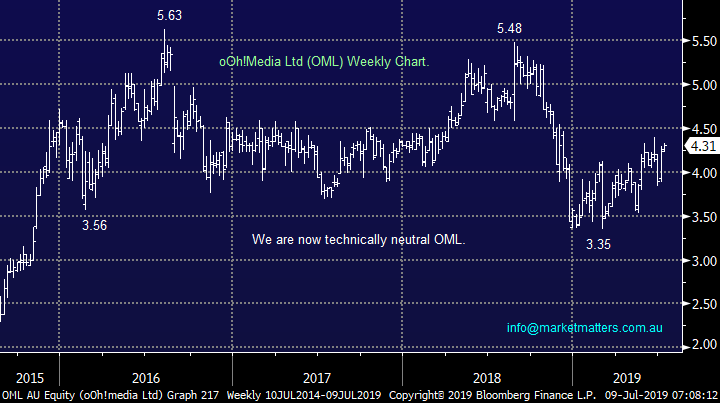
2 oOh!Media Ltd (OML) $4.31.
Sydney based OML company is well-positioned to benefit from the ongoing conversion of static billboards to digital billboards plus they should start to benefit from synergies arising from the integration of the Adshel business making its Est P/E for 2019 of 14.9x look undemanding while its yield of 3.8% fully franked is not to be sniffed at.
In March the stock was sold down aggressively following weak guidance for 2019 but its recovery has been impressive. MM has been bearish OML technically for most of the last 12-months but now after the stock has held the $3.50 area we have turned our view to a more neutral stance. Investors keen on the company’s outlook could go long technically with stops under $4 but its not exciting to us.
MM is neutral OML.
oOh!Media Ltd (OML) Chart
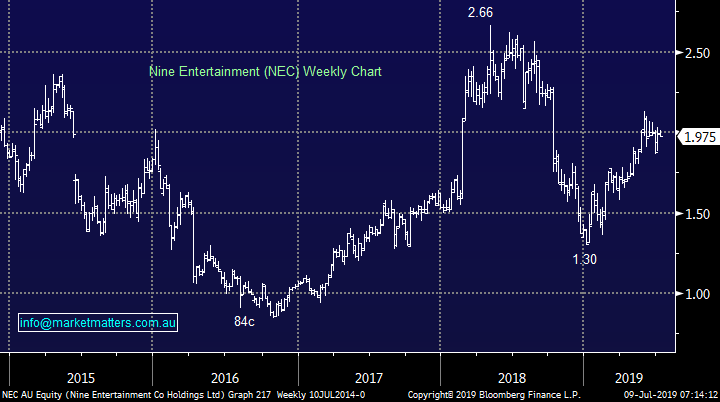
3 Nine Entertainment (NEC) $1.97.
NEC is one of the top performers over the last year helped by asset sales and better-than-expected earnings / operational performance updates. The stocks still trading on an attractive Est. P/E of 14.3x and 6.1% yield implying to us fund managers are not believers moving forward.
Traditional media businesses like free-to-air-television networks are struggling with a diminishing audience, however NEC has addressed this issue transforming itself into a more diversified offering with Stan, 9Now & Domain. Their recent results showed solid profitability and improvement considering the backdrop of increased competition and falling margins, a definite thumbs up to-date for their merger with Fairfax. Stan for instance is already profitable being on track to add ~$30m to EBITDA in 2020, a solid asset for NEC.
However, the fact that NEC is still trading at the same price as its first month on the boards back in 2013 demonstrates the tough environment for the company. MM believes NEC is worth considering as a yield proposition.
Nine Entertainment Chart
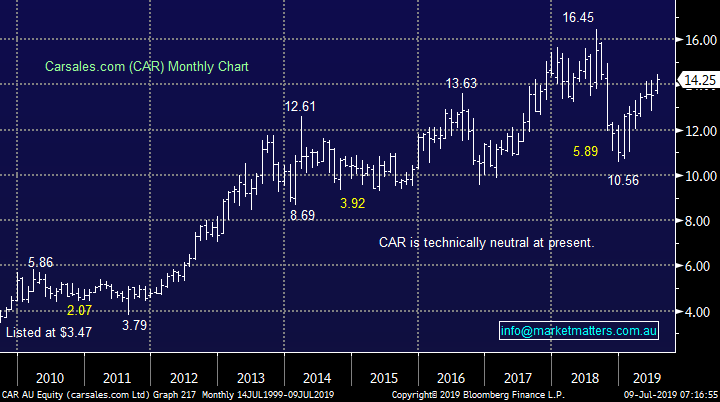
4 Carsales.com (CAR) $14.25.
CAR similar to REA is a success story of the last 10-years but its been a tough 12-months as the company fights a tougher Australian backdrop for new and used car sales. For the 6-months ending 2018 it posted an adjusted net profit of $60m on revenue of $235 million, with profits slightly down on higher revenue.
We’re not excited by CAR at current levels as its valuation still feels rich trading on an Est P/E of 26.4x although its 3.6% fully franked yield is not too bad in todays low interest rate environment.
MM is neutral CAR.
Carsales.com (CAR) Chart
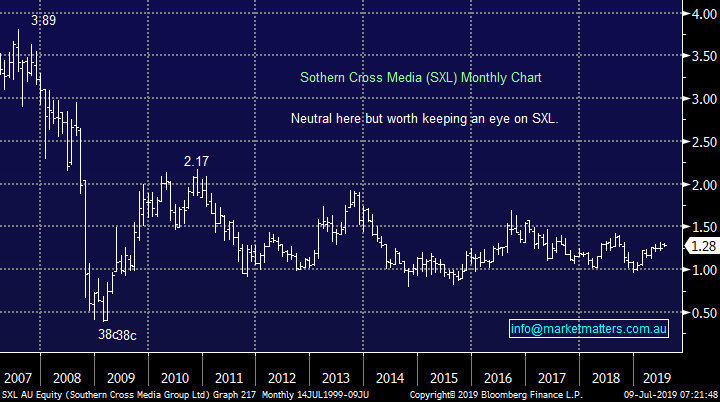
5 Southern Cross Media (SXL)$1.28.
Lastly, media business Southern Cross Media which is a stock not regularly on the investors radar. SXL has become profitable within the last five years but it made a loss over the last 12-months implying profitability is no a given at this stage. Interestingly, the dividend has slowly increased over time making the company feel mature and dividend investors are buying for the yield this almost quasi-junk bond (a high risk bond).
We believe it’s a positive that insiders have made decent net purchases over the last year implying people in the know see value at today’s prices.
However the shares are relatively cheap trading on an Est P/E of 12.7x while the forecasted 7% fully franked yield is extremely attractive.
MM believes SXL is worth considering as an alternative “yield play”.
Southern Cross Media (SXL) Chart
Conclusion (s)
Of the 5 stocks looked at today we feel SXL and NEC can be considered as reasonably aggressive yield plays. Of the other 3 we like REA but at lower prices.
Global Indices
At this stage the S&P500 is only have a rest in the scheme of things compared to its 28% rally from December lows, a break of 2960 should concern the bulls and especially 2925, still ~2% lower.
We reiterate that while US stocks have reached our target area but they have not yet generated any technical sell signals.
US S&P500 Index Chart
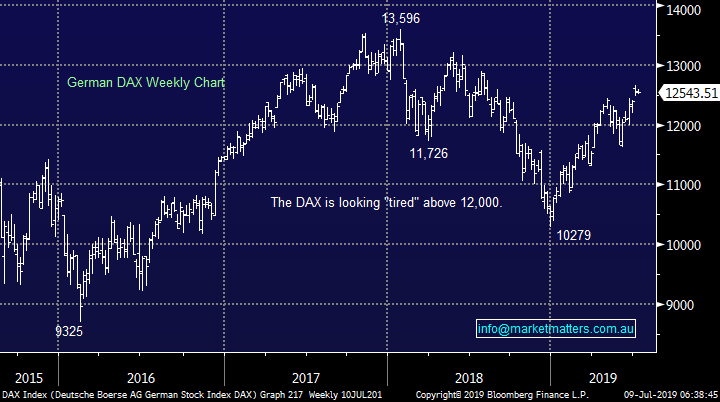
No change again with European indices, we remain cautious European stocks but the tone has improved recently.
German DAX Chart
Overnight Market Matters Wrap
· US equity markets followed some of Australia’s lead overnight, as investors sit on the sideline ahead of US Fed Reserve Jerome Powell’s testimony to Congress later this week, which comes in the wake of Friday’s strong jobs report which has softened expectations of the pace of future rate cuts.
· The tech heavy Nasdaq 100 underperformed against the major indices following a broker downgrade on Apple and another warning of tech valuations being stretched in the face of a declining earnings outlook.
· BHP is expected to outperform the broader market after ending its US session up an equivalent of 1.08% after Iron Ore’s rally overnight.
· The September SPI Futures is indicating the ASX 200 to open 11 points higher, towards the 6684 level this morning.
Have a great day!
James & the Market Matters Team
Disclosure
Market Matters may hold stocks mentioned in this report. Subscribers can view a full list of holdings on the website by clicking here. Positions are updated each Friday, or after the session when positions are traded.
Disclaimer
All figures contained from sources believed to be accurate. Market Matters does not make any representation of warranty as to the accuracy of the figures and disclaims any liability resulting from any inaccuracy. Prices as at 09/07/2019
Reports and other documents published on this website and email (‘Reports’) are authored by Market Matters and the reports represent the views of Market Matters. The MarketMatters Report is based on technical analysis of companies, commodities and the market in general. Technical analysis focuses on interpreting charts and other data to determine what the market sentiment about a particular financial product is, or will be. Unlike fundamental analysis, it does not involve a detailed review of the company’s financial position.
The Reports contain general, as opposed to personal, advice. That means they are prepared for multiple distributions without consideration of your investment objectives, financial situation and needs (‘Personal Circumstances’). Accordingly, any advice given is not a recommendation that a particular course of action is suitable for you and the advice is therefore not to be acted on as investment advice. You must assess whether or not any advice is appropriate for your Personal Circumstances before making any investment decisions. You can either make this assessment yourself, or if you require a personal recommendation, you can seek the assistance of a financial advisor. Market Matters or its author(s) accepts no responsibility for any losses or damages resulting from decisions made from or because of information within this publication. Investing and trading in financial products are always risky, so you should do your own research before buying or selling a financial product.
The Reports are published by Market Matters in good faith based on the facts known to it at the time of their preparation and do not purport to contain all relevant information with respect to the financial products to which they relate. Although the Reports are based on information obtained from sources believed to be reliable, Market Matters does not make any representation or warranty that they are accurate, complete or up to date and Market Matters accepts no obligation to correct or update the information or opinions in the Reports. Market Matters may publish content sourced from external content providers.
If you rely on a Report, you do so at your own risk. Past performance is not an indication of future performance. Any projections are estimates only and may not be realised in the future. Except to the extent that liability under any law cannot be excluded, Market Matters disclaims liability for all loss or damage arising as a result of any opinion, advice, recommendation, representation or information expressly or impliedly published in or in relation to this report not withstanding any error or omission including negligence.