Reviewing the 5 strongest global stocks over the last month
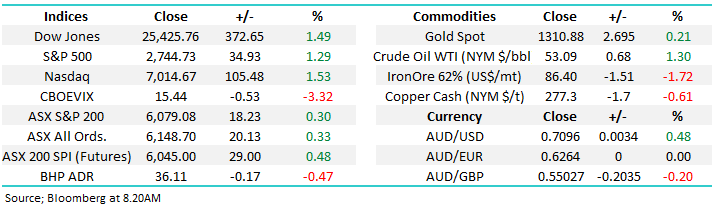
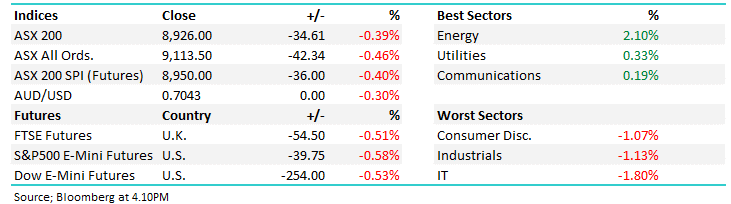
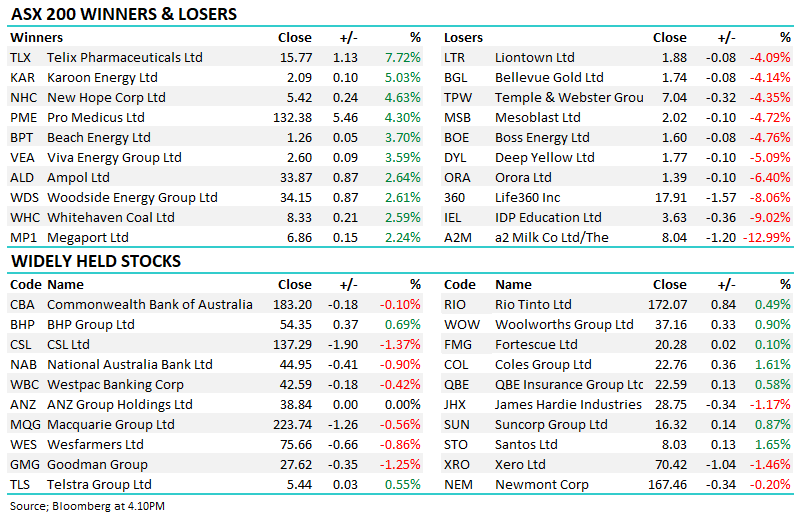
Yesterday the ASX200 recovered Mondays losses just as the overnight SPI had forecast with no standout sectors contributing to the 18-point gain, although the banks did again drag on the index with both regionals down almost 3% - CBA trades ex-dividend today and it will be interesting to see if the recent appetite for Australia’s largest stock diminishes once its attractive fully franked dividend is behind us.
During the day the market did receive a positive catalyst to rise strongly and failed which supports our view that the index is a little tired at current levels - the US S&P500 futures rallied over +0.5% encouraged by news of a pending deal to avoid another government shutdown plus the Trump administration announcing the president still wants to meet China’s Xi Jinping to resolve the trade war.
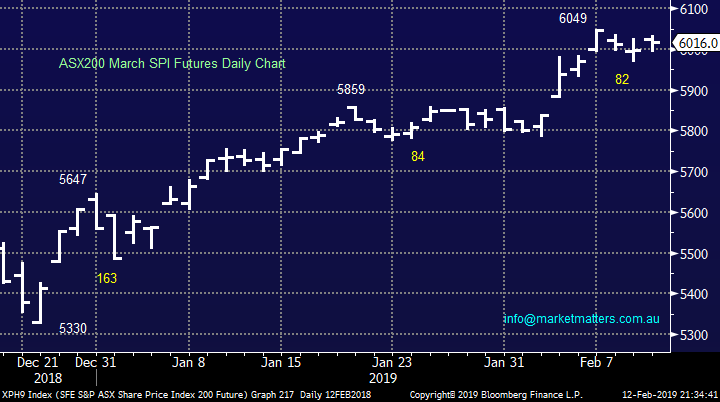
With the ASX200 poised to open close to our target for the first half of 2019 we must put our hand up and acknowledge we underestimated the speed and momentum behind the ascent – investors were clearly more bearishly positioned than we thought. The markets travelled an average of 325-points over the last 3-months, explosive stuff compared to the norm since the GFC. With February still ~1% below this recent average another 1% upside over the next fortnight will be in sync with the markets current rhythm.
MM remains in “buy mode “due to both our medium-term market view and relatively large cash position.
Overnight US markets were strong greeting the news mentioned above with most indices gaining ~1.5% - BHP closed down 117c while the SPI is pointing to a 0.5% gain locally but remember CBA trading ex-dividend will take some points from the index this morning.
Today we are going to evaluate the 5 strongest stocks in the global 100 over the last month. This should give us some insight into the next few months for global equities and of course whether investors should consider jumping on board these high performers.
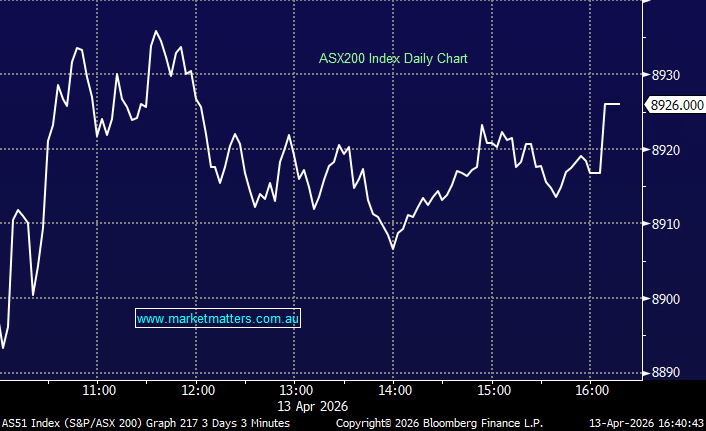
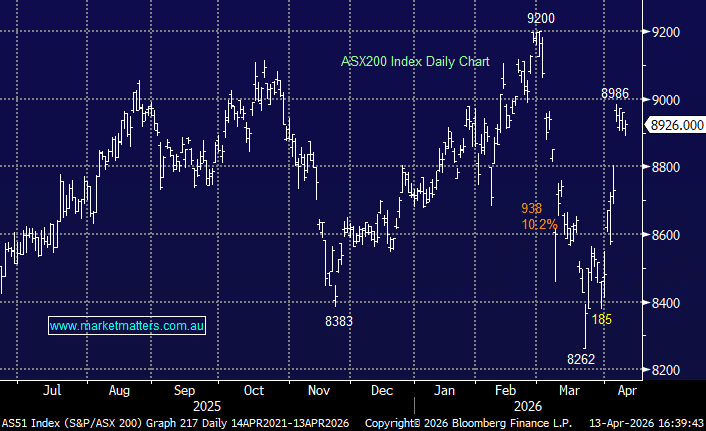
ASX200 March SPI Futures Chart
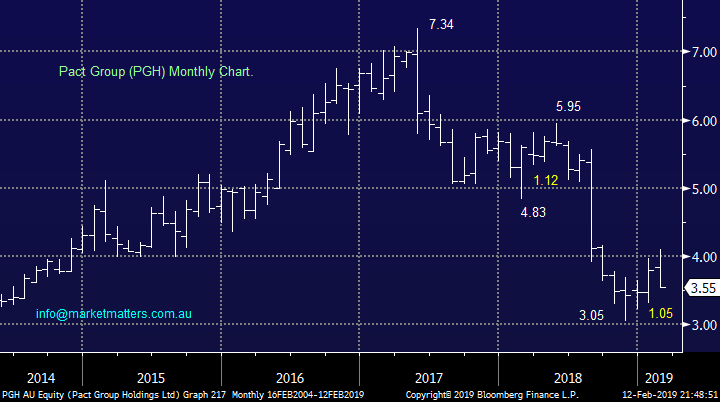
Yesterday, shares in packaging business Pact Group (PGH) were hammered almost 10% as they announced a downward review of asset valuations plus preliminary results for the half year were down 9% on the same period in the previous year – a similar decline to the shares, while they also warned forward guidance still carried a degree of uncertainty.
PGH is now trading on an EST P/E for 2019 of 14.1x while their shares are yielding 6.5% fully franked – not irresistible enough to us just yet.
MM will be considering PGH if / when the shares trade around / below $3.
Pact Group (ASX: PGH) Chart
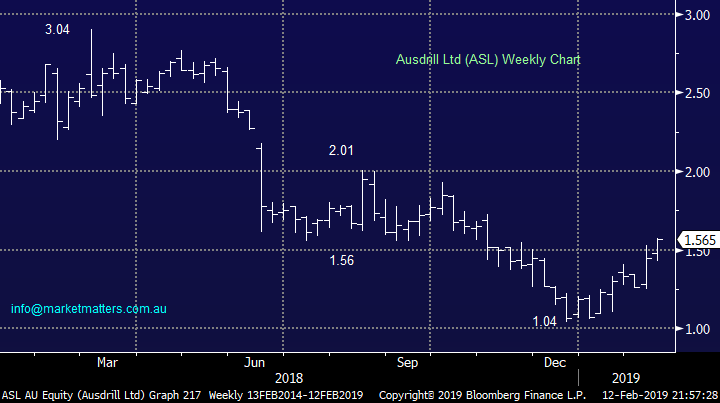
Conversely Ausdrill (ASL) had a great day rallying over 7% on company specific news. However Norges Bank (Norway) announced they had become a substantial shareholder in the morning now owning over 35m shares, or 5.2% of the company.
We do like the mining services business and are actively considering paying up for the stock we have been discussing over recent weeks.
MM remains bullish ASL targeting at least the $2 area.
Ausdrill (ASX: ASL) Chart
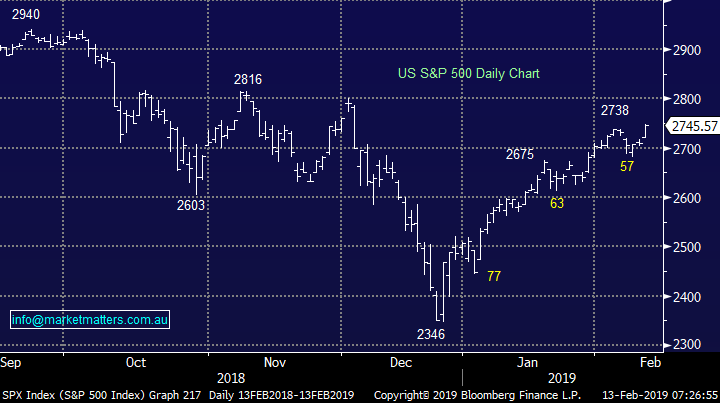
US equities have proved to be far more bullish than we expected over recent weeks as they approach the ~2800 area – a lot quicker than expected.
We now have to be flexible and switch to a neutral stance but we still remain keen to buy the next decent correction.
US S&P500 Chart
The 5 best performing global stocks.
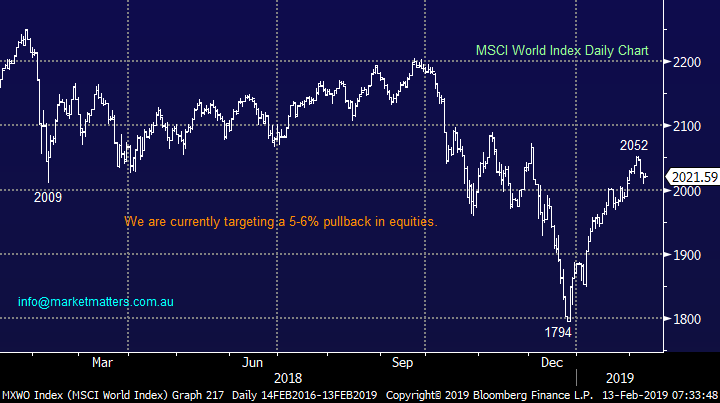
The MSCI World Index illustrates that not all of the worlds markets are roaring to fresh 2019 highs but they are not far off – Europe has been a definite laggard in this picture which makes sense considering their global and political problems.
The 5 top performing stocks we’ve covered today include 2 familiar names but also 3 that we haven’t covered in 2019. The 3 are a diverse bunch from India, Europe and Japan as we continue to expand the MM offering to our subscribers.
Investors should always remember that buying the best performing stocks is statistically a more profitable path but human psychology often gets in the way.
MSCI World Index Chart
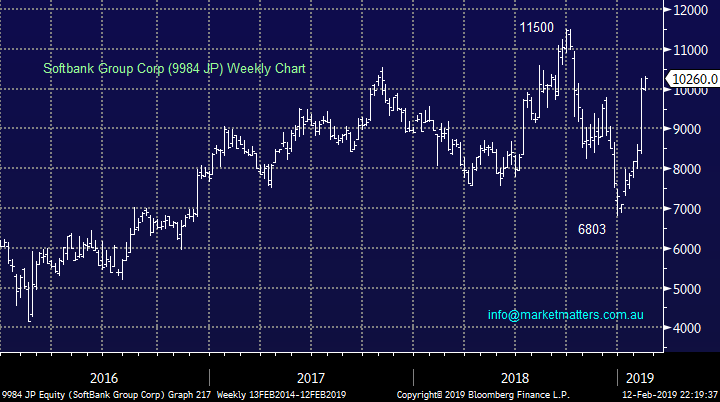
1 Softbank Group Corp (9984 JP) 10260JPY
Yesterday Japanese Softbank closed up just over 33% for the month making it the best performing major global stock. MM has been looking for Telcos to outperform in 2019 and this one certainly has – the Australian leaders are also kicking some goals with Telstra (TLS), Vocus (VOC) and TPG Telecom (TPM) all up over 10% over the same period.
The company’s $US23bn IPO for its telecom unit last December was oversubscribed in a worrying time for global markets, a great sign for the conglomerate who still own ~2/3 of the business. However the main reason for the huge outperformance has been the recent announcement of an enormous buyback totalling almost $US5.5bn. Importantly the business was able to undertake the buyback because its net income had increased by over 50% for the first ¾ of the fiscal year.
MM is bullish Softbank targeting ~15% upside.
Softbank Group Corp (9984 JP) Chart
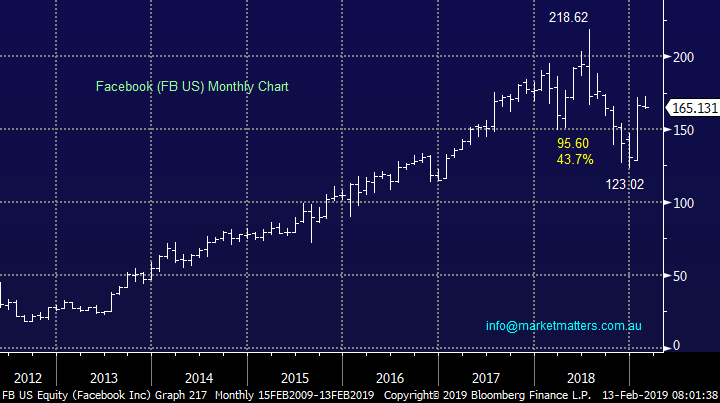
2 Facebook (FB US) $US165.13
We’ve looked at FB recently due to its strength and its currently up ~15% over the last month but interestingly it was down last night in the US while the Dow surged close to 400-points.
The stock has surged since announcing its 4th quarter revenue that exceeded the most bullish analysts expectations i.e. web advertising continues to grow for the majors. FB certainly endured some bad press in 2018 led by issues around privacy and data sharing. However while the company’s revenue continues to perform these issues may resurface in investors’ minds in 2019 / 2020.
MM has now switched to neutral Facebook after its recent strong recovery.
Facebook (FB US) Chart
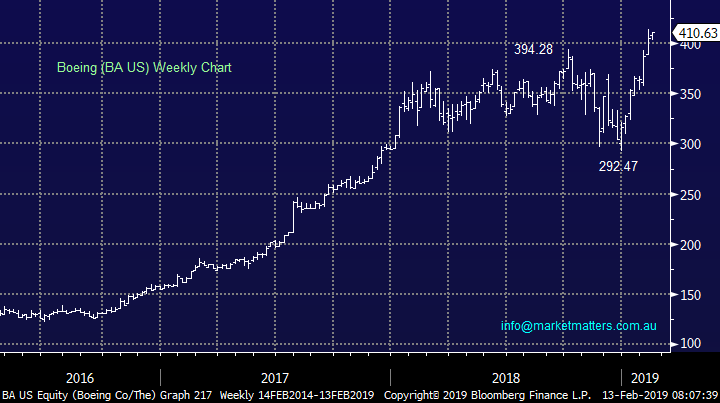
3 Boeing Co (BA US) $US410.63
Another stock we have looked at recently is jet manufacturer Boeing which is up over 15% during the last month, surging to all-time highs. Last time we wrote on BA the stock was at $US364 and we were bullish targeting the $US400 area which has now been achieved.
As we pointed out before, the business has increased earnings &/or revenue expectations at the last 3 quarterly updates gaining the markets backing in a major way. Also, the IATA predicts an increase of 6% for global air passengers in 2019 which is obviously good news for the maker of the planes carrying these people. Charlie Aitken wrote a good note on the stock recently – https://aimfunds.com.au/taking-aim-boeing/
We remain bullish Boeing but would now run stops on a close below $US390.
Boeing (BA US) Chart
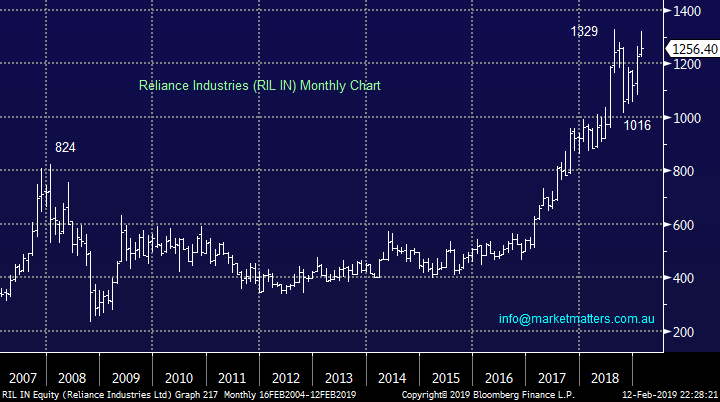
4 Reliance Industries (RIL IN) INR1256.40
Indian conglomerate RIL is up 14.45% over the last month, for those new to the company they own a number of businesses across India including energy, petrochemicals, retail and telecommunications.
The stock had a tough time last October following the posting of its highest ever net profit in Q2, up over 17% on the previous year, but a few issues within the result combined to disappoint the market e.g. high capital expenditure and gross refining margins fell to a 2-year low.
From a risk / reward basis MM is neutral RIL at current levels but an eventual pop over 1350 feels likely.
Reliance Industries (RIL IN) Chart
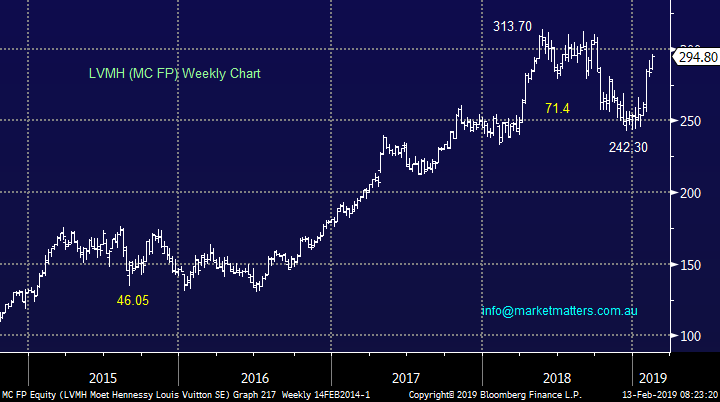
5 LVMH Moet Hennessy Louis Vuitton (MC FP) 294.80Euro
Luxury goods group LVMH is up 16% to-date this month showing that amazing marketing will still get consumers to buy from retailers, even in tough times.
The shares surged in January following a strong annual result which reassured investors that US – China trade worries was not too damaging. Also, the company were cautiously confident for the year after seeing sales pick up in China in Q4 – for the fashion conscious it was handbags that boosted sales, I’ll keep the bride away personally!
MM is bullish LVMH targeting new all-time highs initially 10% higher.
LVMH Moet Hennessy Louis Vuitton (MC FP) Chart
Conclusion
Of the 5 overseas high performers we looked at today our view can be summarised below:
Buy today – Softbank Group Corp (9984 JP) and LVMH (MC FP).
Bullish with trailing stop - Boeing (BA US).
Neutral – Facebook (FB US) and Reliance Industries (RIL IN).
Overnight Market Matters Wrap
· The US equity markets roared higher overnight with the US—China trade deal still on investor’s eyes and after reports that another US federal government shutdown will be prevented.
· The US employment market is showing signs of strength with job openings bouncing to a record high in December. The number of unfilled jobs rose to 7.34m.
· All metals on the LME were weak, including aluminium down over 1%. Iron ore gave up some of the recent gains, while crude oil rallied 1.3% following the Saudi’s comments that they would increase production cuts. The US 10 Year Bond yield is at 2.68%.
· BHP is expected to underperform the broader market after ending its US session down and equivalent of -0.47% while CBA is trading ex-dividend at $2.00 a share.
· The March SPI Futures is indicating the ASX 200 to open 14 points higher, testing the 6095 level this morning.
Have a great day!
James & the Market Matters Team
Disclosure
Market Matters may hold stocks mentioned in this report. Subscribers can view a full list of holdings on the website by clicking here. Positions are updated each Friday, or after the session when positions are traded.
Disclaimer
All figures contained from sources believed to be accurate. Market Matters does not make any representation of warranty as to the accuracy of the figures and disclaims any liability resulting from any inaccuracy. Prices as at 13/02/2019
Reports and other documents published on this website and email (‘Reports’) are authored by Market Matters and the reports represent the views of Market Matters. The MarketMatters Report is based on technical analysis of companies, commodities and the market in general. Technical analysis focuses on interpreting charts and other data to determine what the market sentiment about a particular financial product is, or will be. Unlike fundamental analysis, it does not involve a detailed review of the company’s financial position.
The Reports contain general, as opposed to personal, advice. That means they are prepared for multiple distributions without consideration of your investment objectives, financial situation and needs (‘Personal Circumstances’). Accordingly, any advice given is not a recommendation that a particular course of action is suitable for you and the advice is therefore not to be acted on as investment advice. You must assess whether or not any advice is appropriate for your Personal Circumstances before making any investment decisions. You can either make this assessment yourself, or if you require a personal recommendation, you can seek the assistance of a financial advisor. Market Matters or its author(s) accepts no responsibility for any losses or damages resulting from decisions made from or because of information within this publication. Investing and trading in financial products are always risky, so you should do your own research before buying or selling a financial product.
The Reports are published by Market Matters in good faith based on the facts known to it at the time of their preparation and do not purport to contain all relevant information with respect to the financial products to which they relate. Although the Reports are based on information obtained from sources believed to be reliable, Market Matters does not make any representation or warranty that they are accurate, complete or up to date and Market Matters accepts no obligation to correct or update the information or opinions in the Reports. Market Matters may publish content sourced from external content providers.
If you rely on a Report, you do so at your own risk. Past performance is not an indication of future performance. Any projections are estimates only and may not be realised in the future. Except to the extent that liability under any law cannot be excluded, Market Matters disclaims liability for all loss or damage arising as a result of any opinion, advice, recommendation, representation or information expressly or impliedly published in or in relation to this report notwithstanding any error or omission including negligence.