Reviewing 5 market themes catching our eye – (BEN, BOQ, FLT, FMG, MMM, NHF, RMD)
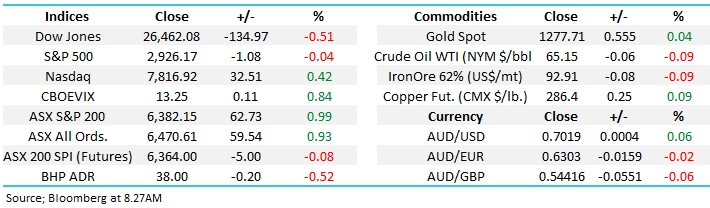
The ASX200 again soared higher on Wednesday gaining another 1% to reach its highest level since January 2008, basically the start of the GFC. Continuing the recent trend the banks led from the front but support was basically evident from almost everywhere except the Energy and Resources sectors. We again saw some life coming into a few previously beaten up stocks as fund managers appeared to search for value in a market becoming “richer” by the day e.g. Healius (HLS) +3.5%, Eclipx (ECX) +7.7% and Emeco (EHL) +3.6%.
As we said in our last morning report fundamentally things look good for equities compared to fixed income especially as those invested are already way ahead in 2019 as we approach the Federal election. At MM although we do hold a large cash position our stock selection is holding up well. MM is in cautious buy mode looking at stock specific scenarios as opposed to chasing the market as a whole.
Global equities are 4-months into a huge bullish advance and we hear daily comments along the lines of “is it time to sell / go short – buy puts?” but while a short-term market correction would not surprise the technical indicators are showing liquidity remains plentiful which implies strongly that the rally has further to run.
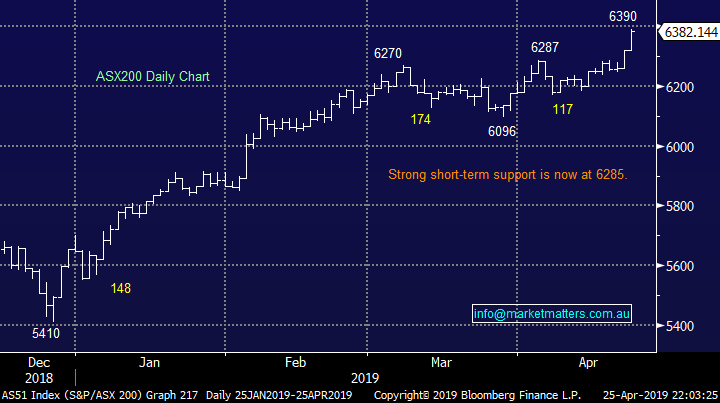
From a simply technical perspective we are now bullish unless the ASX200 closes below 6280 with one eye on the usual seasonal weakness that plays out in May - we would almost be surprised not to see another +100-point pullback at some stage in May but until further notice we would be viewing it as buying opportunity.
The ASX200 has punched through our previous upside target area making us now bullish while 6280 holds.
Overnight the US indices were mixed with the Dow falling 135-points courtesy of an almost 13% plunge by 3M after disappointing Chinese sales, conversely the tech based NASDAQ closed up another +0.4%. The SPI futures are calling local stocks to open close to unchanged.
This morning we have looked at 5 different market scenarios catching our attention that may provide opportunities into May.
ASX200 Chart
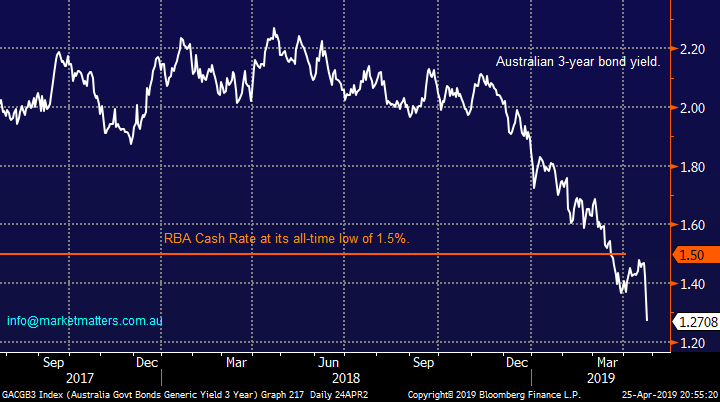
The Australian 3-year bonds are entrenched below the official target RBA cash rate of 1.5% as expectations for a rate cut, or two, in 2019 intensify following last week’s weak inflation numbers. The futures market is actually saying there’s an almost 70% chance of a rate cut in May, before the Federal election. Two cuts of 0.25% are priced in by Christmas, a pleasant present for those on variable mortgage rates but the yield on term deposits looks destined to become even more unattractive, which of course again makes equities a more attractive alternative.
The correlation between the 3-year bond yield and the ASX200 has been pronounced in 2019, as can be seen from the charts above and below although interestingly and something to consider moving forward, bond yields have led - simply once the expectations of rate cuts increased as is illustrated by tumbling bond yields local stocks took-off.
MM still expects Australian interest rates will be cut at least once in 2019.
Australian 3-year bond yield v RBA Cash Rate Chart
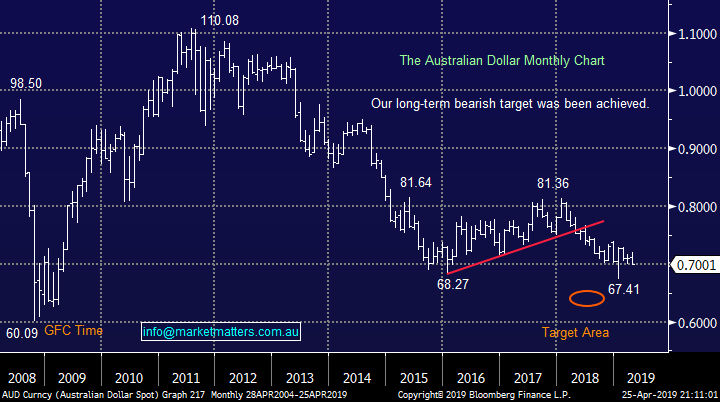
The little Aussie battler has struggled under the weight of the anticipated interest rate cuts by the RBA which is no great surprise, plus for good measure iron ore has given back some of its huge 2019 gains.
MM remains bullish the $A through 2019 / 2020, but as mentioned previously a spike towards 65c cannot be ruled out.
The Australian Dollar ($A) Chart
Looking at 5 different market scenarios we are watching as the infamous May approaches.
Today we have taken a look at 5 market scenarios / stocks we are watching carefully for opportunities into the Federal Election and before we know it a new financial year.
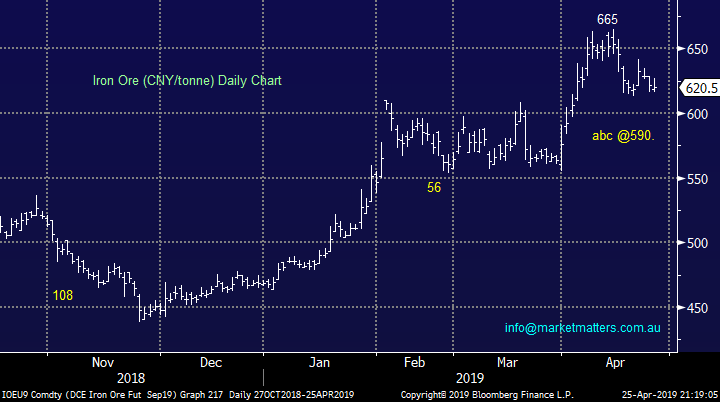
1 Iron Ore has pulled back almost 8%.
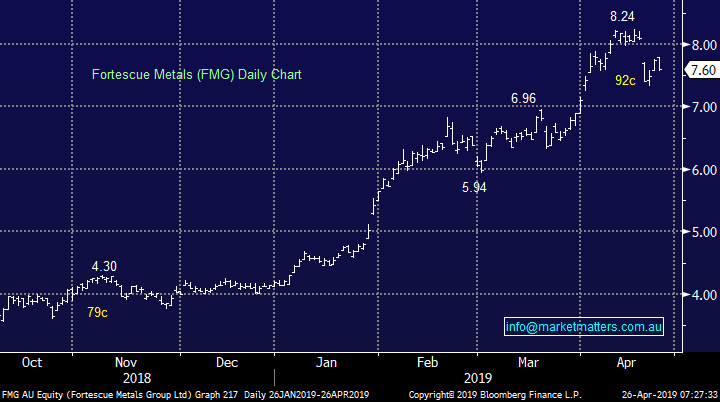
As mentioned earlier iron ore has corrected slightly over the last 2-weeks which should be no great surprise after its surge since late 2018. Ideally MM is looking for a dip below the psychological 600 CNY/tonne level to consider the likes of Fortescue Metals a (FMG).
However we must remain open-minded with such a volatile stock / complex and we will continue to focus on risk / reward opportunities.
MM’s current ideal entry into FMG is below $7.
Iron Ore (CNY/tonne) Chart
Fortescue Metals (FMG) Chart
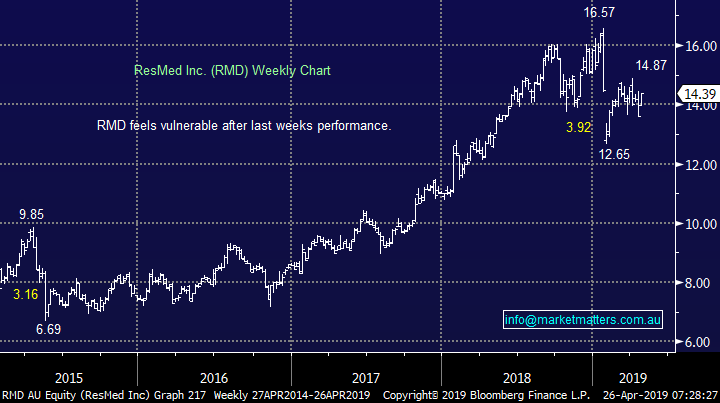
2 ResMed (RMD) is looking good.
Sleep treatment company ResMed (RMD) is one stock in the MM Growth Portfolio we have been watching very closely due to its $US earnings exposure and our contrarian opinion the $A is at least looking for a bottom. However at the moment the $US is enjoying the fundamental tailwind of being regarded more as a safe haven as usual as both Europe and China struggle on the economic front.
The company's shares plunged almost 24% in January following its disappointing Q2 scorecard which showed revenue growth below 10% to just over $650m. However we like their long term vision with investments in the likes of South Korea as they continue to reinvest ~7% of revenue into R&D. Our position is likely to show some volatility next month when the company reports its 3rd quarter earnings for the financial year on May 2nd but we feel the risks may be on the upside as participants will be nervous following Januarys performance. We bought RMD well into the recent decline at $13.00.
MM is bullish RMD looking for fresh all-time highs.
ResMed (RMD) Chart
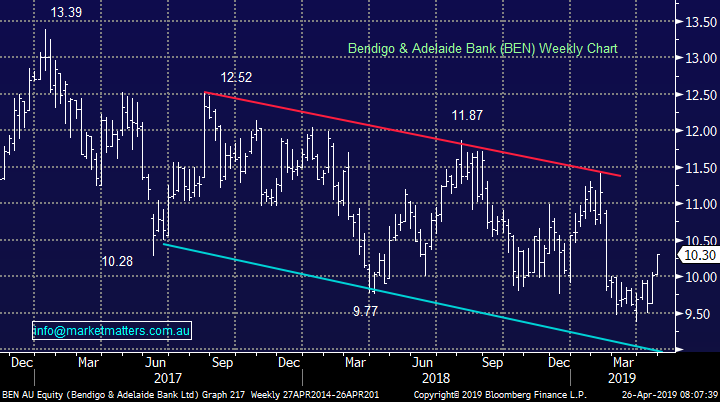
3 We haven’t pressed the “Buy button” on regionals yet.
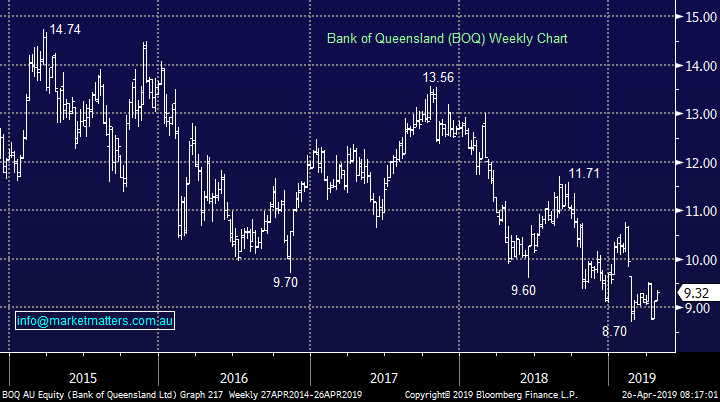
We have been considering taking a position in the Growth Portfolio in out of favour Bank of Queensland (BOQ) and / or Bendigo Bank (BEN) over the last 2-weeks but their “tone” especially with BOQ hasn’t felt quite right although things rarely do!
Weakness in May can often be self-fulfilling and although we are mindful of BOQ’s attractive 34c ff dividend on May 1st the opportunity to enter at a better level feels on balance a decent possibility – we still see value in the space via consolidation between the regionals we believe should add decent value. (We do have BOQ in the MM Income Portfolio from $8.86)
MM is still considering BOQ and / or BEN.
Bendigo & Adelaide Bank (BEN) Chart
Bank of Queensland (BOQ) Chart
4 NIB Holdings (NHF) is looking good.
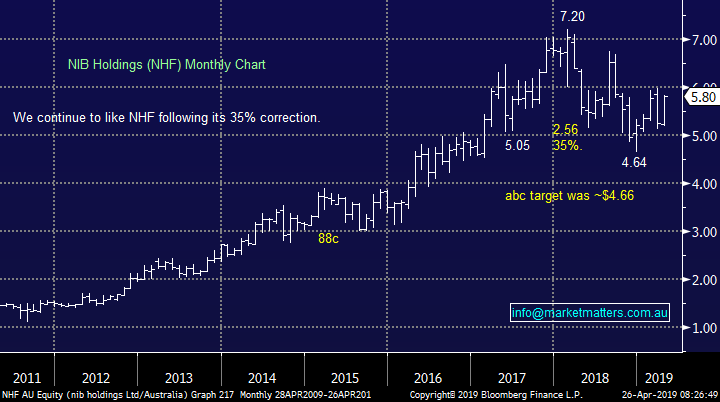
Private Health Insurer NIB Holdings (NHF) rallied 5% over the last 5-days and we believe its poised to make fresh 2019 highs, initially targeting $6.50 or over 10% higher. The company has a relatively defensive revenue stream which is liked by many investors especially as concerns have built around the local economy.
The stocks 35% correction as we saw cash strapped Aussies move away from private health insurance as belts were tightened feels to have washed through the share price and with the stock still almost 20% below its 2018 high some relative bargain hunting still feels on the cards.
MM is bullish NHF and may add to our 3% position in the Growth Portfolio.
NIB Holdings (NHF) Chart
5 Do we like 3M into last night’s weakness?
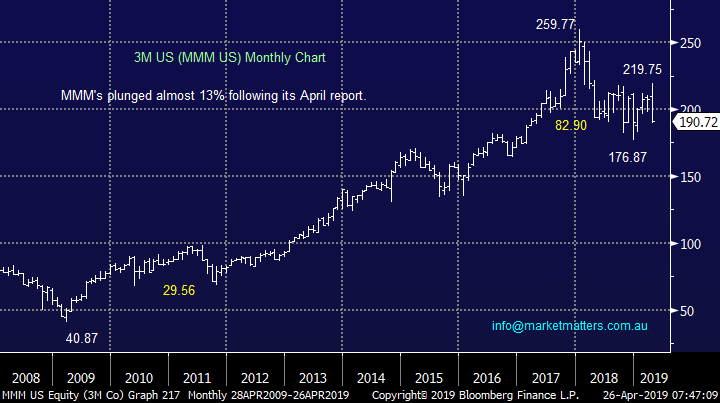
Overnight we saw 3M plunge almost 13%, dragging the Dow down in the process, following a miss on both profit and revenue expectations which slashing its full-year outlook plus the announcement of the intention to cut 2000 jobs – for those that remember it was actually the stocks worst day since the 1987 stock market crash!
Not surprisingly the volume overnight was huge with well over 7x the usual number of shares changing hands. The current stock market advance has often been described as a momentum rally as investors continue to buy strength in a similar manner to the $US, not where 3M sits this morning. Technically we can actually see 3M falling below its 2018 lows hence we see no reason to catch this falling knife on either a technical or fundamental reasons.
MM is now neutral 3M.
3M Co. (MMM US) Chart
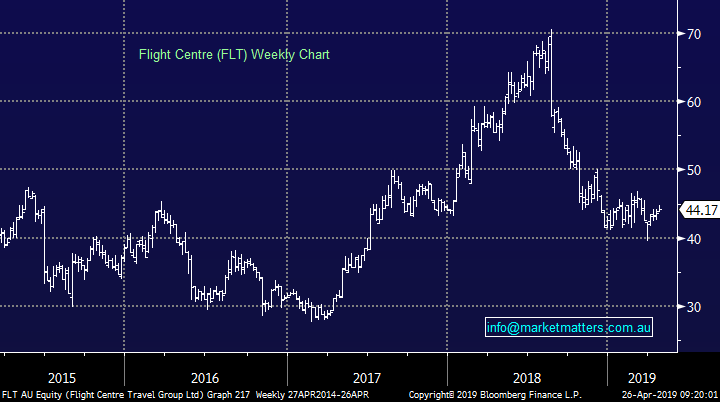
….and locally we’ve just seen Flight Centre (FLT) put through an 11% downgrade this morning with the travel company now expecting profit before tax of between $335m & $360m which is below the $391m the market was expecting. While their corporate travel business is performing retailing is clearly tough. While FLT is often considered ‘cheap’, trading on around 15x earnings, no stock is priced for a downgrade. With an 11% miss on earnings, and a P/E re-rate, we would expect a decline of ~15% or more which targets $37. Assuming that plays out, FLT looks to be entering a new trading range between $30 & $50.
MM is bearish Flight Centre targeting ~$30.
Flight Centre (FLT) Chart
Conclusion (s)
Of the 5 scenarios we looked at today we like RMD / NHF at todays prices and FMG, regional banks a touch lower while we will avoid 3M & FLT for now.
Global Indices
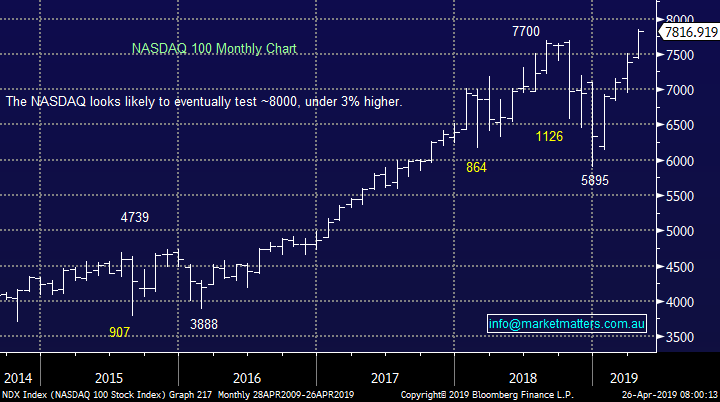
US stocks were mixed overnight as Easter fades into the distance and earnings take over. Medium-term we still think the NASDAQ has another ~3% upside medium-term but importantly our 8000 target for the NASDAQ is only a good day or two away in today’s market!
With both the S&P500 and tech based NASDAQ recently reaching fresh 2019 highs we are slowly becoming cautious US stocks.
US NASDAQ Chart
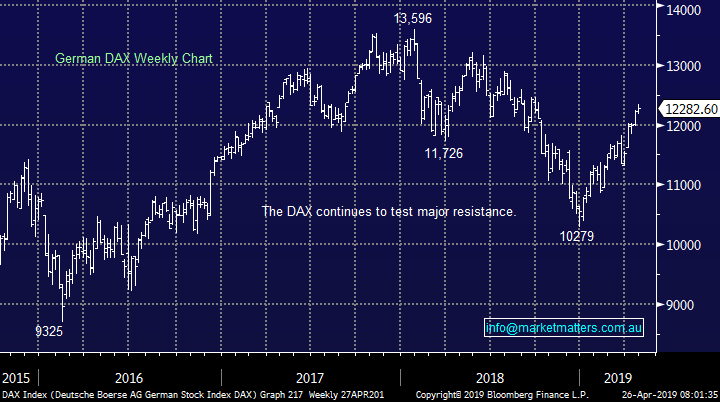
No change with European indices, we remain cautious as we enter the “sell in May and go away” period for European stocks.
German DAX Chart
Overnight Market Matters Wrap
• The US broader market lost traction for the past 2 sessions, with the Dow off 0.73% and the S&P 500 off -0.26% whilst Australia had a day off in remembrance of our fallen ANZACs.
• Global growth risk concerns remain with US treasury yields rising slightly, while on the commodities front, crude oil lost 1.76% from Tuesday.
• BHP is expected to continue its underperformance against the broader market after losing an equivalent of 0.52% from Australia’s previous close over the past 2 sessions.
• The June SPI Futures is indicating the ASX 200 to open 6 points higher, testing the 6390 level this morning.
Have a great day!
James & the Market Matters Team
Disclosure
Market Matters may hold stocks mentioned in this report. Subscribers can view a full list of holdings on the website by clicking here. Positions are updated each Friday, or after the session when positions are traded.
Disclaimer
All figures contained from sources believed to be accurate. Market Matters does not make any representation of warranty as to the accuracy of the figures and disclaims any liability resulting from any inaccuracy. Prices as at 26/04/2019
Reports and other documents published on this website and email (‘Reports’) are authored by Market Matters and the reports represent the views of Market Matters. The MarketMatters Report is based on technical analysis of companies, commodities and the market in general. Technical analysis focuses on interpreting charts and other data to determine what the market sentiment about a particular financial product is, or will be. Unlike fundamental analysis, it does not involve a detailed review of the company’s financial position.
The Reports contain general, as opposed to personal, advice. That means they are prepared for multiple distributions without consideration of your investment objectives, financial situation and needs (‘Personal Circumstances’). Accordingly, any advice given is not a recommendation that a particular course of action is suitable for you and the advice is therefore not to be acted on as investment advice. You must assess whether or not any advice is appropriate for your Personal Circumstances before making any investment decisions. You can either make this assessment yourself, or if you require a personal recommendation, you can seek the assistance of a financial advisor. Market Matters or its author(s) accepts no responsibility for any losses or damages resulting from decisions made from or because of information within this publication. Investing and trading in financial products are always risky, so you should do your own research before buying or selling a financial product.
The Reports are published by Market Matters in good faith based on the facts known to it at the time of their preparation and do not purport to contain all relevant information with respect to the financial products to which they relate. Although the Reports are based on information obtained from sources believed to be reliable, Market Matters does not make any representation or warranty that they are accurate, complete or up to date and Market Matters accepts no obligation to correct or update the information or opinions in the Reports. Market Matters may publish content sourced from external content providers.
If you rely on a Report, you do so at your own risk. Past performance is not an indication of future performance. Any projections are estimates only and may not be realised in the future. Except to the extent that liability under any law cannot be excluded, Market Matters disclaims liability for all loss or damage arising as a result of any opinion, advice, recommendation, representation or information expressly or impliedly published in or in relation to this report notwithstanding any error or omission including negligence.


