Overseas Wednesday – International Equities & Global Macro Portfolio (TAH, GOOGL US, BHP LN, QQQ US, ETPMAG)

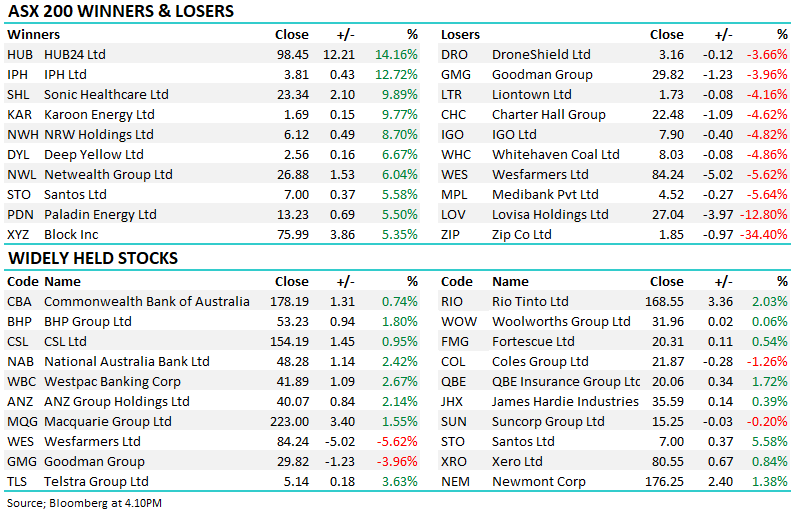
The ASX200 slipped into a slumber yesterday where a major move either up or down was definitely off the menu, in fact Tuesday was a rare day where the number of winners exactly matched the losers - further leads appear required before the local index feels capable of moving too far. The Banking Sector was the clear drag on the market while the resources remained strong led by the Gold Sector courtesy of a weak $US. Interestingly, the Real Estate Sector enjoyed a strong session after housing data failed to meet doomsday expectations, but the banks clearly remain in glass half empty mode. We’ll touch on what needs to change for the banks to ‘cop a bid’ in today’s income note.
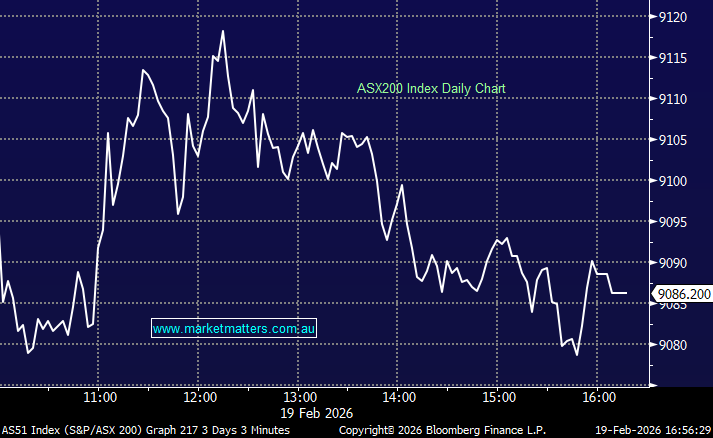
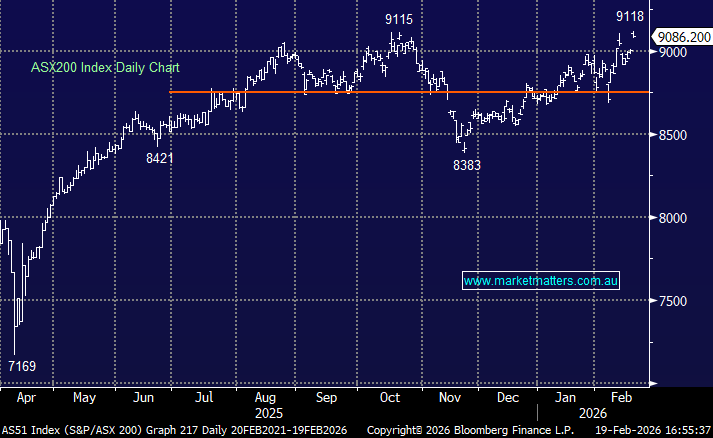
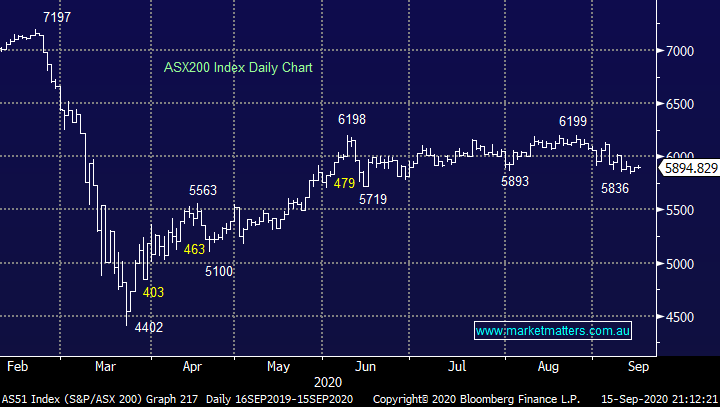
The index hasn’t moved now for well over 3-months, usually this would be extremely unusual but in 2020 its simply “flattening the volatility curve” after February & March. We’re currently witnessing huge stock / sector rotations as investors and traders try and second guess the future path for the global economy hopefully post the pandemic. On Tuesday the recovery stocks like Flight Centre (FLT) and Crown Resorts (CWN) struggled, if the pattern continues this will probably be reversed within the week. Our preferred scenario remains a pop higher for stocks in the coming weeks.
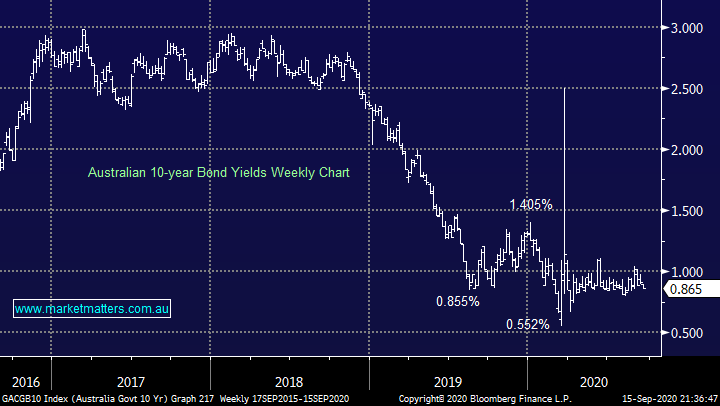
Equity valuations are largely determined by interest rates (bond yields) and as can be seen from the chart below the Australian bond yields are giving away zero clues around the future economic direction – some trends have been pretty clear over the last 6-months, this is most definitely not one of them.
Australian 10-year Bond Yield Chart
As we said earlier the ASX200 index hasn’t moved since mid-June, and if the Fed behaves during this week’s monthly meeting we may have to wait for some Trump v Biden election fireworks to bring stocks back to life. Through maintaining short-term interest rates around zero and buying trillions of dollars’ worth of bonds plus the new inflation strategy the Fed is continuing to do whatever it can to prop up the US economy and risk assets as a by-product. Chairman Powell is still waiting on the politicians to hammer out a 2nd stimulus package – it all feels way too early for negative hawkish central bank surprises.
MM remains bullish equities short-term.
ASX200 Index Chart
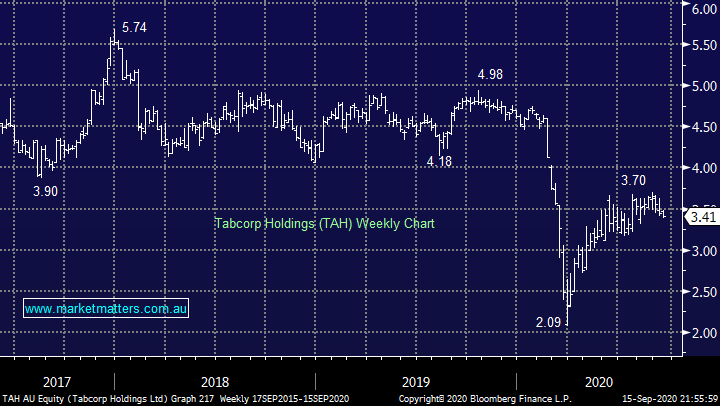
Overnight UBS were looking for institutions to sweep up a $129m remaining retail shortfall in Tabcorp (TAH) – bids were to be placed in 2c increments from $3.25. In mid-August TAH set out to raise $600m after they lost $870mn for the full year, the funds as we so often heard were to strengthen its balance sheet and reduce gearing. We feel this might be an early sign that retail investors are becoming tired on the bid side, no great surprise considering the year we’ve all experienced.
MM is neutral TAH.
Tabcorp Holdings (TAH) Chart
Overseas markets
Overnight the S&P500 rallied +0.5% and it appears to be stabilising after the recent tech inspired -7.7% pullback. In times of volatility, especially on the downside, context is imperative otherwise it’s tough to know when to be relaxed or when to start getting aggressive on the sell side:
1 – This month the US S&P500 has only corrected a very similar amount as in June and on a percentage basis close to the other 3 pullbacks since late March – we were overdue this move.
2 – In terms of the overall recovery since March this months only corrected 20% of the advance, a healthy move for any bull market which should be expected even by the most rampant optimist.
MM’s current view is stocks have endured a washout of the “hot money”, primarily from tech, but the market has also probably given us a warning that a deeper pullback is looming on the horizon – we all know there is plenty of event risk on the table at present. Our preferred scenario is US stocks make another assault on all-time highs but importantly MM will use this move if it unfolds to de-risk after basically being fully committed to equities since March – as we’ve said previously the air is slowly becoming thin for this impressive recovery.
MM remains bullish US stocks short-term.
US S&P500 Index Chart

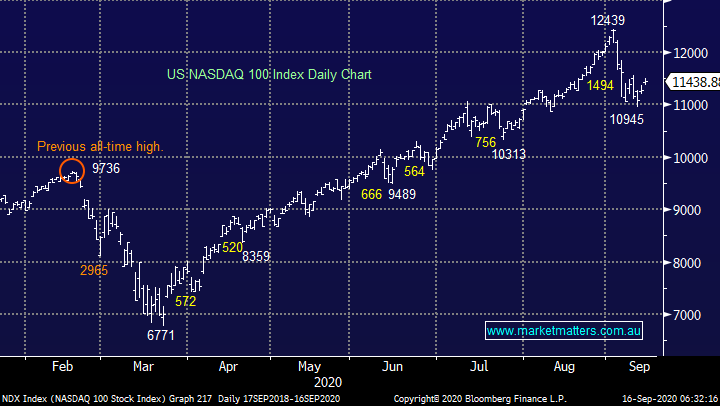
The tech sector has now managed to regain a third of its 12% fall, not surprisingly we have a similar view for this index as the S&P although it should not be forgotten that tech have shown us after Marchs rally they can fall significantly harder than the broad index. Following on from previous comments we are likely to reduce our tech position into strength if it unfolds over the coming weeks.
MM remains bullish US tech stocks short-term.
US NASDAQ Index Chart
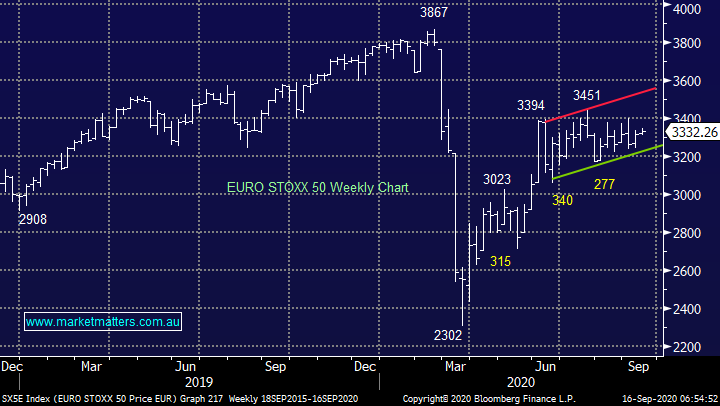
The European markets to which the ASX is so highly correlated is continuing to paint a very similar picture to ourselves i.e. struggling to make additional headway after its strong recovery since March but it still feels the inevitable path forward in the weeks ahead. We still believe equity markets in the region are constructive which is supported by a high EUREX put/call ratio (contrarian bullish), an upside breakout should be just around the corner.
By extrapolation, as we think it’s just a question of time before we see another breakout starting for Europe, this should flow onto local stocks with another assault on the 6200 area a likely scenario – my “best guess” is the next 3-weeks can see another test of the trendline resistance illustrated below in red.
MM remains bullish European stocks short-term.
Euro STOXX 50 Chart
Outside of bond yields arguably the most important insight for stocks comes from the $US which we’ve called pretty well in 2020 except its panic spike when the Coronavirus broke out. The $US has started to again move lower after it bounced when investors ran for cover from risk assets led by the tech sector. Our interpretation of the $US, precious metals and stocks remains intact:
1 – Global stocks are likely to form a top with precious metals and a first meaningful low in the $US – we are bearish the $US longer term but we plan to take some money into fresh lows.
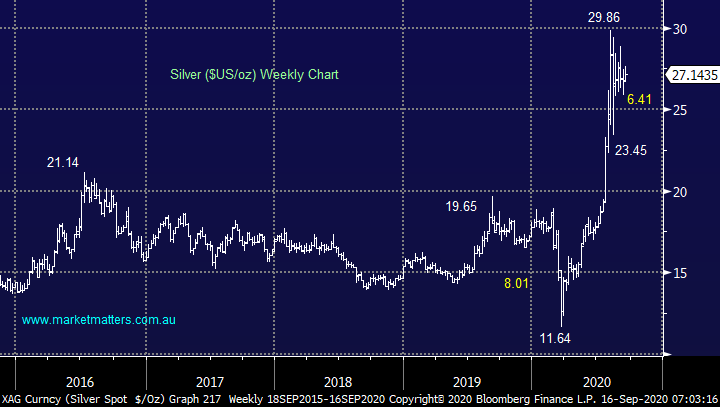
2 – Our ideal target for silver shown below is above $US30/oz, currently over 10% higher.
MM remains bullish precious metals.
Silver ($US/oz) Chart
MM International Portfolio
Last week we switched from Janus Henderson (JHG US) to Zoom (ZM US). Today I have covered 2 candidates we are holding to potentially be sold in the coming weeks if we see global equities rally to fresh post March highs, our preferred scenario and where we will be looking to increase cash levels.
MM continues to hold 6% of our International Portfolio in cash - MM International Portfolio: Click here
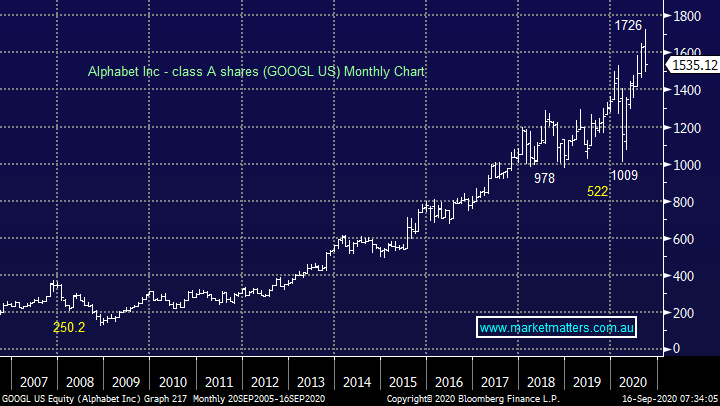
1 Alphabet Inc (GOOGL US) $US1535
A company that needs no introductions, unfortunately its underperformed both the market & sector this month correcting -13.5%. A couple of times in recent weeks we’ve flagged Google as a holding to be a sacrificial lamb to help us de-risk and this remains very much the view.
MM is considering taking profit in Google into strength.
Alphabet Inc (GOOGL US) Chart
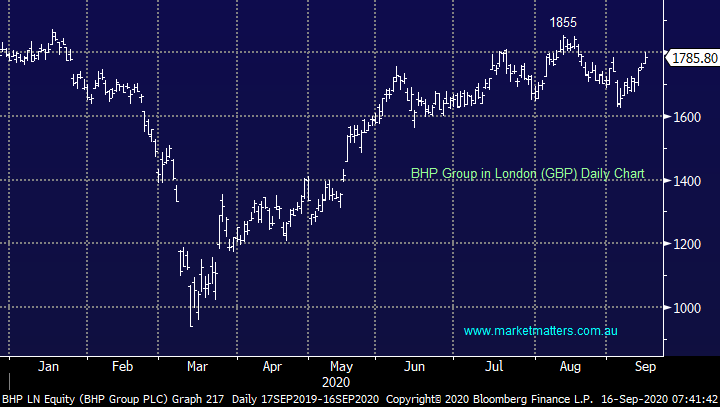
2 BHP Group London (BHP LN) GBP1785.50
Another stock that needs no introductions, although this position is on the London market, following on from our discussion on the $US earlier we are likely to take some profit from our resources exposure into strength with BHP an ideal candidate.
MM is considering taking profit on our UK based BHP holding around 6% higher.
BHP Group London (BHP LN) Chart
MM Global Macro ETF Portfolio
MM’s Global Macro Portfolios cash position remains at 19%: Click here
After watching markets evolve over the last week, we now have 2 ideas which we are looking at for tonight, onwards:
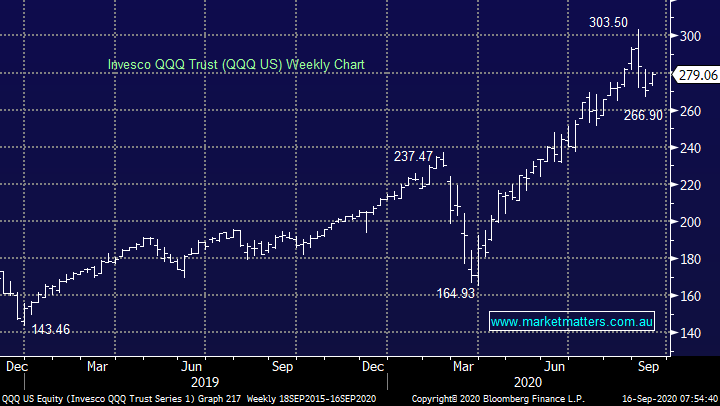
1 Invesco QQQ Trust (QQQ US) $US279.06
In hindsight we were a touch too fussy with our resting bids in the QQQ ETF but now we don’t necessarily want it if the tech sector falls to fresh monthly lows i.e. “if in doubt stay out” or in this case cancel.
**MM is cancelling our “resting” 2 bids in the QQQ**
Invesco QQQ Trust (QQQ US) Chart
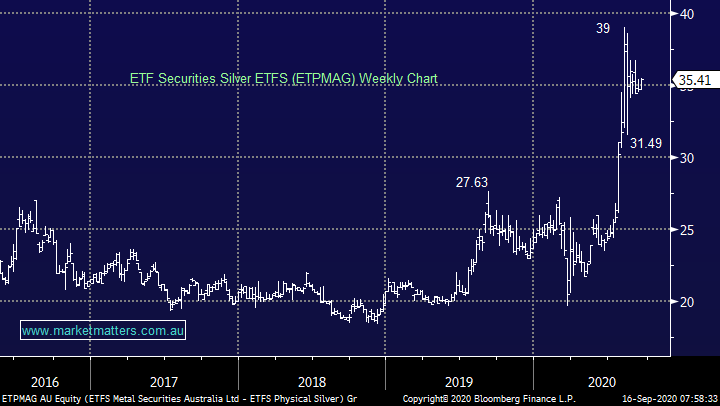
2 Silver ETFS (ETPMAG) $35.41
Again, in line with previous comments we are sellers of precious metals into fresh 2020 highs.
MM is looking to take profit on our ETPMAG position above around $40.
Silver ETFS (ETPMAG) Chart
Have a great day!
James & the Market Matters Team
Disclosure
Market Matters may hold stocks mentioned in this report. Subscribers can view a full list of holdings on the website by clicking here. Positions are updated each Friday, or after the session when positions are traded.
Disclaimer
All figures contained from sources believed to be accurate. All prices stated are based on the last close price at the time of writing unless otherwise noted. Market Matters does not make any representation of warranty as to the accuracy of the figures or prices and disclaims any liability resulting from any inaccuracy.
Reports and other documents published on this website and email (‘Reports’) are authored by Market Matters and the reports represent the views of Market Matters. The Market Matters Report is based on technical analysis of companies, commodities and the market in general. Technical analysis focuses on interpreting charts and other data to determine what the market sentiment about a particular financial product is, or will be. Unlike fundamental analysis, it does not involve a detailed review of the company’s financial position.
The Reports contain general, as opposed to personal, advice. That means they are prepared for multiple distributions without consideration of your investment objectives, financial situation and needs (‘Personal Circumstances’). Accordingly, any advice given is not a recommendation that a particular course of action is suitable for you and the advice is therefore not to be acted on as investment advice. You must assess whether or not any advice is appropriate for your Personal Circumstances before making any investment decisions. You can either make this assessment yourself, or if you require a personal recommendation, you can seek the assistance of a financial advisor. Market Matters or its author(s) accepts no responsibility for any losses or damages resulting from decisions made from or because of information within this publication. Investing and trading in financial products are always risky, so you should do your own research before buying or selling a financial product.
The Reports are published by Market Matters in good faith based on the facts known to it at the time of their preparation and do not purport to contain all relevant information with respect to the financial products to which they relate. Although the Reports are based on information obtained from sources believed to be reliable, Market Matters does not make any representation or warranty that they are accurate, complete or up to date and Market Matters accepts no obligation to correct or update the information or opinions in the Reports. Market Matters may publish content sourced from external content providers.
If you rely on a Report, you do so at your own risk. Past performance is not an indication of future performance. Any projections are estimates only and may not be realised in the future. Except to the extent that liability under any law cannot be excluded, Market Matters disclaims liability for all loss or damage arising as a result of any opinion, advice, recommendation, representation or information expressly or impliedly published in or in relation to this report notwithstanding any error or omission including negligence.


