Overseas Wednesday – International Equities & Global Macro Portfolio (CSL, ZM US, JHG US, QQQ US)
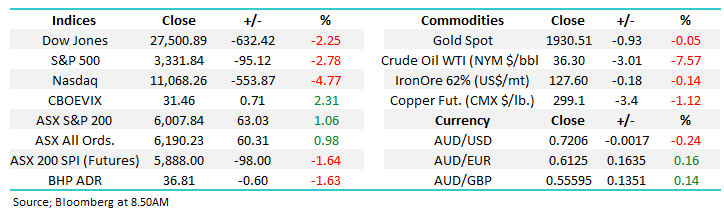
The ASX200 enjoyed a strong recovery yesterday although it constantly felt vulnerable to a correction, at lunchtime it had actually surrendered most of the days gains before finally managing to close up +1.1%, solid but not convincing. The pronounced rotation from underperformers to outperformers was personified by the best & worst performing stocks in the main index i.e. JB Hi-Fi (JBH) and Sims Metals (SGM).
When we consider that JBH has rallied almost 40% over the last 6-months while SGM has fallen -7% it’s easy to comprehend why some investors are slowly tweaking portfolios back towards the 2020 laggards. We did exactly the same thing early in the week when we took a part profit in OZ Minerals (OZL) and allocated some of the monies into Western Areas (WSA). In the US this is clearly unfolding with some gusto as tech sector threatens to wave a red flag.
JB HI-FI (JBH) v Sims Metals (SGM) Chart
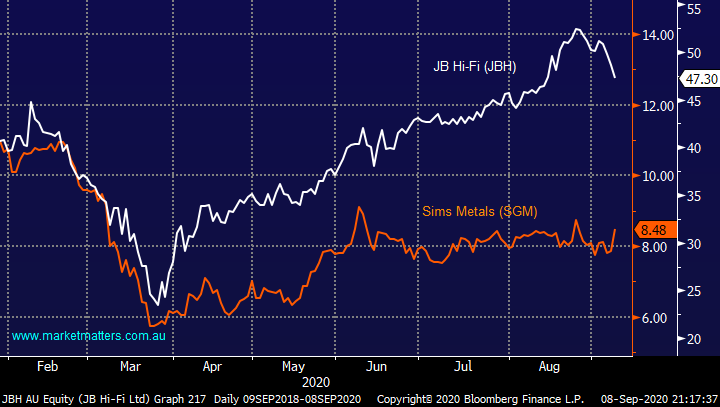
For all the noise and stock / sector rotation the index remains glued to the 6000 area, I’m glad were not index traders! This morning after sharp declines in the US the SPI futures are pointing to a test of the 5900 support area, still well within the last few months tight range but there may well be some opportunities surfacing on the stock / sector level.
MM remains bullish equities medium-term.
ASX200 Index Chart
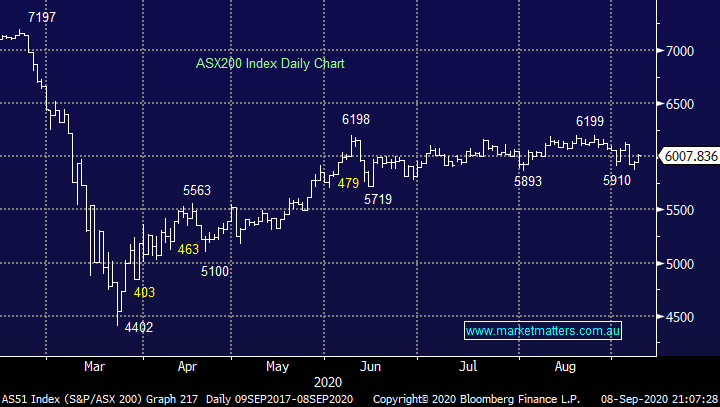
A number of investors I speak to are perplexed why CSL is not soaring higher considering its new COVID-19 manufacturing opportunities but its still early days in determining which vaccine (s) will prove successful. The press might be out in force after the PM named CSL as the manufacturer of any COVID-19 Vaccine, but as we said yesterday the prospective agreement with AstraZeneca is being touted as a $60 million to $90 million lift to the CSL’s earnings (EBIT) in FY21 – that’s only about a 2% benefit.
The problem with CSL is similar albeit on a lesser scale to the US tech space i.e. the market has been bullish and long leaving a dearth of buyers unless news is significantly earnings positive, not just 2%. This is undoubtedly a great company, but we remain interested closer to $250, as opposed to $300.
MM likes CSL around $250.
CSL Ltd (CSL) Chart
Overseas markets
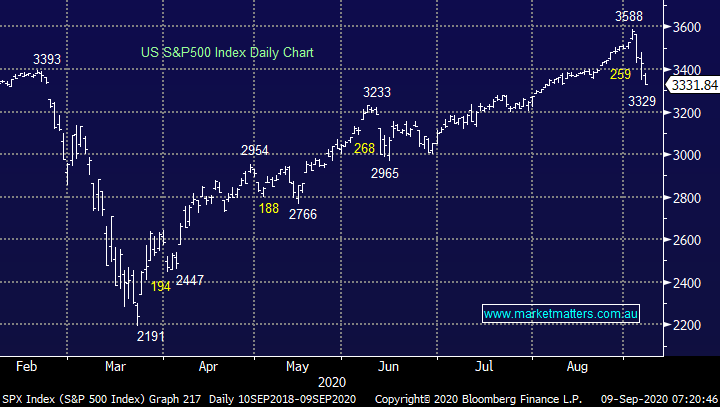
Overnight the S&P500 slipped another -2.8% as the NASDAQ dragged the US market lower, I’m hearing a number of people question whether we’ve seen a major top in US stocks, we don’t think so, at this stage the pullback is still smaller than the one in June. Our reasoning is primarily around the nature of the advance from March and specifically the last few weeks:
1 – Last week we warned that US stocks were trading around record overbought levels stating, “that the air is getting thin on the upside and the March bull run was maturing rapidly.” However, we are still haven’t witnessed any classic signs of distribution / toppish price characteristics. Hence, we feel it’s too early to get bearish, but it may be the beginning of the end i.e. MM ae highly likely to de-risk if / when US stocks make fresh all-time highs.
2 – There remains a widespread belief among investors that the rally in the US is mainly based and driven by the top 5 mega cap technology stocks. However 6 key sectors (housing, consumer staples, materials, railroads, semiconductors, Internet sector) are all trading on all-time high, plus healthcare as well transport are trading very close to a new all-time high, the point being the breadth in the US has actually been very good, making last week´s spike in new 52-week highs a bullish broad based sign i.e. the continual rhetoric that its all just about tech is simply wrong.
We remain relaxed at least for now, the markets simply following our script from last week – “although another correction in the tech space feels to be looming rapidly on the horizon, we’ve seen one every month since Marchs panic low and August has been one-way traffic - at this stage we see no reason to expect the markets rhythm to have changed.”. We believe the current washout in the tech space is healthy for the market but as always, we remain open-minded and vigilant.
MM remains bullish US stocks medium-term.
US S&P500 Index Chart
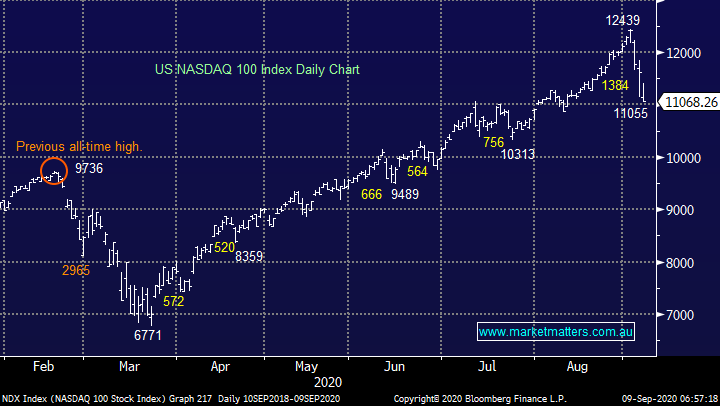
Overnight it was a battle between the Oil & Tech Sectors to lead the market lower with the later finally winning line honours. The last 4-days has seen the tech space plunge over 11% registering its largest pullback since March in the process but its reaching the area where MM believes the panic washout is close to being exhausted. However, we would note that we’re only looking for ~15% upside before we’d be taking some $$.
MM remains bullish US tech stocks medium-term.
US NASDAQ Index Chart
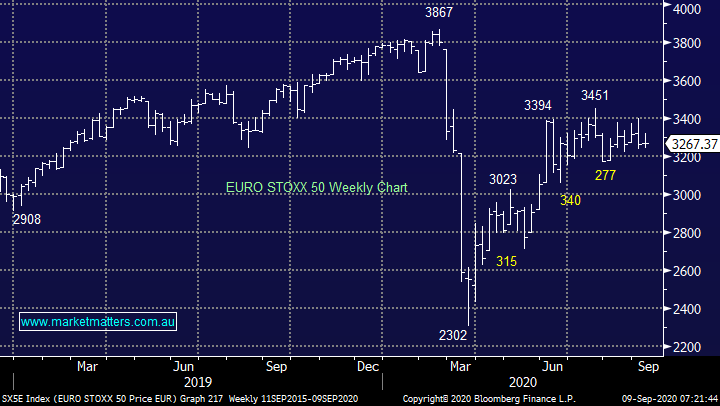
The European markets to which the ASX is very highly correlated is continuing to paint a very similar painting to ourselves i.e. struggling to make additional headway after its strong recovery since March but it still feels inevitable that it’s the likely path forward into 2021 but not necessarily Christmas. However in the short-term we can see a ~4% pullback which would provide excellent risk / reward buying, for this to occur I would imagine the US will continue to “wobble” for at least a few more days.
MM remains bullish European stocks medium-term.
Euro STOXX 50 Chart
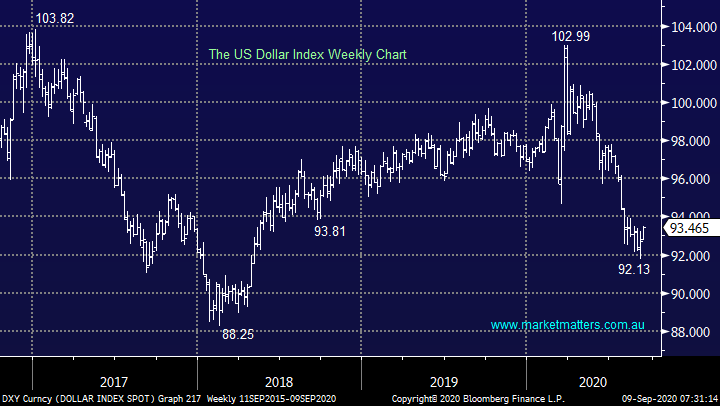
An important insight for stocks comes from the $US which we’ve called pretty well in 2020 except its panic spike above 102 when the coronavirus broke out. The $US bounced nicely overnight as investors appeared to look for safety as the NASDAQ plunged lower – MM has been calling a bounce towards 94 for a few weeks, if that proves correct MM sees 2 important read throughs:
1 – Global stocks are likely to form a low around the same time that the $US hits ~94, not far now.
2 – Gold and other commodities are likely to rally after the $US rejects the 94 region.
MM remain a seller of the $US around 94.
The $US Index Chart
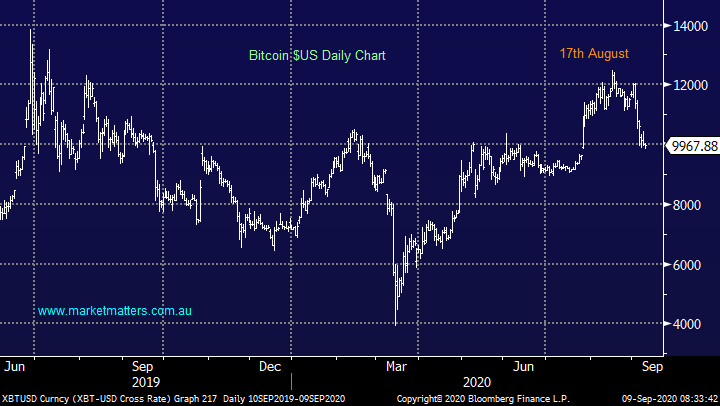
The speculators favourite Bitcoin has declined in similar fashion to the NASDAQ as punters have probably met margin calls in a number of markets. Interestingly the crypto currency continues to be a useful lead for stocks topping out around 2-weeks before stocks – leading indicators are obviously useful tools in both directions.
MM sees support for Bitcoin a few % lower.
Bitcoin ($US) Chart
MM International Portfolio
Again no change, MM continues to hold only 6% of our International Portfolio in cash - MM International Portfolio: Click here
MM considered taking some profit last week in 1 – 2 tech names but in hindsight were a touch too slow – hindsight’s a great trader and unfortunately, we are human. However, the plunge in the tech names has brought about an opportunity which we were considering in the Weekend Report. We reiterate that MM is bullish equities over the next 12-18 months but “buy weakness and sell strength” feels very much the mantra moving forward where the later should not be ignored when all looks rosy.
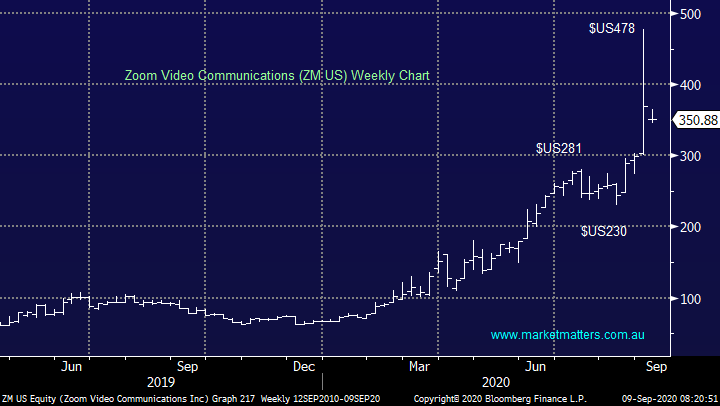
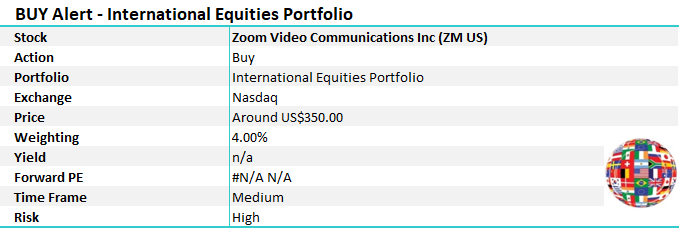
1 Zoom Video Communications (ZM US) $US350.88
Zoom (ZM US) soared over 40% last week after it delivered a huge beat at their recent update reporting revenue of $663.5m for the quarter, a 4-fold increase on a year earlier and well above the $500m expected – that’s a huge beat! There is competition in the space with Microsoft Teams the main rival, however Zoom is on newer architecture with better / simpler features. Additionally, Zoom has been adding customers at a greater rate and that increased customer base can be leveraged in time. To give some context here, they claim to accommodate around 300m Zoom meeting participants per day.
While our reliance on Zoom will ultimately fade to some degree when travel becomes possible again, we believe the move towards online meetings is a structural shift and that ultimately life will not revert back to where it was pre-covid. This is not just a financial decision, it also has environmental consequences as well as lifestyle benefits, less travel = more time, somethings that’s always in short supply!
MM likes Zoom around $US350.
Zoom Video Communications (ZM US) Chart
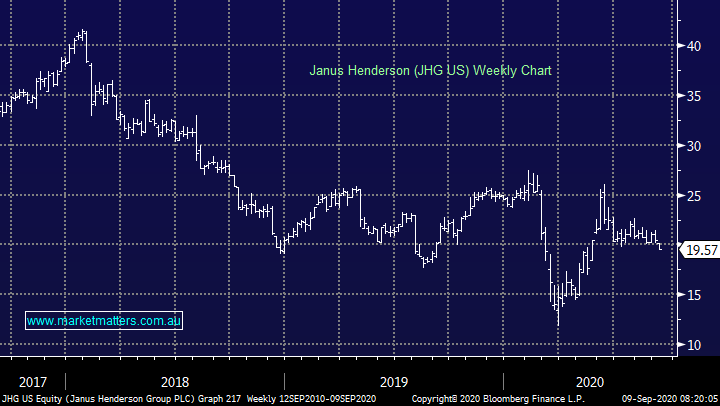
2 Janus Henderson (JHG US) $19.57
Money manager JHG has continued to struggle to reign it’s ongoing withdrawal of FUM (funds under management), after its strong bounce from March’s low we would rather deploy the funds elsewhere.
MM is neutral JHG at current levels.
Janus Henderson (JHG US) Chart
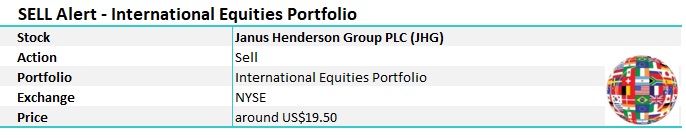
**Alerts**
MM plans to switch from Janus Henderson (JHG US) listed on New York Stocks Exchange into Zoom (ZM US) listed on the Nasdaq tonight.
MM Global Macro ETF Portfolio
MM’s Global Macro Portfolios cash position remains at 19%: Click Here
After watching markets evolve over the last few days, we now have 1 position we are looking at for tonight, onwards, again following our Weekend Report:
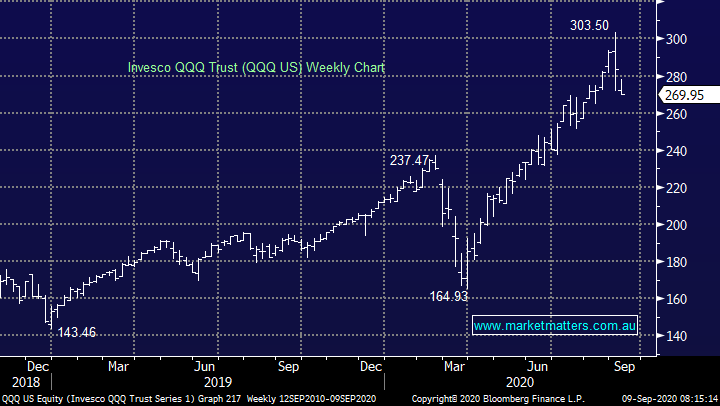
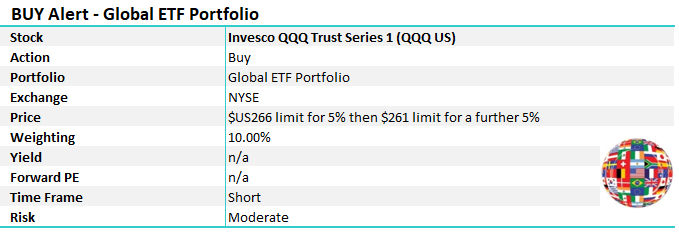
1 Invesco QQQ Trust (QQQ US) $US269.95.
In line with previous comments we plan to leave 2 resting orders to buy the NASDAQ into further weakness.
MM is looking to buy the QQQ at $US266 and $US261- 5% at each level.
The QQQ Trust is a major unleveraged NASDAQ ETF with a market cap. over $US135bn
Invesco QQQ Trust (QQQ US) Chart
US NASDAQ Index Chart

**Alert**
MM is looking to buy the QQQ at $US266 and $US261, with a 5% allocation at each level, totalling a 10% weighting.
Have a great day!
James & the Market Matters Team
Disclosure
Market Matters may hold stocks mentioned in this report. Subscribers can view a full list of holdings on the website by clicking here. Positions are updated each Friday, or after the session when positions are traded.
Disclaimer
All figures contained from sources believed to be accurate. All prices stated are based on the last close price at the time of writing unless otherwise noted. Market Matters does not make any representation of warranty as to the accuracy of the figures or prices and disclaims any liability resulting from any inaccuracy.
Reports and other documents published on this website and email (‘Reports’) are authored by Market Matters and the reports represent the views of Market Matters. The Market Matters Report is based on technical analysis of companies, commodities and the market in general. Technical analysis focuses on interpreting charts and other data to determine what the market sentiment about a particular financial product is, or will be. Unlike fundamental analysis, it does not involve a detailed review of the company’s financial position.
The Reports contain general, as opposed to personal, advice. That means they are prepared for multiple distributions without consideration of your investment objectives, financial situation and needs (‘Personal Circumstances’). Accordingly, any advice given is not a recommendation that a particular course of action is suitable for you and the advice is therefore not to be acted on as investment advice. You must assess whether or not any advice is appropriate for your Personal Circumstances before making any investment decisions. You can either make this assessment yourself, or if you require a personal recommendation, you can seek the assistance of a financial advisor. Market Matters or its author(s) accepts no responsibility for any losses or damages resulting from decisions made from or because of information within this publication. Investing and trading in financial products are always risky, so you should do your own research before buying or selling a financial product.
The Reports are published by Market Matters in good faith based on the facts known to it at the time of their preparation and do not purport to contain all relevant information with respect to the financial products to which they relate. Although the Reports are based on information obtained from sources believed to be reliable, Market Matters does not make any representation or warranty that they are accurate, complete or up to date and Market Matters accepts no obligation to correct or update the information or opinions in the Reports. Market Matters may publish content sourced from external content providers.
If you rely on a Report, you do so at your own risk. Past performance is not an indication of future performance. Any projections are estimates only and may not be realised in the future. Except to the extent that liability under any law cannot be excluded, Market Matters disclaims liability for all loss or damage arising as a result of any opinion, advice, recommendation, representation or information expressly or impliedly published in or in relation to this report notwithstanding any error or omission including negligence.


