Overseas Wednesday – International Equities & Global Macro Portfolio (APT, GOOGL US, JHG US, WFC US, GOLD US, ETPMAG, VAE, ASIA)
The ASX200 is now entering its 3rd month of rotation between 5700 and 6200 and the last few days have provided no meaningful evidence that stocks have the enthusiasm to breakout in either direction. Yesterday’s 111-points rally was impressive, but it just took us back to the equilibrium level of the last 10-weeks. Under the hood it was comforting to see almost 90% of the market close up on the day while the “hot” gold stocks dominated the declines as investors moved back up the “risk curve”, albeit only slightly – a reversion of this already feels likely today.
No great surprise in our office to the see the RBA leave interest rates on hold although it has indicated the intention to commence buying government bonds to maintain the abundance of almost “free money” available for borrowers and importantly keeping the 3-year bond yield pegged to the 0.25% official cash rate. Governor Philip Lowe also stated that more fiscal and monetary policy would be required to prop up the withering economy. Many people are describing the RBA as basically out of ammunition but they haven’t moved anywhere near the stimulatory efforts of the US Fed who are also buying corporate bonds from the likes of Apple, Microsoft and Home Depot pushing down their cost of capital, almost a case of the rich get richer.
Happily, the Australian virus numbers eased yesterday while clearly awful have not picked up momentum in recent days, especially outside of Victoria. NSW Premier Ms Berejiklian said yesterday that “NSW is about halfway through a critical stage in its fight against COVID-19”. Personally it feels like were approaching the 1st quarter but I’m pleased to say my friends and colleagues are taking the risks very seriously, fingers crossed we can avoid a major 2nd wave in Sydney, an achievement which will help Victoria and the whole country get back up off the canvas in true Aussie fashion!
Australian 3-year Bond Yield Chart
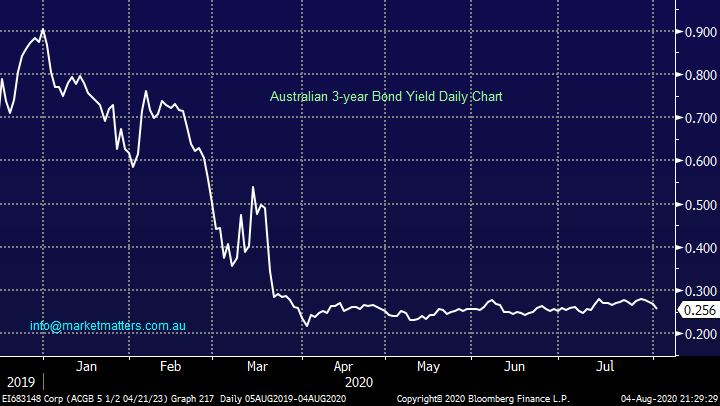
Nothing significant to add with regards to the ASX, its holding up under an abundance of bad economic news but conversely it still doesn’t have any conviction to sustain a meaningful challenge of its post coronavirus 6200 high. Never say never is something we adhere to at MM but my “Gut Feel ” is it’s going to be very tough for the local market to enjoy a sustained rally without the banks and that means the economy needs to show signs of improvement. Choppier price action over the coming weeks feels the path of least resistance.
MM remains bullish equities medium-term.
ASX200 Index Chart
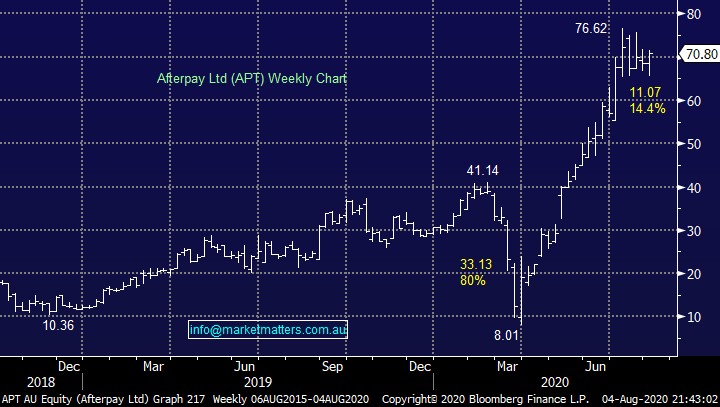
The BNPL (buy now pay later) space had a great Tuesday with Afterpay (APT) +6.5% ranking it the 3rd strongest stock on the main board, Z1P which we own rallied around 9% while Openpay Group (OPY) soared over 20%. One of the reasons we continue to monitor the space closely is because APT in particular has been a great indicator for the high beta end of the market, we currently remain bullish APT with an initial target over 10% higher.
Interestingly while the NASDAQ made fresh all-time highs this week the breadth of strength under the hood has been diminishing with only Apple really driving the train, in simple English this means some consolidation / a rest is our preferred scenario over the coming weeks. Potentially the BNPL space will be the last part of the local tech puzzle to complete before they also take a break after a great run since March – reporting in August will obviously be important here.
MM remains bullish After Pay Ltd (APT) targeting ~$80.
Afterpay Ltd (APT) Chart
Overseas stocks
Earlier we noted the deteriorating momentum and increasing selectivity in the US market, historically a leading indicator for a pullback albeit one to again buy in our opinion as we anticipate ongoing asset price inflation for 12-18 months. The Bank of America Fund manager Survey will be released soon for August, it will be interesting after Julys theme of “cash is king” has again proven wrong i.e. average cash balances fell to 4.9% from 5%, above the 5-year average of 4.5%. Investors were overweight cash due to bearish outlook for markets (25%) and preference for cash over low-yielding assets (20%).
The 10-year low in the CBOE Put/Call ratio implies the US market is no longer hedged to the downside and therefore vulnerable for a negative surprise this month. However the persistent negative position of many investors who cannot look past the weak economic backdrop suggests to MM another pullback will be fairly shallow and ultimately should be bought sooner rather than later as the queue of investors hoping to re-enter stocks “on the cheap” will again miss out.
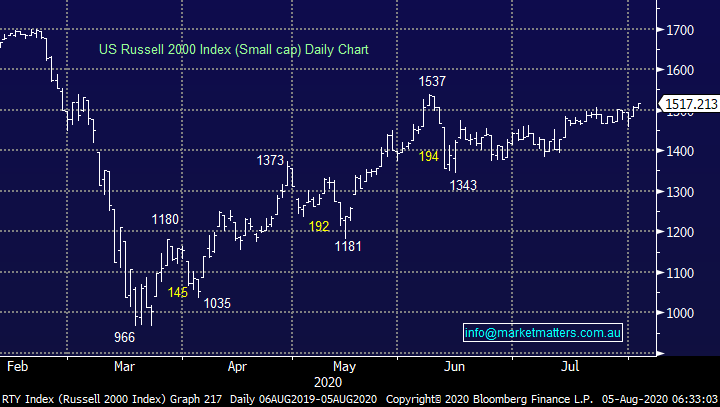
MM remains bullish US stocks medium-term but right now things feel stretched.
US Russell 2000 Index Chart
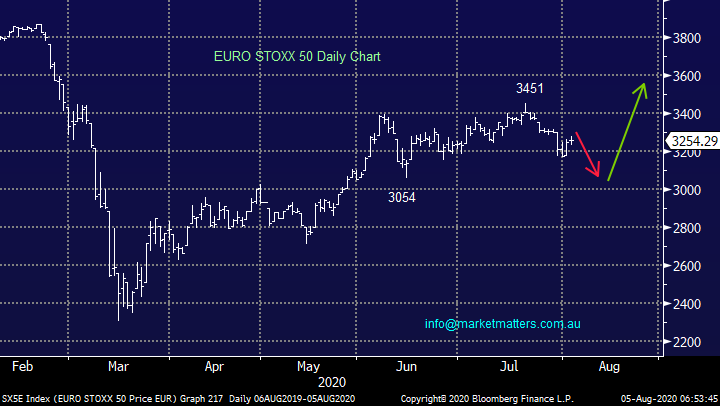
The technical picture from Europe we highlighted last week remains worrisome short-term with an ongoing pullback our preferred scenario – remember the ASX is far more correlated to Europe than the US.
European stocks still look set to fall another ~5%.
EURO STOXX 50 Chart
MM International Portfolio
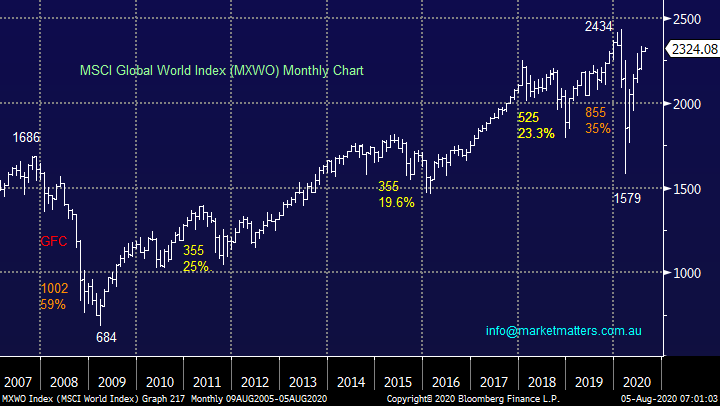
MM continues to hold only 6% of our International Portfolio in cash, in other words we are “very long” equities which feels ok as many US stocks test all-time highs. However, as we envisage a pullback in the coming weeks we are on the lookout for opportunities to tweak portfolios along the macro themes we like into 2021/22. Interestingly both stocks we were considering selling last week drifted lower illustrating it was just the few heavyweights dragging US indices higher.
MM International Portfolio : https://www.marketmatters.com.au/new-international-portfolio/
MSCI Global World Index Chart
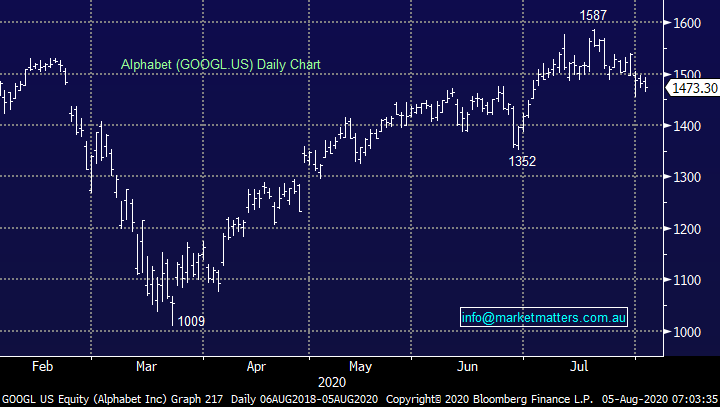
Alphabet (GOOGL US $US1503
We held back on taking profit on Google this week which doesn’t look too smart today as the tech goliath has drifted lower in a strong tech space although this confirms we are probably right! As subscribers know we feel the technology sector is due for a period of underperformance and probably a reasonable pullback short-term – Google is our preferred candidate to help us de-risk towards the “hot tech space” and hence by definition we prefer to hold our positions in Apple (AAPL US) and Microsoft (MSFT US) moving into 2021.
MM is considering taking profit on our position in Google.
Alphabet Inc (GOOGL US) Chart
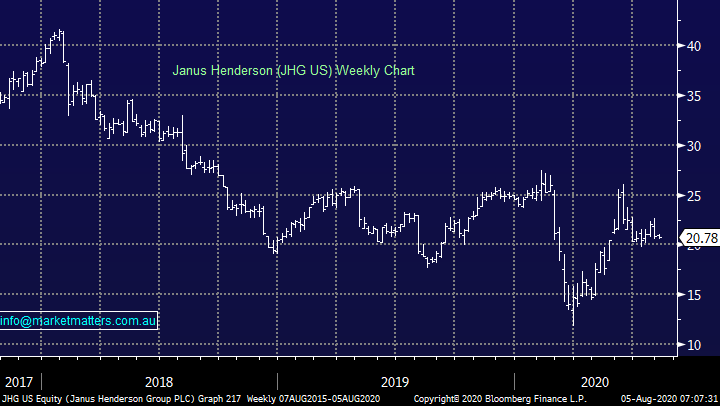
Janus Henderson (JHG US) $US22.04
Similarly, investment manager JHG remains in our sell sights, it has recovered strongly from its 2020 low but after more than doubling since March its started to struggle as outflows continue to disappoint. Switching MM to neutral the stock technically while there are other sectors we prefer fundamentally, hence it remains a prime candidate to help us increase cash levels.
MM is neutral JHG at current levels hence cutting the position makes sense.
Janus Henderson (JHG US) Chart
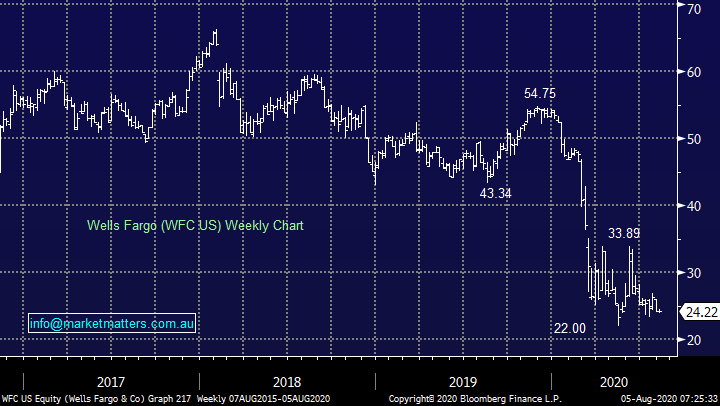
Wells Fargo (WFC US) $US24.22
WFC has been the proverbial thorn in the side of our International Portfolio which has otherwise thoroughly enjoyed 2020. Assuming we do see a market correction in the coming weeks a thematic we’ve alluded to in previous reports is may well be led by the major underperformers since COVID-19 changed the investment landscape but in our opinion the risk / reward favours buying this potential washout in the banks in particular – we are considering averaging WFC into fresh 2020 lows.
MM likes WFC under $US22.
Wells Fargo (WFC US) Chart
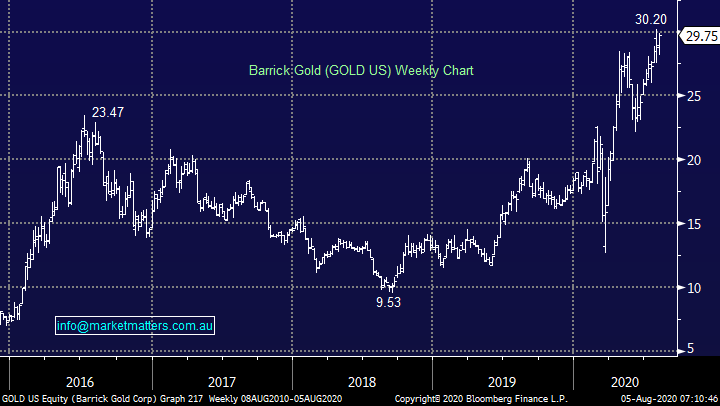
Barrick Gold (GOLD US) $US29.59
International gold miner Barrick Gold (GOLD US) has a market cap of $US52bn making it more than double the size of our own Newcrest Mining (NCM). Like the sector we like GOLD but the lack of upside momentum even after golds roared through $US2000/oz reaffirms our concerns that the markets long increasing the potential of a short-term washout on the downside.
MM likes Barrick Gold into a pullback.
Barrick Gold (GOLD US) Chart
MM Global Macro ETF Portfolio
No change, MM currently has 24% of our Global Macro Portfolio in cash : https://www.marketmatters.com.au/new-global-portfolio/
There are a couple of areas where we are looking to deploy cash in coming days:
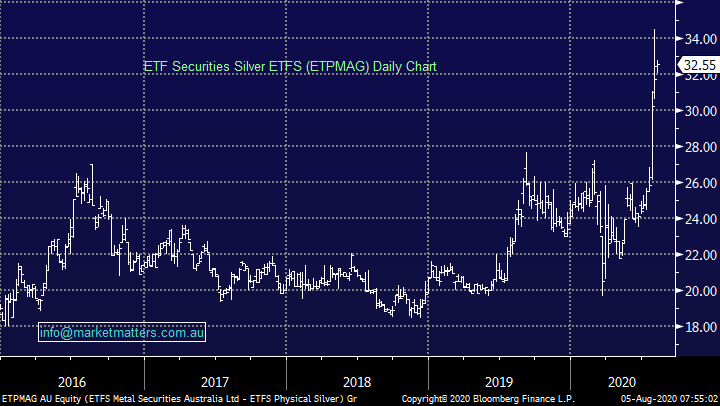
1 ETF Securities Silver Bullion ETF (EFPMAG) $32.55
Our updated preferred way to implement our bullish silver view is through the ASX listed Physical Silver ETF from aptly named ETF Securities. This tracks the Silver price minus the 0.49% pa management fee and is unhedged, so a higher AUD does detract from performance however that’s the case with the alternatives given they’re listed overseas. The security is underpinned by Silver bars held in a vault and is known as an exchange traded commodity (ETC). It can be bought / sold like a normal share, using the 6-letter code EPTMAG or on some platforms EPTMAG.AXW.
MM is considering accumulating the ETFS at current levels and into any pullback under $32.
ETF Securities Silver Bullion ETF (ETPMAG) Chart
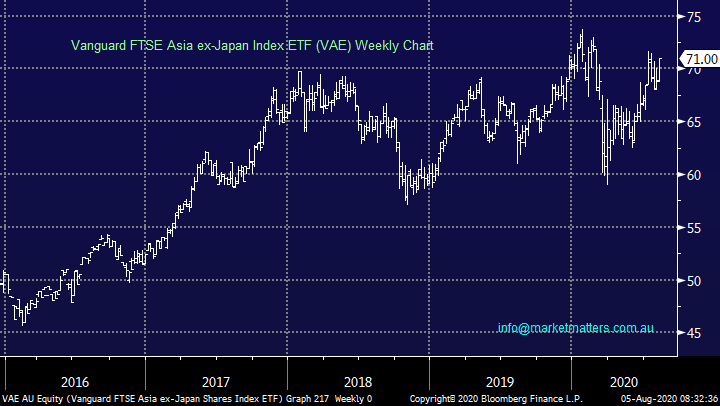
2 Vanguard FTSE Asia ex-Japan Index ETF (VAE) $71.
We like this ETF because it offers ~44% exposure to China plus great correlation to our underlying bearish $US view while also providing ease of access as its traded on the ASX – we are bullish initially targeting a breakout to fresh contract highs ~75.
MM likes VAE at current levels.
Vanguard FTSE Asia ex-Japan Index ETF (VAE) Chart
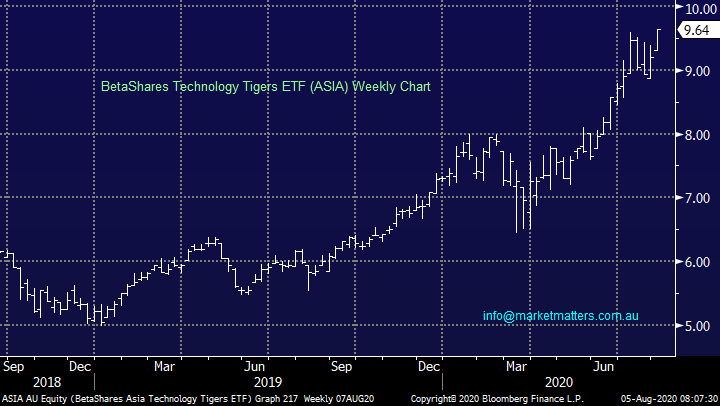
3 BetaShares Technology Tiger ETF (ASIA) $9.64
The Asian based technology stocks have danced the same tune as the NASDAQ breaking out on the upside this week. We don’t advocate chasing at current levels, but we are keen buyers on a pullback towards last week’s low.
MM likes ASIA back around $9.
BetaShares Technology Tigers ETF (ASIA) Chart
Conclusions
MM is looking to tweak both of our International & Global Macro Portfolios as outlined above.
Watch for alerts.
Have a great day!
James & the Market Matters Team
Disclosure
Market Matters may hold stocks mentioned in this report. Subscribers can view a full list of holdings on the website by clicking here. Positions are updated each Friday, or after the session when positions are traded.
Disclaimer
All figures contained from sources believed to be accurate. All prices stated are based on the last close price at the time of writing unless otherwise noted. Market Matters does not make any representation of warranty as to the accuracy of the figures or prices and disclaims any liability resulting from any inaccuracy.
Reports and other documents published on this website and email (‘Reports’) are authored by Market Matters and the reports represent the views of Market Matters. The Market Matters Report is based on technical analysis of companies, commodities and the market in general. Technical analysis focuses on interpreting charts and other data to determine what the market sentiment about a particular financial product is, or will be. Unlike fundamental analysis, it does not involve a detailed review of the company’s financial position.
The Reports contain general, as opposed to personal, advice. That means they are prepared for multiple distributions without consideration of your investment objectives, financial situation and needs (‘Personal Circumstances’). Accordingly, any advice given is not a recommendation that a particular course of action is suitable for you and the advice is therefore not to be acted on as investment advice. You must assess whether or not any advice is appropriate for your Personal Circumstances before making any investment decisions. You can either make this assessment yourself, or if you require a personal recommendation, you can seek the assistance of a financial advisor. Market Matters or its author(s) accepts no responsibility for any losses or damages resulting from decisions made from or because of information within this publication. Investing and trading in financial products are always risky, so you should do your own research before buying or selling a financial product.
The Reports are published by Market Matters in good faith based on the facts known to it at the time of their preparation and do not purport to contain all relevant information with respect to the financial products to which they relate. Although the Reports are based on information obtained from sources believed to be reliable, Market Matters does not make any representation or warranty that they are accurate, complete or up to date and Market Matters accepts no obligation to correct or update the information or opinions in the Reports. Market Matters may publish content sourced from external content providers.
If you rely on a Report, you do so at your own risk. Past performance is not an indication of future performance. Any projections are estimates only and may not be realised in the future. Except to the extent that liability under any law cannot be excluded, Market Matters disclaims liability for all loss or damage arising as a result of any opinion, advice, recommendation, representation or information expressly or impliedly published in or in relation to this report notwithstanding any error or omission including negligence.