Overseas Wednesday – International Equities & Global Macro Portfolio (TWE, MND, RIO, GOOGL US,JHG US, JPM US, DBA US, ETPMAG)
LOCAL REPORTING CALENDAR: CLICK HERE **Please note, data sourced from Bloomberg, not all ASX companies are on this list and dates can vary**
Today we have a long list of results – best to click the link above. I have covered ANZ, BAP, CAR, CSL, DMP, NWH, & OZL in the recording below.

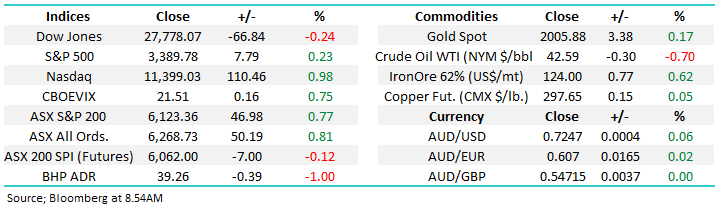
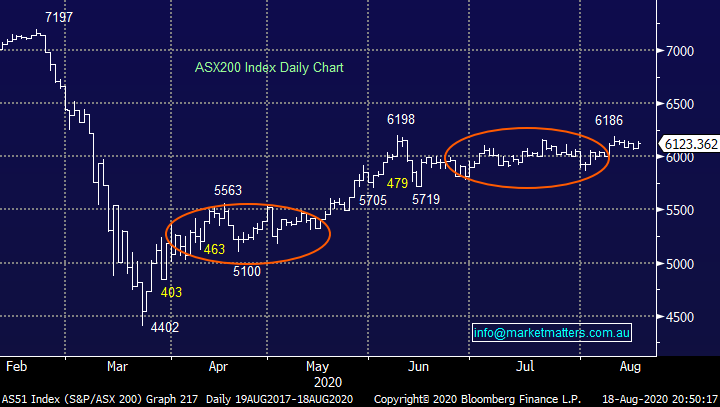
The ASX200 feels poised to attack the 6200 area and make a fresh 5-month high in the process, yesterday’s strong +0.8% rally has most of the right ingredients for continuation i.e. a fairly broad based advance with over 65% of the index rising while most importantly the reporting season is providing a healthy tailwind, we just need to see the embattled banks regain a little “mojo”. Overnight the S&P500 finally posted a fresh all-time high perhaps this might force some of the local money off the sidelines – it feels too easy to be in cash at present.
Australian stocks continue to climb the wall of worry while absorbing regular capital raises along the way, on Monday it was Lynas (LYC) looking for $425m and today we will see how successful the founders of Kogan.com have been selling down $163m of stock plus we get the details of Tabcorp’s (TAH) much anticipated ~$500m entitlement offer. Fund managers are clearly still awash with cash but when raises eventually start to struggle we might have a vital clue that the supply of cash to fuel this glorious bull market is drying up.
Another facet of the next few weeks which might rattle a few investors is we are now in the period when directors (insiders) can start taking some money off the table e.g. Kogan.com. However at MM we also keep our eyes open for buying from people in the know, not surprisingly I like the idea of directors backing themselves, we’ve already seen this in Computershare (CPU) and Class Ltd (CL1) of late – investors often follow insiders both in and out of stocks.
MM remains bullish equities medium-term.
ASX200 Index Chart
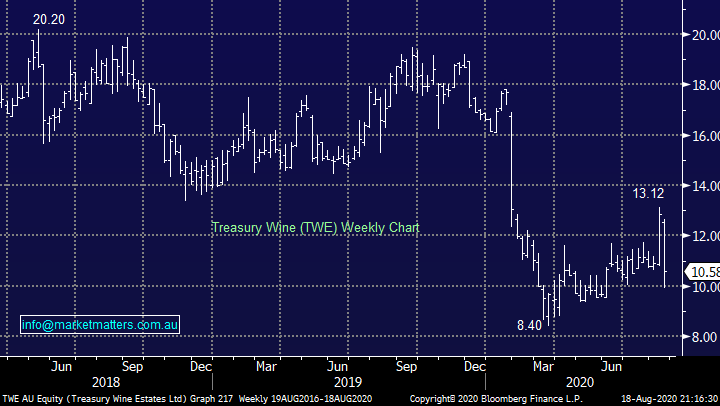
TWE was smacked yesterday following the news that China had commenced an anti-dumping investigation into Australian wine, the investigation will currently look at wine sold in containers holding two litres, or less. Basically the company has found itself in the middle of a game of political football, the Australian government has rattled China’s cage and this is one of the ways they have hit back, we said at the time that MM felt there was no upside to Australia, especially during a pandemic to provoke China and I’m sure everybody exposed to TWE would now agree.
Xi Jinping & Co. are all powerful and controlling of Australia’s largest trading partner and they have demonstrated on many occasion they don’t mind causing some major collateral damage to get their point across - they obviously need our wine a lot less than our raw materials. Chinese consumption is clearly growing at a phenomenal rate, but investors need to consider their steps carefully as evidently not all roads are paved with gold, there may be some more political potholes looming on the horizon.
MM feels TWE has slipped into the “too hard” basket.
Treasury Wine (TWE) Chart
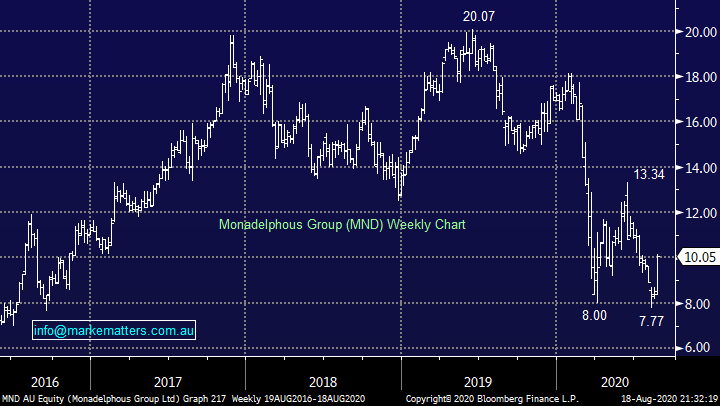
Yesterday we saw Monadelphous (MND) soar almost 19% because its results weren’t too bad, revenue came in at $1.65bn v $1.57bn expected while EBITDA and NPAT were both ahead of forecasts plus they also announced a dividend when the market thought none was likely, declaring 13cps for the full year. We’ve been discussing the mining services “dogs” over recent weeks and the read through here for other mining infrastructure / services relative stocks is very bullish.
We are considering taking profits in one of our resource positions and deploying the monies into a stocks such as MND or averaging 1 or 2 of the holdings discussed in yesterday’s report i.e. migrate from the producer to the support – watch this space.
MM is bullish MND looking for ~30% upside.
Monadelphous (MND) Chart
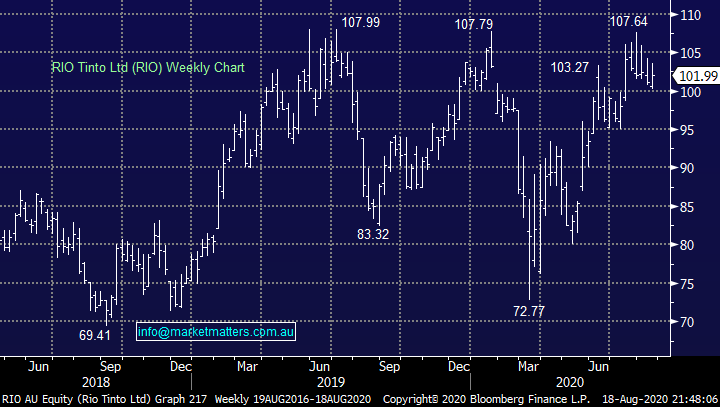
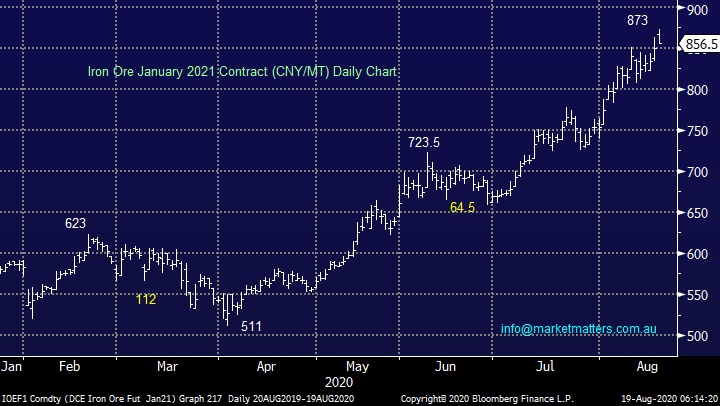
An obvious candidate for the selling is RIO Tinto (RIO) which has enjoyed the phenomenal run in iron ore but even producer BHP in its report yesterday was relatively downbeat on the outlook for the bulk commodity moving forward. Rio this morning has also downgraded their Copper production expectations.
RIO Tinto (RIO) Chart
Iron Ore January 2021 Contract (CNY/MT) Chart
Overseas stocks
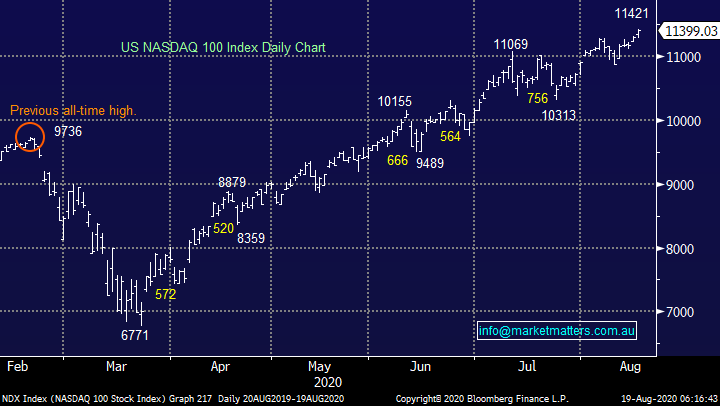
Overnight the S&P500 registered a fresh all-time high, albeit by just 1-point, the strength under the hood was again delivered by the heavyweight tech stocks with Amazon (AMZN US) a standout rallying over 4%. At MM we remain bullish stocks over the next 12-18 months although another small correction in the tech space feels close at hand, we’ve seen one every month since March’s panic low and so far August has been one-way traffic - at this stage we see no reason to expect the markets rhythm to have changed.
MM remains bullish US stocks medium-term but short-term things feel a touch stretched.
US NASDAQ Index Chart
Precious metals enjoyed another session overnight with gold rallying almost $US30 from its intra-day low, further consolidation around the $US2000/0z area would not surprise but we do anticipate a fairly imminent test of fresh 2020 highs. Overall the song remains the same, a small pullback in US bond yields flows through to weakness in the $US and strength from the likes of gold and copper.
MM remains bullish gold & commodities both short & medium-term.
Gold Spot ($US/oz) Chart

MM International Portfolio
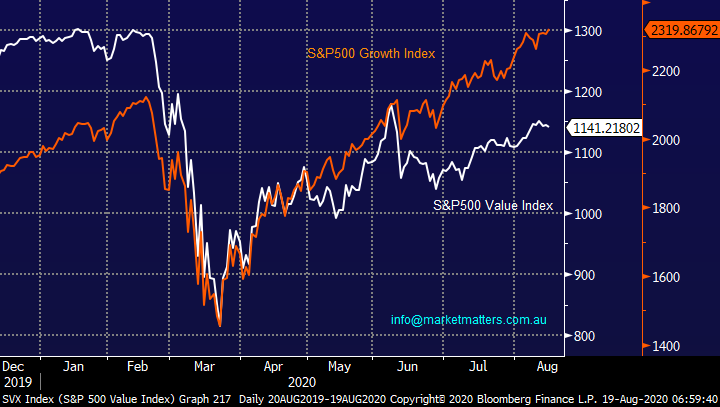
MM continues to hold only 6% of our International Portfolio in cash, in other words we are “very long” global equities which feels correct as many US stocks test all-time highs. However as we anticipate an eventual migration back towards the “Value” end of town we are focusing on an ideal time to tweak our portfolio through taking some profits in some of our IT exposure while simultaneously increasing exposure to the out of favour financials. Please excuse the extended period of banging the same drum but there are 2 parts to this equation – firstly identifying what we plan to do and then secondly identifying the optimum time to execute.
MM International Portfolio : https://www.marketmatters.com.au/new-international-portfolio/
We didn’t transact last week and so far most of the patience has paid off, some portfolio tweaking is anticipated in the next few weeks. At this stage we anticipate pressing the “switch” button when the likes of gold make fresh 2020 highs as the correlations remain fully intact across the board.
S&P500 Value v Growth Indices Chart
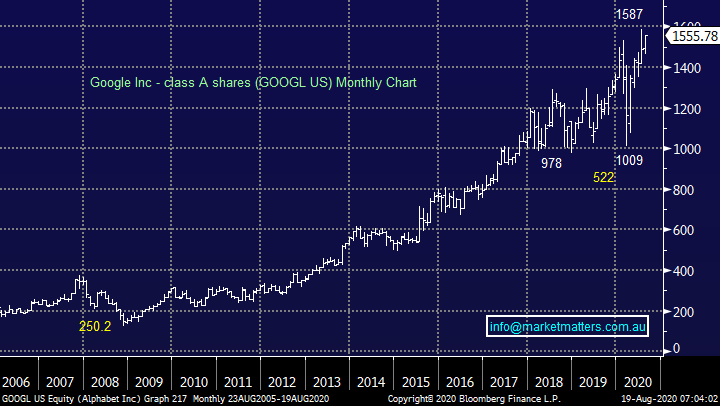
Alphabet (GOOGL US) $US1480
No change, we’ve held back on taking profit on Google, as subscribers know we feel the technology sector is approaching (not arrived) a period of underperformance and probably a reasonable pullback short-term – Google remains our preferred candidate to help us de-risk towards the “hot tech space” and hence by definition we continue to prefer our positions in Apple (AAPL US) and Microsoft (MSFT US) moving into 2021.
MM is considering when to take profit on our position in Google.
Alphabet Inc (GOOGL US) Chart
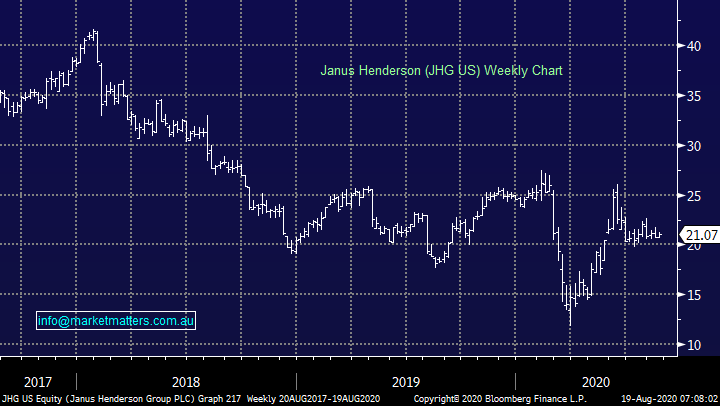
Janus Henderson (JHG US) $US21.07
Similarly, investment manager JHG remains in our sell sights, it has recovered strongly from its 2020 low but after more than doubling since March its started to struggle as outflows continue to disappoint. Hence MM is now neutral the stock technically while there are other, we sectors prefer fundamentally, hence it remains another prime candidate to help us increase cash levels.
MM is neutral JHG at current levels hence cutting the position makes sense.
Janus Henderson (JHG US) Chart
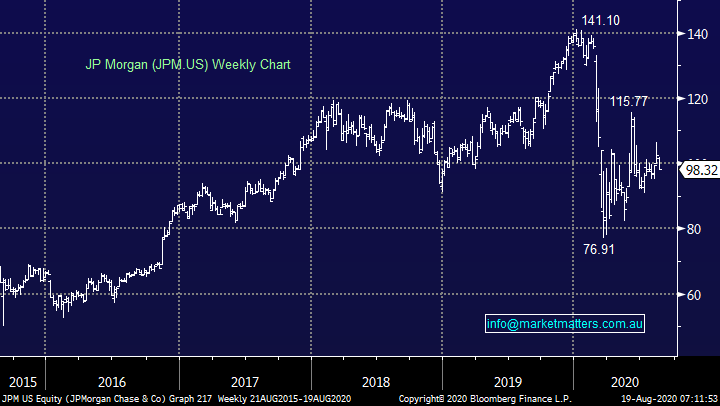
JP Morgan (JPM) $US98.32
Numerous times in 2020 we’ve mentioned how often trends usually unfold for longer and further than most investors expect, and this has proved extremely evident with the banks to the downside, both in Australia and the US. The US banks rally almost in unison with bond yields and vice versa, but the bear market for interest rates has been in pace for decades hence it’s a very tough nut to crack. As we outlined earlier expect the current trend within the intertwined financial markets to evolve further which will send gold towards $US2100 hence there’s no hurry with regard to buying the banks – just yet.
MM is considering adding to our US banking exposure.
JP Morgan (JPM US) Chart
MM Global Macro ETF Portfolio
Last week MM allocated 5% of the portfolio to the ETF Securities Silver Bullion ETF (ETPMAG) taking our Global Macro Portfolios cash position to 19% : https://www.marketmatters.com.au/new-global-portfolio/
After the markets spike and rapid recovery in precious metals we are already looking for areas to take profit on our most recent silver position. Elsewhere with equities appearing ready for a pause on the buy side we are only focused on the agricultural ETF as MM looks to position itself around our bullish commodities outlook.
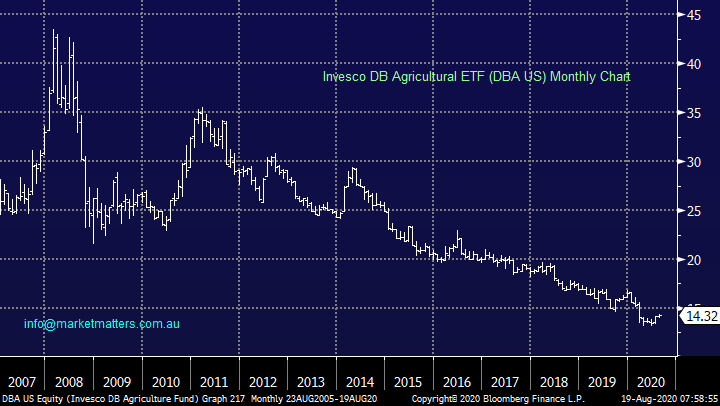
Invesco DB Agricultural ETF (DBA US) $US14.32.
We’ve been patient increasing our position in this agricultural ETF but as our reflation view slowly gathers momentum this now feels an opportune time to increase our exposure from 6% to 10%.
MM likes the DBA ETF at current levels.
Invesco DB Agricultural ETF (DBA US) Chart
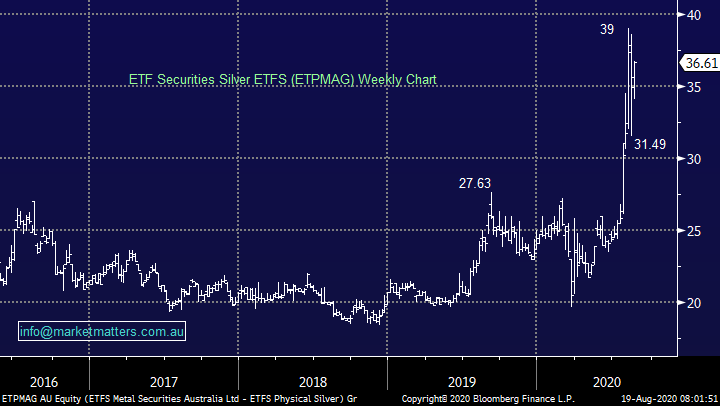
ETF Securities Silver Bullion ETF (EFPMAG) $36.61
Silver lived up to its volatile reputation by plunging over 20% in just a few days before retracing most of the drop almost as fast, we were waiting for the pullback and went long at great levels, we feel a ~20% profit in just a matter of 1-3 weeks is a strong possibility.
MM is looking to take profit on the EFTMAG around the 40 area.
ETF Securities Silver Bullion ETF (ETPMAG) Chart
Conclusions
MM is looking to tweak both of our International & Global Macro Portfolios as outlined above, although short-term we’re probably on hold.
Have a great day!
James & the Market Matters Team
Disclosure
Market Matters may hold stocks mentioned in this report. Subscribers can view a full list of holdings on the website by clicking here. Positions are updated each Friday, or after the session when positions are traded.
Disclaimer
All figures contained from sources believed to be accurate. All prices stated are based on the last close price at the time of writing unless otherwise noted. Market Matters does not make any representation of warranty as to the accuracy of the figures or prices and disclaims any liability resulting from any inaccuracy.
Reports and other documents published on this website and email (‘Reports’) are authored by Market Matters and the reports represent the views of Market Matters. The Market Matters Report is based on technical analysis of companies, commodities and the market in general. Technical analysis focuses on interpreting charts and other data to determine what the market sentiment about a particular financial product is, or will be. Unlike fundamental analysis, it does not involve a detailed review of the company’s financial position.
The Reports contain general, as opposed to personal, advice. That means they are prepared for multiple distributions without consideration of your investment objectives, financial situation and needs (‘Personal Circumstances’). Accordingly, any advice given is not a recommendation that a particular course of action is suitable for you and the advice is therefore not to be acted on as investment advice. You must assess whether or not any advice is appropriate for your Personal Circumstances before making any investment decisions. You can either make this assessment yourself, or if you require a personal recommendation, you can seek the assistance of a financial advisor. Market Matters or its author(s) accepts no responsibility for any losses or damages resulting from decisions made from or because of information within this publication. Investing and trading in financial products are always risky, so you should do your own research before buying or selling a financial product.
The Reports are published by Market Matters in good faith based on the facts known to it at the time of their preparation and do not purport to contain all relevant information with respect to the financial products to which they relate. Although the Reports are based on information obtained from sources believed to be reliable, Market Matters does not make any representation or warranty that they are accurate, complete or up to date and Market Matters accepts no obligation to correct or update the information or opinions in the Reports. Market Matters may publish content sourced from external content providers.
If you rely on a Report, you do so at your own risk. Past performance is not an indication of future performance. Any projections are estimates only and may not be realised in the future. Except to the extent that liability under any law cannot be excluded, Market Matters disclaims liability for all loss or damage arising as a result of any opinion, advice, recommendation, representation or information expressly or impliedly published in or in relation to this report notwithstanding any error or omission including negligence.


