Overseas Wednesday – International Equities & ETF Portfolios (OZL, FMG, WSA, SH US, MCD US, BABA US, NFLX US, EUM US, TMF US)
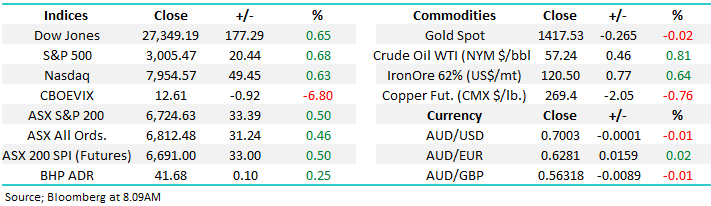
The ASX200 put in another solid performance yesterday finally closing up +0.5%, remarkably now less than 2% below its all-time high posted back in November 2007, just before the GFC hit town. The “winners” again put in a very dominant performance with only 24% of the index closing down while all of the 11 market sectors closed in positive territory, overall there remains bullish broad based buying. It would be a very brave person not to expect a test of the 6852 milestone in the weeks ahead – as we often say don’t fight the tape. Reporting season is only days away and the markets current relatively low volume almost feels like investors are bracing themselves for some decent moves but in what direction they have no idea!
Overnight Boris Johnson became the next UK Prime Minister inheriting the total mess named BREXIT, within an hour of the result the Pound bounced slightly while the UKF FTSE rallied over +0.5% as the uncertainty was removed and this was pretty much how things remained. Boris Johnson’s significant majority should help him finally negotiate a resolution with the EU for this simply embarrassing state of affairs. UK facing Australian stocks look set to bounce ~2% this morning e.g. CYBG Plc (CYB) and Janus Henderson (JHG).
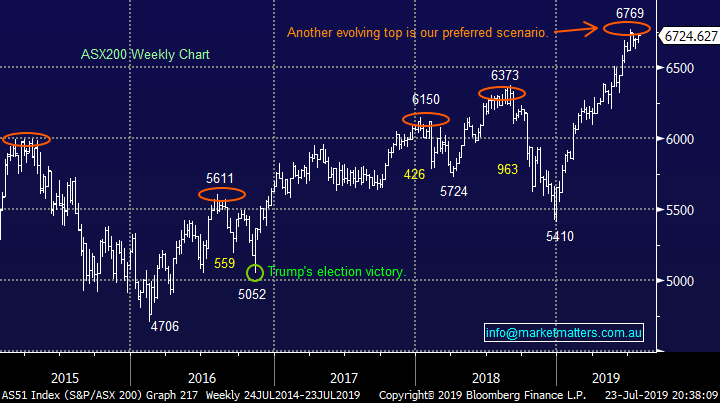
At MM we continue to believe that equities are potentially “looking for a swing high / top” but as we’ve discussed at length this usually takes a number of weeks to evolve. However this doesn’t mean we are running to the hills and piling into cash, a particularly tough call to justify with 3-year bonds trading well under 1%, but a more conservatively skewed portfolio does feel correct to MM as we sail into the volatile reporting season.
MM remains in “sell mode” looking to adopt a more defensive stance than over the previous 6-months.
Overnight US stocks were strong gaining over +0.6%, again knocking on the door of all-time highs supported by a strong start to their earnings season - almost 80% of the 104 companies in the S&P500 that have reported to-date have beat expectations. President Trump also helped the sessions mood as he agreed a budget deal / debt ceiling with congress. Locally the ASX200 is poised to open up ~40-points, knocking on the door of fresh decade highs.
In today’s report we are going to consider positions MM are considering within both our International and ETF Portfolio’s. However firstly I have briefly updated MM’s opinion on the resources sector following OZ Minerals (OZL) positive trading update yesterday.
ASX200 Chart
Over recent weeks we have regularly stated that no sell signals exist for local stocks, hence we have not considered any negative facing ETF’s for our Growth Portfolio, unlike in Q4 of 2018 when we carried bearish positions for both the ASX200 and US S&P500. However a potential “sell trigger” scenario has caught my eye that might interest the bears & / or traders amongst our subscribers.
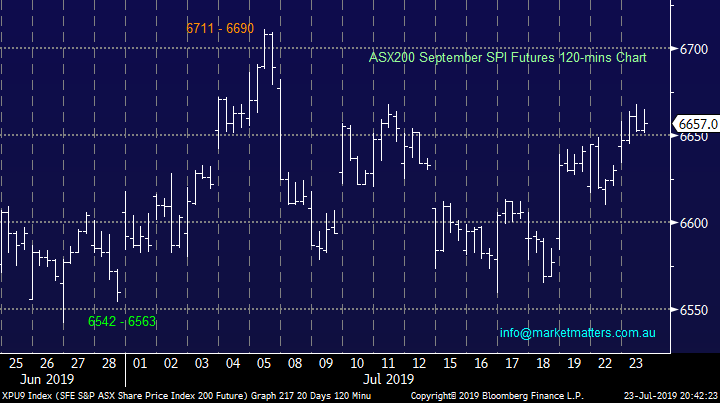
MM will get a technical sell signal if the SPI futures make fresh 2019 highs above 6715 only to fail and then trade back below 6690.
ASX200 September SPI Futures 120-mins Chart
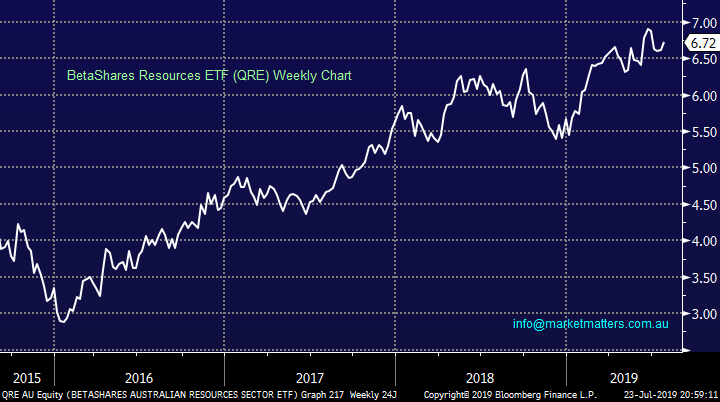
The Australian resources stocks have boomed over the last 3 ½ years with an ETF covering the sector up ~125% over this timeframe, however as we all know the big winners have been the iron stocks with Fortescue (FMG) more than doubling the groups average return.
Importantly this is a sector which carries with it plenty of volatility, even during its multi-year bull run heavyweight BHP Group (BHP) has corrected 21.1% and 15% at different times – statistically it’s easy to argue that at least another 10% correction is likely to unfold in 2019. We like a number of stocks in the sector but on balance we believe there’s a good chance that patience will be rewarded in 2019 for investors like ourselves who are looking for better entry into the sector.
MM likes the resources but another 15-20% correction would not surprise, its simply its usual rhythm.
BetaShares Resources ETF (QRE) Chart
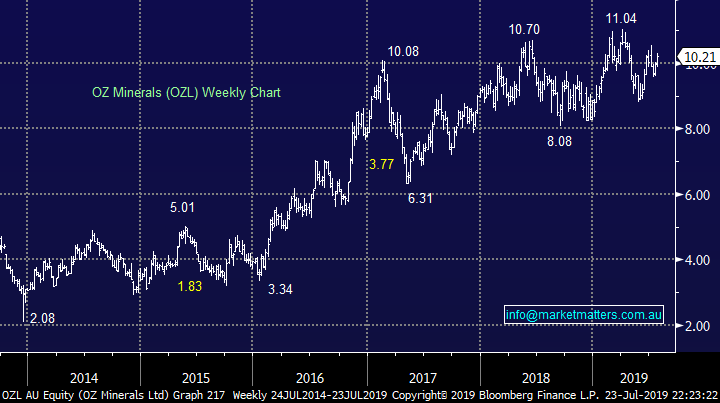
The market previously regarded OZL as a “one trick pony” with a short mine life (~2022) with just one asset, the challenging Prominent Hill. The latest position has improved dramatically with Prominent Hill churning out extraordinary cashflow now out to 2030 (2018 EBITDA ~$600m). The company now has a myriad of growth options that could be delivered across the businesses “province strategy”.
We agree with Peter O’Connor, our highly regarded Resources Analyst at SHAWS, OZL now has a long-term valuation tail that the market hasn’t yet fully grasped, or let alone valued – top line growth could hit ~200% over the 7-year period to 2026/27. Hence making the stock more attractive than both BHP and RIO before we consider the respective companies resources mix .
In the near term copper price fluctuations will whip-saw the OZL share price but long-term the company valuation will grow with future cashflow.
MM is bullish OZL but we are being patient for now.
OZ Minerals (OZL) Chart
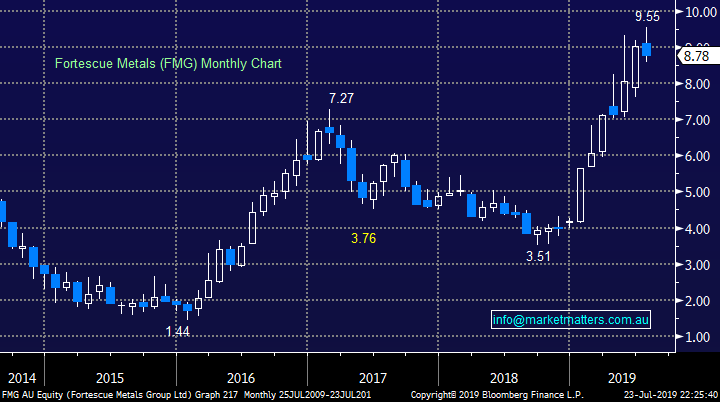
Iron Ore stocks are still our favourite exposure to the resources sector but we continue to believe they are vulnerable to a fairly aggressive pullback in the weeks / months ahead. Fortescue (FMG) has already corrected 10% in the last few weeks and we would not be surprised to see this correction double in magnitude. We currently favour accumulating FMG around $8 and below.
MM likes FMG between $7 and $8.
Fortescue Metals (FMG) Chart
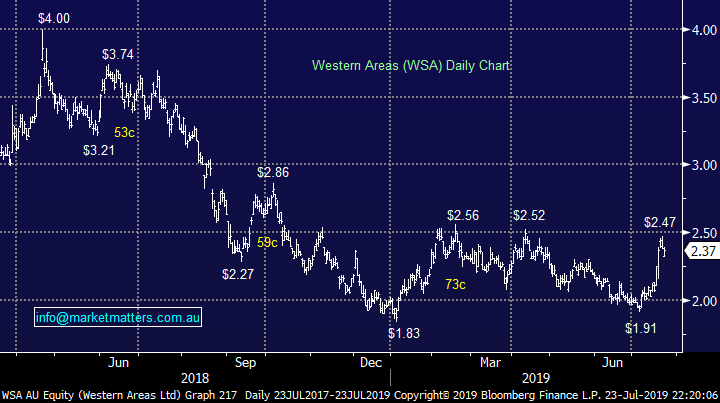
Lastly nickel producer Western Areas (WSA) which we were hoping to buy into fresh multi-year lows below $1.80. While we are not convinced WSA has completed is downtrend the stocks recent 25% surge illustrates perfectly the potential returns for investors who gain optimum entry levels into these volatile stocks.
MM likes WSA as a trading buy at current levels.
Western Areas (WSA) Chart
International Equites Portfolio
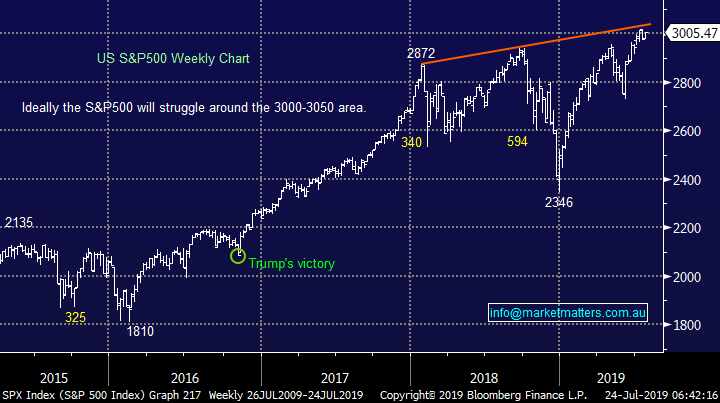
The US S&P500 remains basically at its all-time high as a positive reporting season to-date supports stocks. Our position has not waivered after being bullish since Christmas, we are nervous around what comes next for US stocks as valuations feel stretched but just as we mentioned earlier for Australian stocks no sell signals have evolved although plenty of warning signals are flashing on amber.
MM believes the risk / reward for US stocks is slowly but surely diminishing.
US S&P500 Index Chart
US stocks dominate most investors International Portfolios and they tested all-time highs yesterday but at MM we continue to become increasingly concerned for a number of reasons with the below 2 reasons front and centre:
1 - Investor confidence has finally switched to a bullish stance: https://www.aaii.com/sentimentsurvey
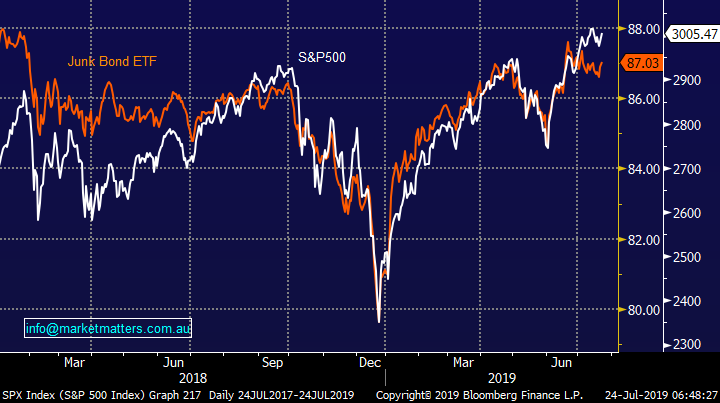
2 – High yielding bonds have continued to struggle even while the S&P500 has pushed to fresh all-time highs, the correlation between these 2 is usually excellent which is illustrated below.
MM remains neutral and cautious both US & international equities at current levels.
US S&P500 Index & Junk Bond ETF Chart
The last week remained fairly quiet with our International Portfolio now holding 6 stocks / positions and 70% in cash, I again reiterate there is no hurry to construct this portfolio : https://www.marketmatters.com.au/new-international-portfolio/
We have not hidden our nervous medium-term outlook for global equities which means if we are correct MM is looking for 1 of 2 things as we evolve this portfolio:
1 – The proverbial needle (s) in a haystack i.e. stocks that can rally even if equities experience another decent pullback e.g. our Barrick gold position (GOLD US).
2 – Quality stocks that will outperform in both bullish and bearish markets which can be hedged with a bearish market ETF (s) when appropriate i.e. produce positive returns even in a falling market.
Today we have touched on 4 positions MM is considering moving forward, note these are not fresh additions to our watch list. At MM we have always dismissed the concept of providing “3 new shares to buy” every week because by definition they cannot all be our favourite stocks in today’s environment!
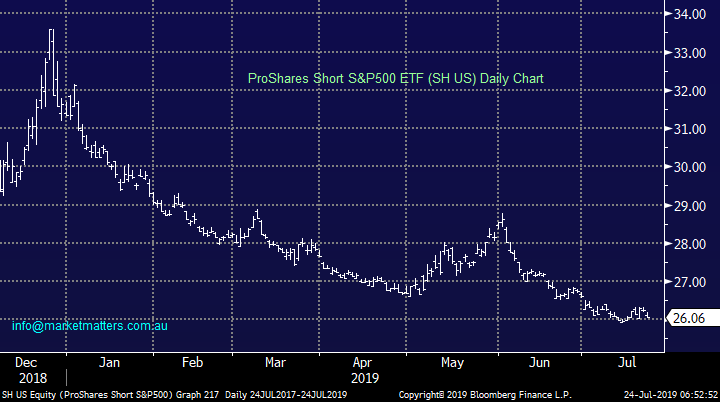
1 ProShares Short S&P500 (SH US).
Following the almost 30% rally by US stocks from the December low equities are looking extended / tired and for the reasons outlined earlier we feel it’s time to consider adding to our negative facing ETF in our International Portfolio - ideally if we see a pop higher towards 3050 by the S&P500 Index.
MM is considering adding to our SH bearish ETF position ~$US25.
ProShares Short S&P500 (SH US) Chart
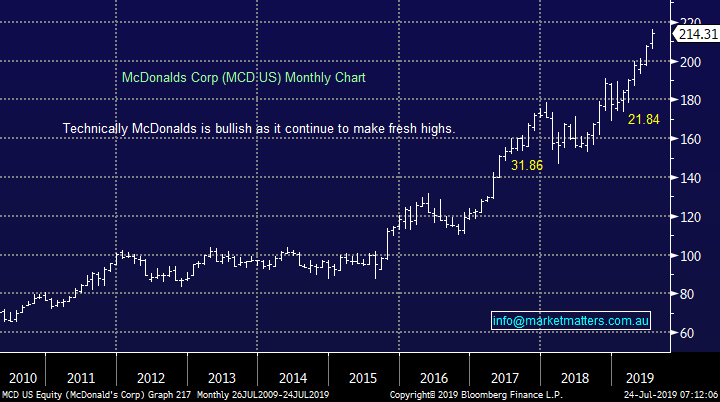
2 McDonalds (MCD US) $US214.31
No change with this one, McDonalds has been a leading force in fast food for decades, and it's worked hard to update its image while keeping up with changing times e.g. McCafé.
MCD's current valuation, like much of the market, is relatively rich on a historical basis for the fast-food giant. However MCD is a dividend investor favourite in the US yielding ~2.5%, with the company having recently celebrated its 42nd consecutive annual dividend hike – US investors are more easily please when it comes to yield! In addition to paying dividends, the business has also made stock buybacks, returning even more capital to its shareholders.
For McDonald's, growth plans are clear, they understand the need to keep up with the pace of innovation in serving customers the way they want to be served, and that involves integrating new technology.
MM is bullish MCD, especially on a relative basis.
McDonalds (MCD US) Chart
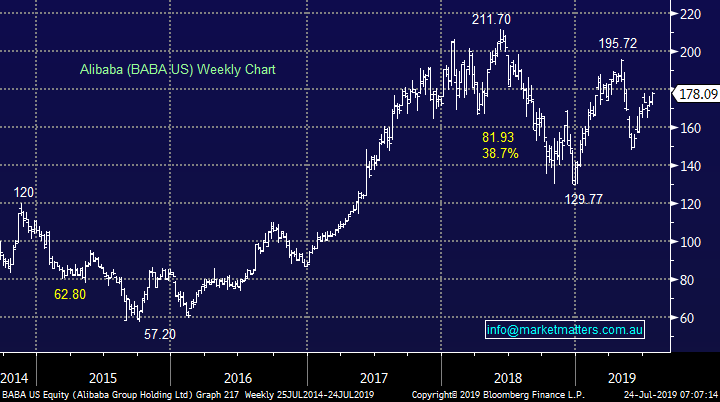
3 Alibaba (BABA US) $S178.09
No change, with an amazing 2 out of every 5 people in China are not yet on-line although with a population approaching 1.4bn that’s still a large market for online retailer / e-commerce business Alibaba (BABA) but one that’s still got enormous growth potential. The concerns around a US-China trade war, either now or in the future, has certainly put pressure on China facing stocks / indices but with that comes opportunity.
MM likes BABA around current levels.
Alibaba (BABA US) Chart
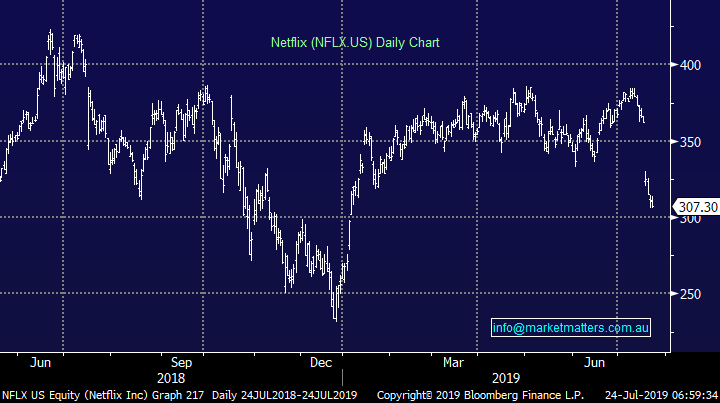
4 Netflix (NFLX) $US307.30
There’s a saying in the markets that “your first loss is your best loss” and it certainly feels appropriate to MM this morning with regards to Netflix following the companies disappointing result last week. However we have to look forward and not back, the quandary is simple we want to exit NFLX after a weak update but what’s the best price we can achieve as the stocks downside momentum slows. In the case we have opted for a sell target accompanied with a stop:
MM will sell its NFLX either at $US315 or on stop below $US300.
MM is looking to exit NFLX.
Netflix (NFLX US) Chart
Conclusion (s)
Of the 3 stocks and one ETF looked at today for the International Portfolio we are comfortable with the idea that MCD and BABA will outperform the US market if / when we do see equities experience a correction.
Also alas NFLX looks destined to exit our International Portfolio in the weeks ahead but if we deal with the losers the winners will look after themselves.
*watch for alerts in today’s PM report.
MM ETF Portfolio
MM is still holding 3 positions in the portfolio - simply put we are long gold, long the $A and short US stocks while still holding 80% in cash: https://www.marketmatters.com.au/new-global-portfolio/
We continue to believe there are a couple of great “plays” evolving in today’s market but I reiterate major macro views don’t change too often, I have updated the 2 positions we are considering today, again nothing particularly new here:
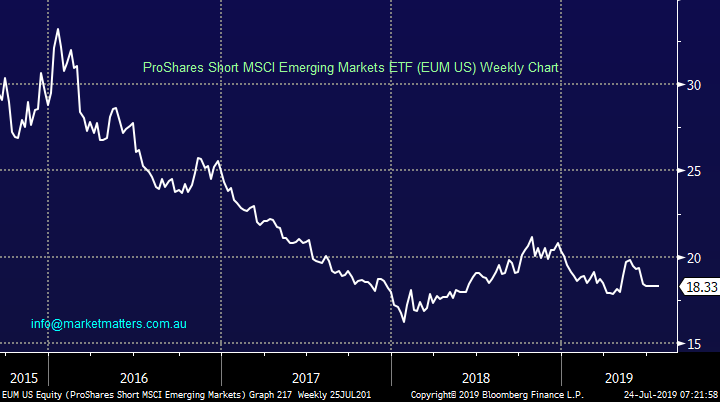
1 Emerging Markets.
We are currently short US stocks but only with a deliberate 5% allocation thus allowing us to either average or take a short position in another equities space e.g. the Emerging Markets which are already in a downtrend.
MM is bearish the Emerging Markets considering taking a position accordingly. Our preferred vehicle is the ProShares Emerging Markets Short MSCI ETF (EUM US). Details of this ETF are explained on this link : https://www.proshares.com/funds/eum.html
ProShares Short MSCI Emerging Markets ETF (EUM) Chart
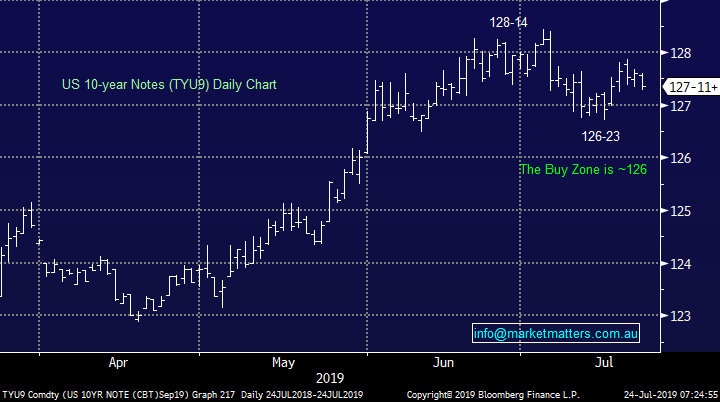
2 US Interest Rates
Markets continue to be driven by global bond yields making it logical to be considering these as an investment vehicle for the MM ETF Portfolio, after all we are watching them like a hawk. We feel rates are currently stabilising / bouncing before a probable another look lower hence this can be “played” by buying bonds into the current correction, because this is a relatively short-term outlook a leveraged position is required.
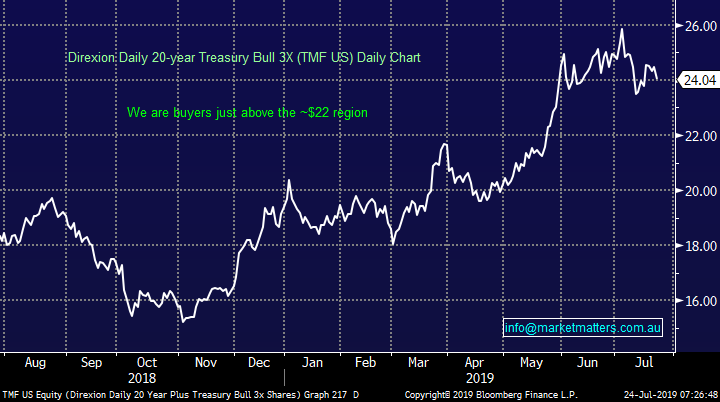
The ETF we initially like to play this view is the Direxion Daily 20-year Treasury Bill 3x ETF (TMF US) : https://www.direxioninvestments.com/products/direxion-daily-20-year-treasury-bull-3x-etf
MM now likes the underlying US 10-year Notes just above the 126 area.
US 10-year Notes (September) Chart
The TMF is drifting down to our buy zone as we look for a “pop” higher of 10-15%.
MM is bullish the TMF at current levels.
Direxion Daily 20-year Treasury Bill 3x ETF Chart
Conclusion (s)
MM is bullish both the ProShares Emerging Markets Short MSCI ETF (EUM US) and the ProShares (SH US) ETF which we are considering adding to.
Also The TMF is approaching our short-term buy zone as we look for a “pop” higher of 15-20%.
Overnight Market Matters Wrap
· The US equity markets closed higher overnight across all major indices following stronger than expected quarterly earnings at present, and reports of the US-China trade talks expected to resume.
· Across the European region, UBS helped Germany’s DAX to rally 1.64% higher, after exceeding earnings expectations, while the UK also closed 0.6% higher as Boris Johnston was confirmed to be the new Prime Minister, vowing to exit EU by the 31 October deadline, with or without a deal.
· The September SPI Futures is indicating the ASX 200 to open 37 points higher towards the 6765 level this morning.
Have a great day!
James & the Market Matters Team
Disclosure
Market Matters may hold stocks mentioned in this report. Subscribers can view a full list of holdings on the website by clicking here. Positions are updated each Friday, or after the session when positions are traded.
Disclaimer
All figures contained from sources believed to be accurate. Market Matters does not make any representation of warranty as to the accuracy of the figures and disclaims any liability resulting from any inaccuracy. Prices as at 24/07/2019
Reports and other documents published on this website and email (‘Reports’) are authored by Market Matters and the reports represent the views of Market Matters. The MarketMatters Report is based on technical analysis of companies, commodities and the market in general. Technical analysis focuses on interpreting charts and other data to determine what the market sentiment about a particular financial product is, or will be. Unlike fundamental analysis, it does not involve a detailed review of the company’s financial position.
The Reports contain general, as opposed to personal, advice. That means they are prepared for multiple distributions without consideration of your investment objectives, financial situation and needs (‘Personal Circumstances’). Accordingly, any advice given is not a recommendation that a particular course of action is suitable for you and the advice is therefore not to be acted on as investment advice. You must assess whether or not any advice is appropriate for your Personal Circumstances before making any investment decisions. You can either make this assessment yourself, or if you require a personal recommendation, you can seek the assistance of a financial advisor. Market Matters or its author(s) accepts no responsibility for any losses or damages resulting from decisions made from or because of information within this publication. Investing and trading in financial products are always risky, so you should do your own research before buying or selling a financial product.
The Reports are published by Market Matters in good faith based on the facts known to it at the time of their preparation and do not purport to contain all relevant information with respect to the financial products to which they relate. Although the Reports are based on information obtained from sources believed to be reliable, Market Matters does not make any representation or warranty that they are accurate, complete or up to date and Market Matters accepts no obligation to correct or update the information or opinions in the Reports. Market Matters may publish content sourced from external content providers.
If you rely on a Report, you do so at your own risk. Past performance is not an indication of future performance. Any projections are estimates only and may not be realised in the future. Except to the extent that liability under any law cannot be excluded, Market Matters disclaims liability for all loss or damage arising as a result of any opinion, advice, recommendation, representation or information expressly or impliedly published in or in relation to this report notwithstanding any error or omission including negligence.


