Overseas Wednesday – International Equities & ETF Portfolios (GDX US, TTD US, OZL, IEM US, 700 HK, TBF US)
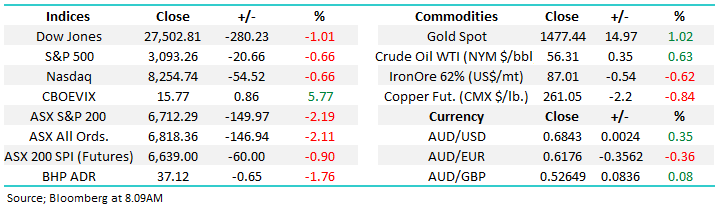
The ASX200 came down to earth with a bang yesterday falling -2.2%, more than double the decline in the US, a sea of red crossed our screens with buyers appearing to take an early Christmas break. Although the decline unfolded in an orderly manner the losses kept growing throughout the day as President Trumps trade move against Brazil and Argentina appeared to break the back of our index, within days of the index posting a fresh all-time high – we feel the decline was magnified because global equities had been pricing in a successful resolution on US – China trade.
The selling was aggressive through the SPI futures where the day’s volume basically doubled the average in November, the arbitrage selling flowed through the index dragging well over 90% of the ASX200 into the red. All sectors closed down on the day as could be expected but surprisingly resources were the best of a bad bunch implying the market was aggressively taking profits on stocks that have ran hard in 2019 as opposed to panicking around a trade war inspired global recession.
Already the AFR is saying that Trumps new trade battle had dashed the hopes of a Santa rally, clearly, they didn’t read our report yesterday! However I won’t trivialise Trumps actions, they are very scary on a number of levels, he appears to have decided aggression will win him votes next November, he’s even threatening France with $3.5bn of tariffs which would be the first step in a US - Europe trade war. Overnight the President said he might hit NATO members who aren’t spending enough on defence with tariffs plus he said “there was no deadline” for reaching a trade resolution with China – wow how many people can he upset in 24-hours!
MM is looking to increase stock market exposure into weakness towards the end of next week.
Overnight US stocks were again weak with the S&P500 closing down -0.7% although it did bounce in the later afternoon, the SPI futures are pointing to a drop of 1% by local stocks early this morning.
Today we’ve focused on the current market volatility, and most importantly how MM intends to invest into this Trump induced weakness.
ASX200 Chart
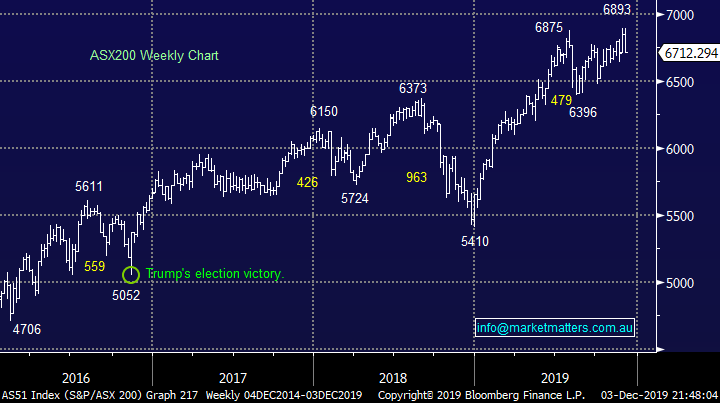
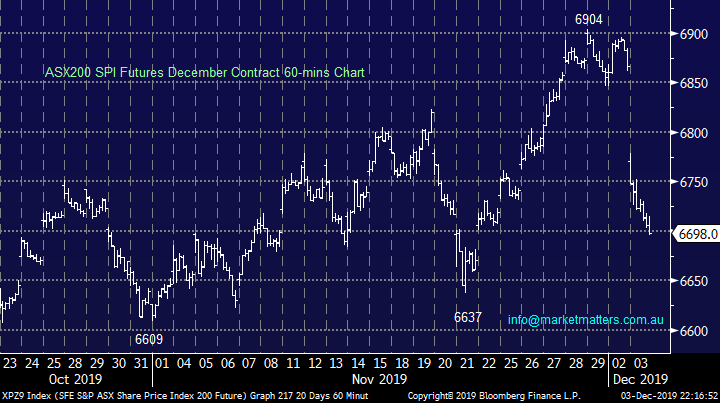
The first level of major short-term support for local stocks comes in around 6600 – 6650 for SPI Futures, an area which looks destined to be tested this morning following further declines by global markets – a 50 to 100-point bounce would not surprise from this region. However we’re looking for a couple of pieces of the puzzle to come together before we press the buy button, as discussed in yesterday’s report : https://www.marketmatters.com.au/blog/post/-the-santa-claus-rally-truth-or-myth-cpu-rwc-svw/
Today’s fall certainly satisfies our retracement target in terms of points but at this stage we can see weakness into the classic seasonal mid-December buying opportunity.
Hence at this stage I would describe ourselves as patient buyers.
ASX200 SPI Futures Chart
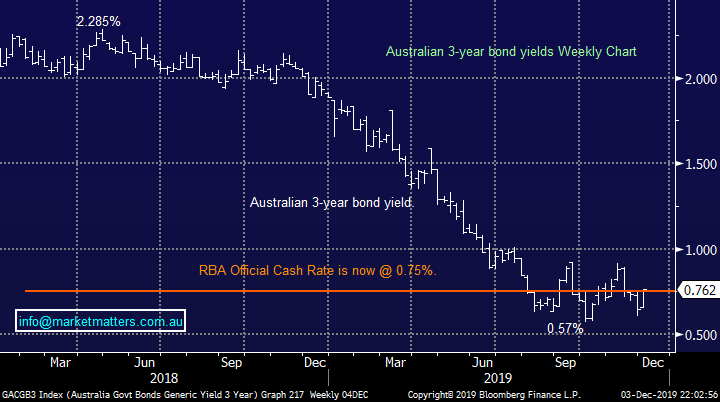
Local Bond yields listen to the RBA, not stocks.
Yesterday the Australian bond market danced the RBA tune as opposed to that of a plunging equity market, the local central bank certainly threw a spanner in the works of some investors thought process:
1 – The RBA talked up the strength of the Australian economy, certainly true with regards to housing prices.
2 – They actually talked up inflation into 2020 / 2021 plus stating that risks to the global economy “have lessened recently”, obviously before Trumps latest outbursts.
MM believes local bond yields are very close or may even have seen a low.
Overall this is no change to our view for 2020 / 2021 hence MM believes the “bond proxies” will underperform moving forward as their decade old tailwind is removed.
Australian 3-year Bond Yields Chart
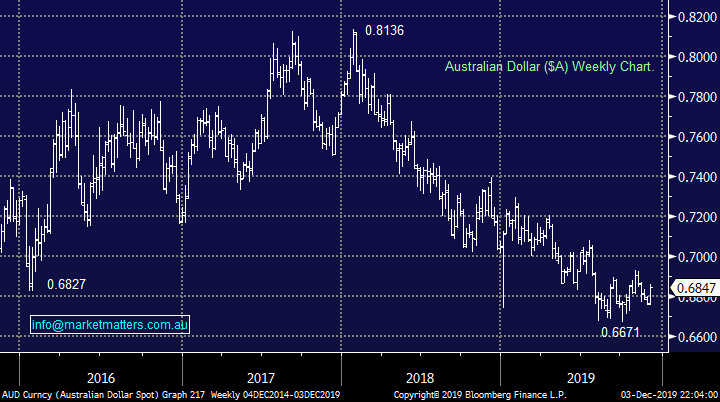
The $A rallied on the RBA’s comments which appeared to play a large part in yesterday’s aggressive decline by the ASX200 – over the past few weeks we have identified / covered the intra-day inverse correlation between the $A and local stocks.
As subscribers know one of our core views moving forward is the $A will head back towards the 80c region, a very contrarian outlook. If we are correct the US earners will see a strong tailwind reverse into a headwind in relatively quick fashion. Hence MM is very wary the classic offshore earners who have significantly outperformed in recent years.
MM is bullish the $A into 2020.
Australian Dollar ($A) Chart
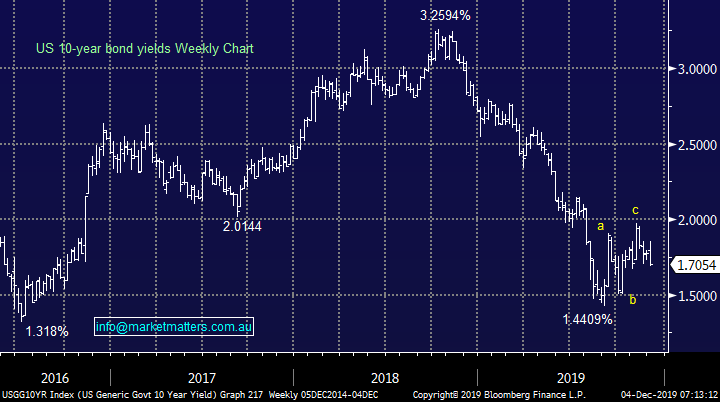
US Bond yields do follow equities
Overnight as we saw stocks tumble courtesy of the extremely unpredictable almost bully like US President, money flowed into the safety of bonds which subsequently drove yields lower. Importantly the market is following the ideal path for MM, if we see bond yields make new lows as equities decline over the next 1-2 weeks subscribers should expect us to aggressively position ourselves, across all portfolios, for a major interest rate reversal into January.
If we see bond yields make another low MM believes it’s an ideal opportunity to increase further our cyclical overgrowth / defensive stance.
US 10-year bond yield Chart
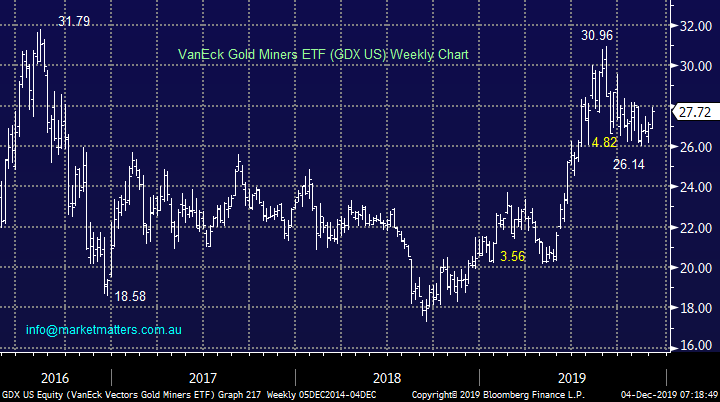
Gold is waking from its slumber
The flight to safety extended from bonds to gold which rallied over $US15/oz last night helping gold ETF’s to enjoy a ~2% pop higher.
MM is planning to sell our disappointing Evolution (EVN) and Newcrest (NCM) positions into an anticipated bounce.
VanEck Gold Miners ETF (GDX) Chart
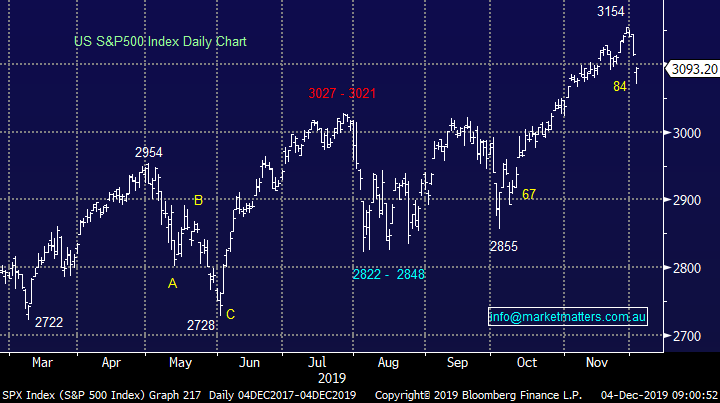
Stocks are rapidly becoming interesting.
US stocks have quickly endured a Trump inspired 2.6% correction, pretty meaningless in the scheme of things but more volatility than we’ve become accustomed to over recent months. At this stage we are trying to identify an excellent risk / reward opportunity to increase our exposure to equities both locally and abroad, but patience feels right at least for a little while longer.
MM is looking for a buy trigger for US stocks.
US S&P500 Chart
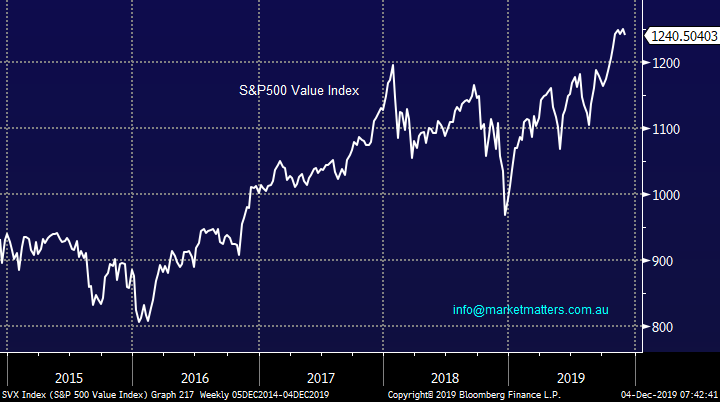
As the chart below illustrates the S&P500 Value Index has hardly deviated from its upward path.
MM remains bullish the S&P500 Value Index and hence banks and resource stocks.
S&P500 Value Index Chart
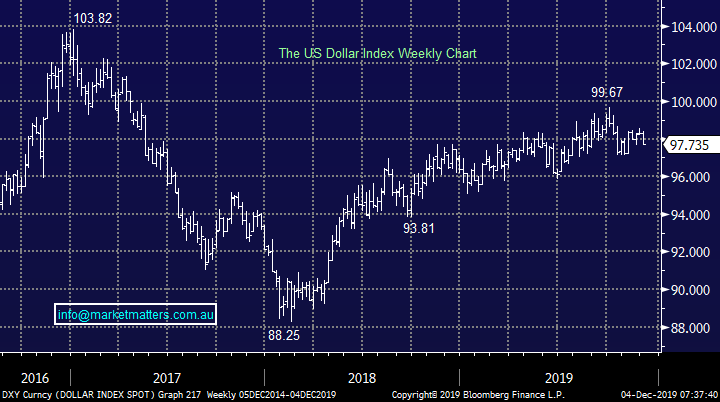
The $US looks vulnerable
President Trump has continued his unabated attack on the Fed’s policy around interest rates this week, amongst other things of course - technically we see the $US initially another 2-3% lower.
“Lower Rates & Loosen – Fed” – President Trump overnight.
MM is bearish the $US which is by definition bullish the metals / miners & $A.
The $US Index Chart
International Equites Portfolio
Last week there were no changes to our International Portfolio with our cash position remaining at 37% plus we have 8% exposure to a negative facing ETF which has enjoyed the last few days. : https://www.marketmatters.com.au/new-international-portfolio/
While there remains a number of stocks / sectors where we would like to increase our exposure for the MM International Portfolio the possibility of a move lower by bond yields had left us twiddling our thumbs but now things are unfolding we are now poised and ready to start buying.
*Watch for alerts in afternoon notes*
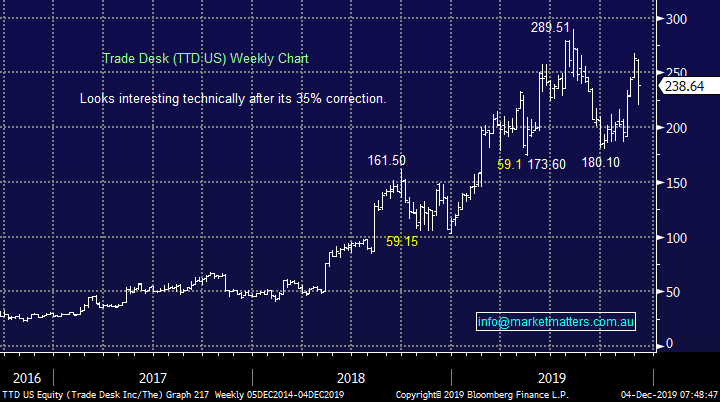
One specific stock MM has discussed in 2019 is advertising technology company Trade Desk (TTD US) which was sold aggressively the prior day (off ~13%) on the downgrade of a competitor. While TTD is a high growth business, trading on a huge valuation, this is a stock we believe should run its own course, simply because of the transition of online marketing spend and the ability of their platform to direct advertising dollars.
Last night the stock rallied 4.45% in a market that was down - a great sign.
MM is bullish Trade Desk (TTD US).
Trade Desk (TTD US) Chart
Resources
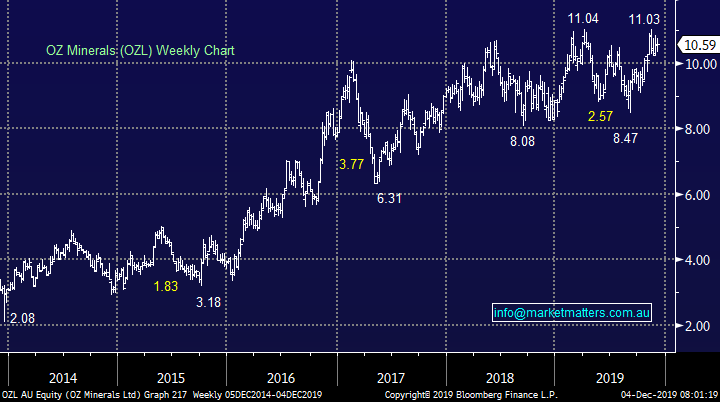
As subscribers know we like resources into 2020 and it still feels like a classic case of “keep it simple stupid” (KISS) we are very keen on OZ Minerals (OZL) which we hold in the Growth Portfolio, it’s currently our favourite addition to the International Portfolio – remember Australian stocks can be in an International Portfolio.
MM is bullish OZL and likes it for our International Portfolio.
OZ Minerals (OZL) Chart
Emerging Markets
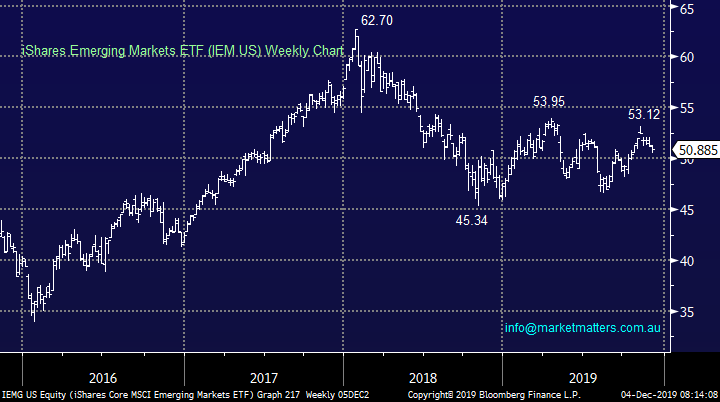
MM continues to like the Emerging Markets moving into 2020, a view strongly supported by our bearish $US view but one that has been under pressure due to ongoing trade war concerns and social unrest in Hong Kong.
Currently our preferred ways to play this view are adding to our Samsung (005930 KS) and Ping An (2318 HK) positions plus internet and e-commerce goliath Tencent (700 HK).
Emerging Markets ETF (IEM US) Chart
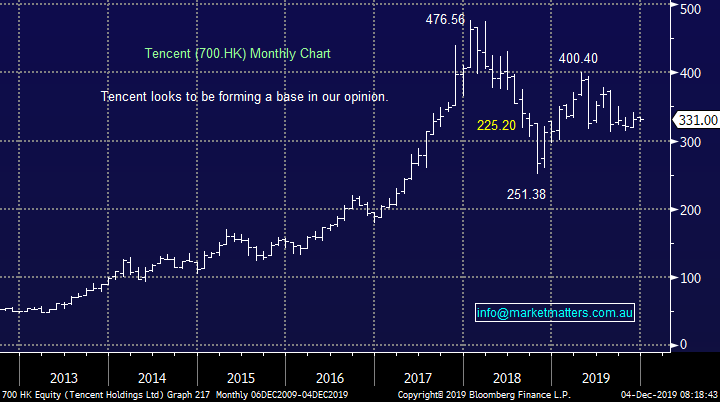
On-line goliath Tencent has struggled in 2018 / 19 but we like the way its holding current levels even as shares in the region struggle.
Tencent (700 HK) Chart
Conclusion (s)
MM likes the resources, banks and emerging markets into 2020, we expect to significantly increase our exposure to some of these areas as bond yields follow our anticipated path.
We specifically like Tencent (700 HK) and Trade Desk (TTD US) at current levels - we are likely to add both. Tencent trades in Hong Kong while Trade Desk is listed in the US.
MM Global Macro ETF Portfolio
Last week we held steady in the MM Global Macro Portfolio leaving our cash level at 51.5% as we continue to watch bond yields closely. : https://www.marketmatters.com.au/new-global-portfolio/.
We have one important view unfolding as anticipated this week i.e. bond yields are headed down towards fresh lows, this will lead to some significant position changes in our MM Macro ETF Portfolio:
1 - Our ProShares short S&P500 ETF (SH US) is likely to be reversed to a bullish ETF, probably to the 2x leverage ProShares (SSO US).
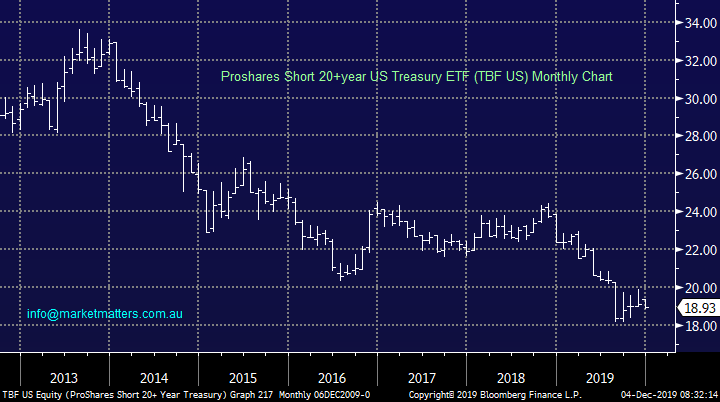
2 – MM is looking to go long the bearish US bond ETF (TBF US) into new lows.
3 – We are looking to cut our silver and gold positions into strength and increase our copper exposure.
4 – We are looking to increase our Emerging Markets ETF (IEM)
ProShares Short US Bond ETF (TBF US)
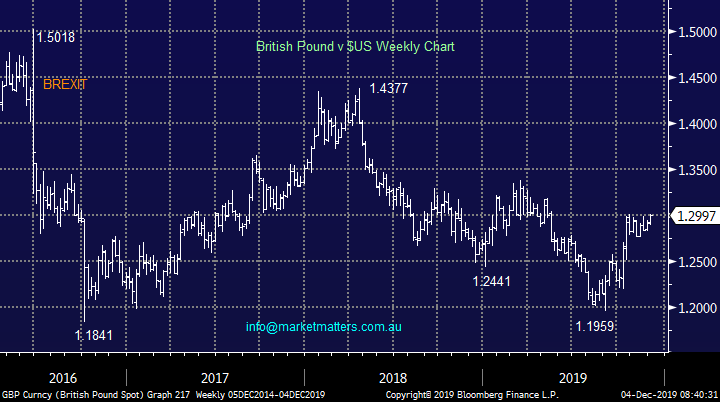
5 - Lastly we still hold our macro view around BREXIT and the UK election we have been a bit slow pulling the Buy Pound trigger but we still believe the GBP is close to popping higher.
Our preferred ETF to invest in the Pound remains the Invesco ETF: https://www.invesco.com/portal/site/us/investors/etfs/product-detail?productId=FXB
British Pound v $US Chart
Conclusion (s)
We are likely to implement these 5 ideas / plans moving forward, the time to be busy is nigh!
Watch the pm reports for alerts.
Overnight Market Matters Wrap
- A global economy relief is starting to fade in front of investors as US Trump administration had indicated its plans to move forward with its tariffs on Chinese goods should no deal be made with China by mid this year along with tariffs to Europe and South America.
- US equity markets traded down, while treasuries spiked along with ‘safe haven’ assets such as gold up 1.02% at present.
- On the commodities front, crude oil rallied ahead of the OPEC meeting where speculations expect a deeper supply cut by some of the biggest producers.
- BHP is expected to underperform the broader market after ending its US session off an equivalent of -1.76% from Australia’s previous close.
- The December SPI Futures is indicating the ASX 200 to open 75 points lower, towards the 6637 level this morning.
Have a great day!
James & the Market Matters Team
Disclosure
Market Matters may hold stocks mentioned in this report. Subscribers can view a full list of holdings on the website by clicking here. Positions are updated each Friday, or after the session when positions are traded.
Disclaimer
All figures contained from sources believed to be accurate. All prices stated are based on the last close price at the time of writing unless otherwise noted. Market Matters does not make any representation of warranty as to the accuracy of the figures or prices and disclaims any liability resulting from any inaccuracy.
Reports and other documents published on this website and email (‘Reports’) are authored by Market Matters and the reports represent the views of Market Matters. The Market Matters Report is based on technical analysis of companies, commodities and the market in general. Technical analysis focuses on interpreting charts and other data to determine what the market sentiment about a particular financial product is or will be. Unlike fundamental analysis, it does not involve a detailed review of the company’s financial position.
The Reports contain general, as opposed to personal, advice. That means they are prepared for multiple distributions without consideration of your investment objectives, financial situation and needs (‘Personal Circumstances’). Accordingly, any advice given is not a recommendation that a particular course of action is suitable for you and the advice is therefore not to be acted on as investment advice. You must assess whether or not any advice is appropriate for your Personal Circumstances before making any investment decisions. You can either make this assessment yourself, or if you require a personal recommendation, you can seek the assistance of a financial advisor. Market Matters or its author(s) accepts no responsibility for any losses or damages resulting from decisions made from or because of information within this publication. Investing and trading in financial products are always risky, so you should do your own research before buying or selling a financial product.
The Reports are published by Market Matters in good faith based on the facts known to it at the time of their preparation and do not purport to contain all relevant information with respect to the financial products to which they relate. Although the Reports are based on information obtained from sources believed to be reliable, Market Matters does not make any representation or warranty that they are accurate, complete or up to date and Market Matters accepts no obligation to correct or update the information or opinions in the Reports. Market Matters may publish content sourced from external content providers.
If you rely on a Report, you do so at your own risk. Past performance is not an indication of future performance. Any projections are estimates only and may not be realised in the future. Except to the extent that liability under any law cannot be excluded, Market Matters disclaims liability for all loss or damage arising as a result of any opinion, advice, recommendation, representation or information expressly or impliedly published in or in relation to this report notwithstanding any error or omission including negligence.


