Overseas Wednesday – International Equities & ETF Portfolios (GDX US, NCM, BABA US, TTD US, PSH NA, BAC US, RY CN)
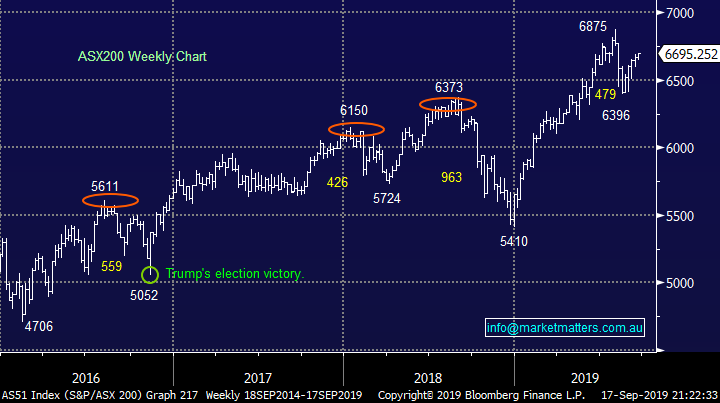
The ASX200 again shook off some early initial weakness yesterday caused by a -0.5% fall on Wall Street and the huge $1.3bn placement in Ramsay Healthcare (RHC). Overall it was a fairly lacklustre session with none of the ASX200 rallying / falling by more than 5%, it feels to us that “the shorts” are slowly being squeezed into this Thursdays futures & options expiry for September, if we are going to see some weakness this month in our opinion its likely to unfold after 10.30am on Thursday. On the stock / sector level we continue to dance to the bond tune as a marginal decline in bond yields on Monday night led to a rally in the likes of Healthcare, Real Estate, Transport and Utilities i.e. many of the areas that have enjoyed declining interest rates in 2019.
The recent rotation into cyclicals has been one of the most aggressive of the last decade, as stocks took their lead from the bounce in bond yields. At this stage we can only confidently label it as a position squeeze, as opposed to a change in trend. However we have to be open-minded and the strong momentum of the move has us adopting a 50-50 opinion that the we will see continued money flow from growth to cyclicals – MM is already largely positioned for this rotation hence no significant changes required across our portfolios.
Domestically we saw the market catch a clear bid tone after the RBA’s minutes at 11.30 am which mentioned the anticipation of an extended period of low interest rates plus continued improvement for housing prices - a positive double whammy for stocks. “Interest rates lower for longer” has helped fuel the longest bull market in stock market history, although as mentioned above investors look to have started positioning themselves for a bottoming process in yields. While we still believe interest rates are in a very mature bear market, central banks have been hammering their dovish drum this month, more rate cuts / QE feels likely before the nadir for the cycle is reached, at least for official rates.
MM currently remains comfortable holding higher cash levels than during the first 6-months of 2019.
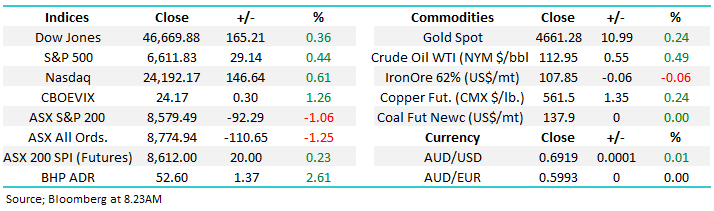
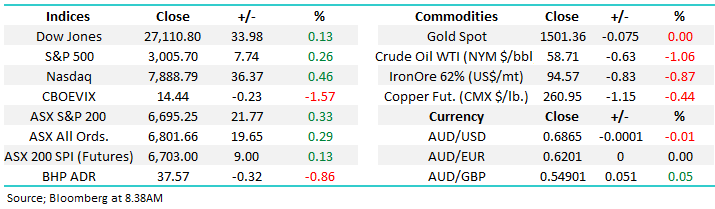
Overnight US stocks closed marginally higher with the US S&P500 gaining +0.25%, only the Energy sector showed any meaningful weakness. Locally the SPI futures are calling the ASX200 to open up around 10-points.
In today’s report as usual we are going to look at our International Equities and Global ETF Portfolio’s.
ASX200 Chart
Bond yields remain the key
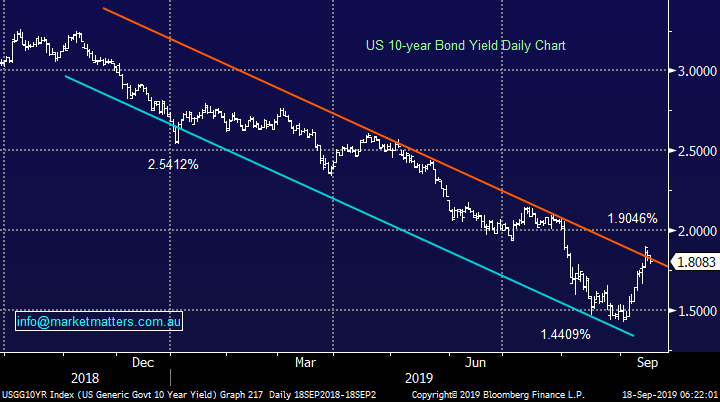
Bond yields and especially the US 10-year’s are currently having a larger influence on equities than usual as we’ve seen a sharp 2-week countertrend bounce lead to massive sector rotation. The bounce is definitely not a sign of a change in trend just yet but it is the largest we’ve witnessed so far in 2019.
At this stage we continue to believe the US 10-years have started to “look for a low” but ongoing choppy price action back towards 1.5% would not surprise. A correction in stocks would more than likely see the safety of bonds again enjoy a strong bid tone potentially sending yields back towards, or below 1.5%.
MM believes the bear market for bond yields is very mature but new lows would not surprise.
We believe the risk / reward favours the cyclicals into any pullback towards 1.5% for the US 10-year bond yield, MM is likely to invest accordingly.
US 10-year bond yields Chart
Where to now for Golds?
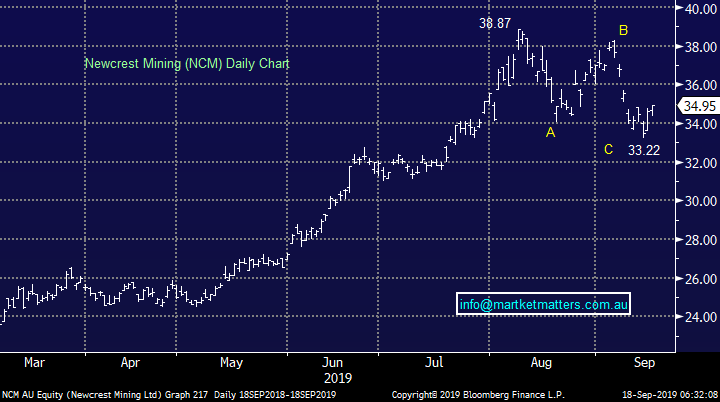
MM has used the recent weakness in the gold sector to buy Evolution Mining (EVN) and Newcrest Mining (NCM) – note we currently anticipate holding these stocks for weeks, not months.
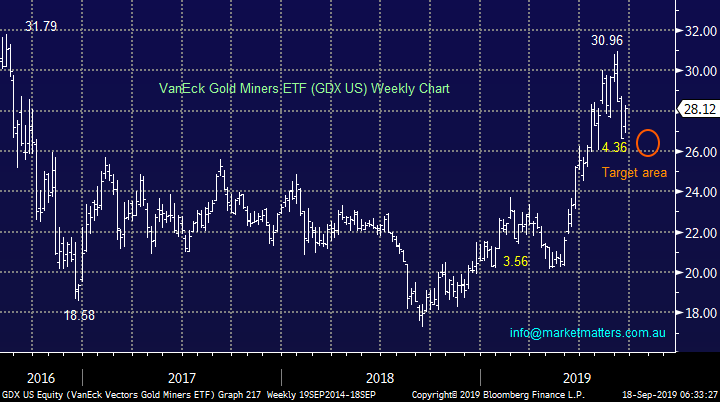
The inverse correlation between the gold sector and bond yields implies that for MM to be correct, and the gold sector to stage a rally from here, bond yields must stop bouncing, and preferably fall. Overnight US 10-years slipped only -0.0402% which enabled the US based Gold Miners ETF (GDX US) to gain a solid +3%.
MM likes the gold sector targeting ~15% upside in the short term.
VanEck Gold Miners ETF (GDX AU) Chart
Newcrest Mining (NCM) Chart
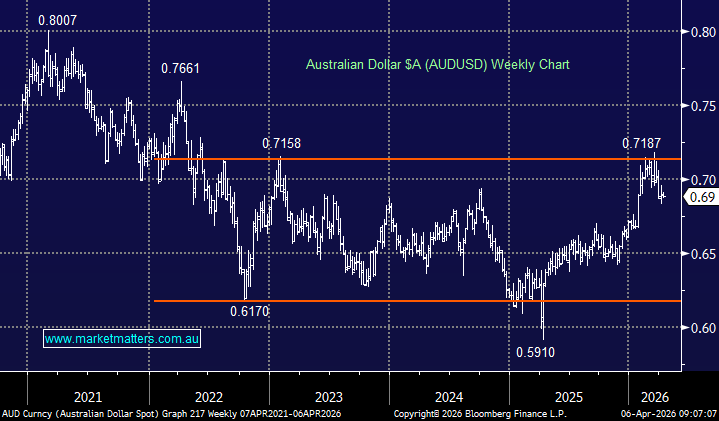
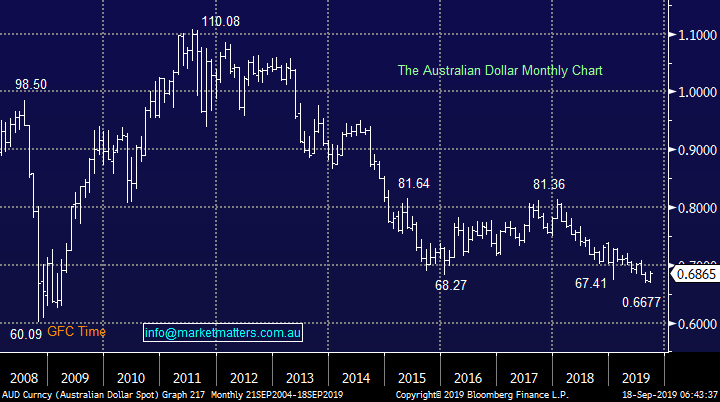
Lastly again looking at the Aussie dollar which continues to hold firm in the 67-69c region. Our medium-term bullish outlook for the $A is by default positive the likes of base & industrial metals i.e. the cyclicals. Hence don’t be surprised to see us go long our preferred resources play (s) in the weeks ahead, especially if we see another pullback in the sector e.g. MM likes both Oz Minerals (OZL) and Western Areas (WSA).
MM believes the $A is looking for / has reached a major point of inflection.
Australian Dollar Chart
International Equites Portfolio
Our MM International Portfolio is performing steadily supporting our patient approach to this relatively new offering: https://www.marketmatters.com.au/new-international-portfolio/
MM continues to hold 72% in cash looking to buy weakness over September / October, plus we hold 8% in bearish S&P500 ProShares ETF (SH US) which will be closed / switched if our preferred pullback scenario unfolds.
MM still believes the risk / reward for US stocks is on the downside into October although they are not listening yet!
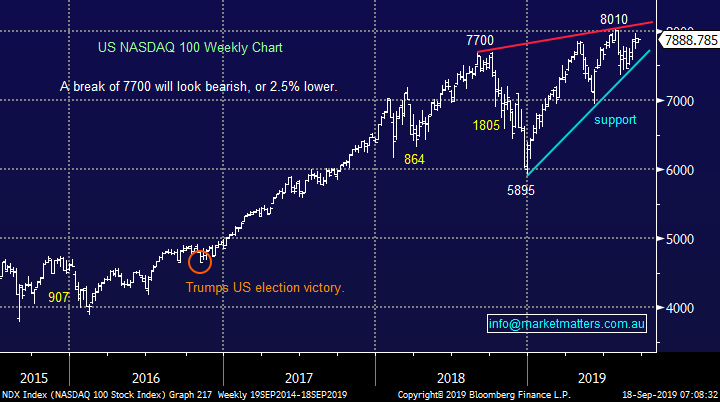
The recent huge sector rotation has reduced slightly our anticipated downside objectives for the broader indices as we feel cyclicals will continue to attract buying into weakness, although we can still see a sharp decline for the tech based NASDAQ. Today I have briefly looked at 5 stocks we are likely to buy into a market pullback in the weeks ahead.
US NASDAQ Index Chart
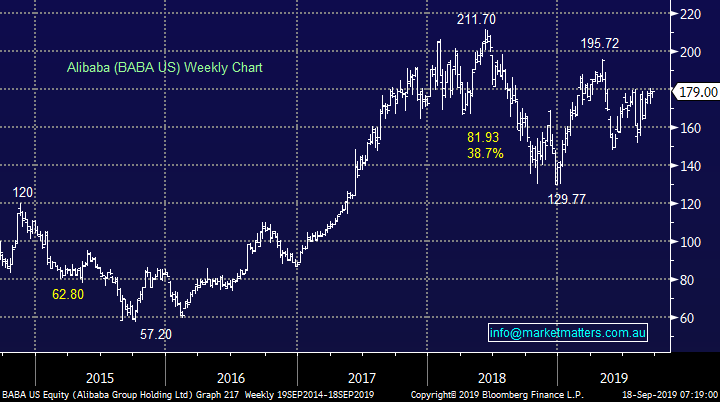
1 Alibaba (BABA US) $US179
MM continues to like Alibaba (BABA) medium-term, it’s a quality business we want to own with our target at least 20% higher. However its unlikely to be immune to a move lower in US equities hence we remain patient buyers – for now.
MM is bullish BABA with an ultimate target around $US220, or over 20% higher.
Alibaba (BABA US) Chart
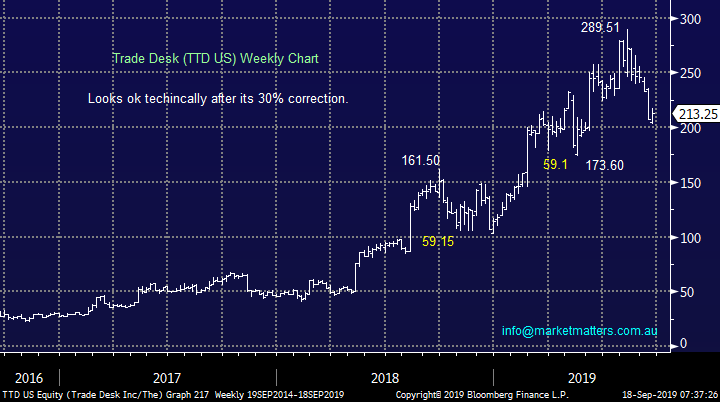
2 Trade Desk (TTD US) $US213.25
Global online advertising company Trade Desk (TTD) has now corrected ~30% in 2019 making the stock increasingly attractive. Technically we are looking for signs of the stock finding some support although any dip below $US200 looks like an ideal accumulation opportunity.
MM likes TTD, especially below $US200.
Trade Desk (TTD US) Chart
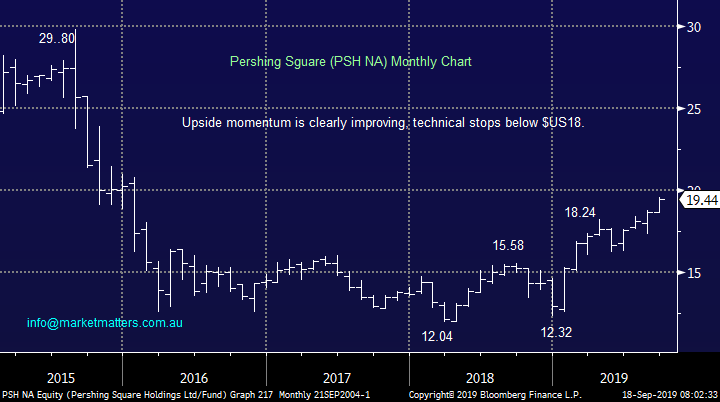
3 Pershing Square (PSH NA) $US19.44
Hedge fund vehicle PSH continues to strengthen over recent weeks even as some markets lose momentum. Technical and psychological resistance is looming around $US20 but we will regard any pullback as a buying opportunity.
MM is bullish PSH with stops below $US18.
Pershing Square (PSH NA) Chart
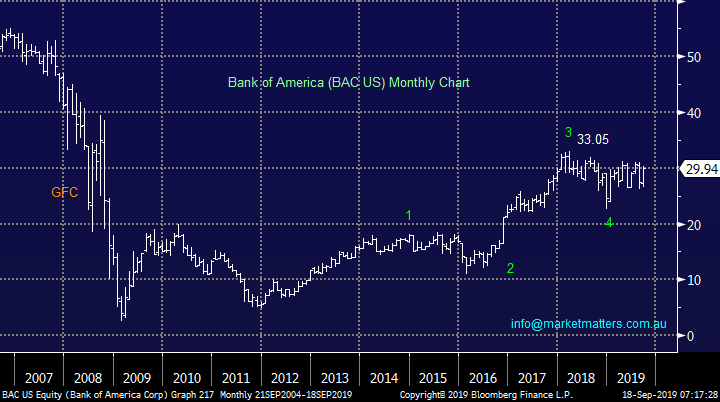
4 Bank of America (BAC US) $US29.94
MM has been keen on BAC for a while and the recent strength in cyclicals coming back into favour has me leaning more and more towards this sector of the market. Any pullback in bond yields should present an ideal opportunity to buy BAC.
MM is bullish the Bank of America (BAC US) targeting fresh post GFC highs.
Bank of America (BAC US) Chart
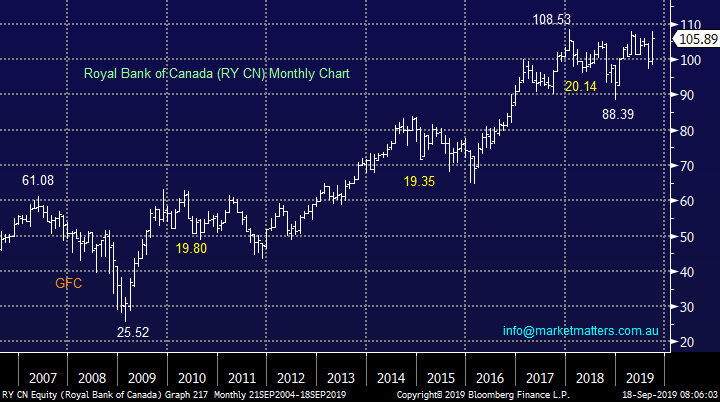
5 Royal Bank of Canada (RY CN) CAD105.89
As said above MM is leaning towards the cyclicals if we get a bond yield induced pullback by stocks in the weeks ahead. Technically and fundamentally we like RY targeting fresh all-time highs with the main question our end being how far will it rally.
MM is bullish RY targeting fresh all-time highs.
Royal Bank of Canada (RY CN) Chart
MM Global ETF Portfolio
No great change, MM has increased our portfolio holdings slightly over the last week through buying into a sliver ETF (a touch early in hindsight) and increasing our ProShares Short S&P500 ETF position, we now have 72% in cash, coincidentally the same as the International Portfolio: https://www.marketmatters.com.au/new-global-portfolio/
We remain comfortable with our 4 positions but further tweaks feel may unfold over the weeks ahead:
1 – MM plans to average our long $A position following the local currencies fresh multi-year lows below the 67c area level, we are now looking for an optimal technical set-up as we believe the $A “looks for a low”. The next pullback in risk assets is likely to see us increase our position from 7.5% to 10%.
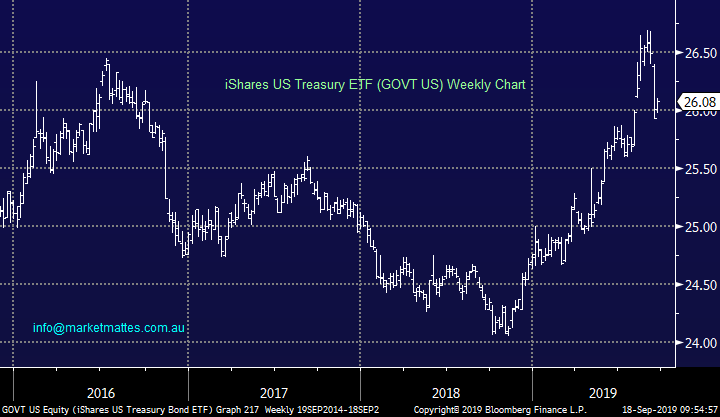
2 – Secondly the very topical bond market currently appears to be in the middle of a short-term pullback in price / rally in yield. MM is keen buyers of yield if we see another dip to fresh lows below say 1.4% - our preferred vehicle is the iPath US Treasury 10-year Bear.
Details of this ETF are explained on this link : https://www.ipathetn.com/US/16/en/details.app?instrumentId=259108
iShares US Treasury ETF (GOVT US) Chart
Conclusion (s)
MM remains net bearish global stocks in the weeks ahead and will be looking for opportunities to switch our “book of positions” around if a pullback unfolds.
Overnight Market Matters Wrap
· Oil prices slumped 7% overnight, losing about half the previous day’s gains, after Saudi Arabia surprised the market by announcing it had already restored 50% of its lost 5.7mmbls production and expected to get the rest back online by the end of the month.
· The price of Brent crude dropped around US$5 to US$64/bbl following the announcement, having hit a high of over US$71/bbl following the weekend drone bombing of their production facilities. The Saudi Energy Minister said that oil production facilities were fully restored and oil production would be back to the full production by the end of September.
· US equities recorded small gains, with the Nasdaq leading the way, rising around 0.4%, as the Federal Reserve kicked off its 2 day monetary policy meeting which is expected to announce a 25bp rate cut when it concludes tomorrow. Bonds were slightly lower, with the ten year benchmark at 1.81%. Commodities were mixed, with gold holding above US$1500/Oz, while copper eased 2%. The A$ is steady at US68.7c and the ASX is set to open about 0.1% higher.
Have a great day!
James & the Market Matters Team
Disclosure
Market Matters may hold stocks mentioned in this report. Subscribers can view a full list of holdings on the website by clicking here. Positions are updated each Friday, or after the session when positions are traded.
Disclaimer
All figures contained from sources believed to be accurate. All prices stated are based on the last close price at the time of writing unless otherwise noted. Market Matters does not make any representation of warranty as to the accuracy of the figures or prices and disclaims any liability resulting from any inaccuracy.
Reports and other documents published on this website and email (‘Reports’) are authored by Market Matters and the reports represent the views of Market Matters. The Market Matters Report is based on technical analysis of companies, commodities and the market in general. Technical analysis focuses on interpreting charts and other data to determine what the market sentiment about a particular financial product is, or will be. Unlike fundamental analysis, it does not involve a detailed review of the company’s financial position.
The Reports contain general, as opposed to personal, advice. That means they are prepared for multiple distributions without consideration of your investment objectives, financial situation and needs (‘Personal Circumstances’). Accordingly, any advice given is not a recommendation that a particular course of action is suitable for you and the advice is therefore not to be acted on as investment advice. You must assess whether or not any advice is appropriate for your Personal Circumstances before making any investment decisions. You can either make this assessment yourself, or if you require a personal recommendation, you can seek the assistance of a financial advisor. Market Matters or its author(s) accepts no responsibility for any losses or damages resulting from decisions made from or because of information within this publication. Investing and trading in financial products are always risky, so you should do your own research before buying or selling a financial product.
The Reports are published by Market Matters in good faith based on the facts known to it at the time of their preparation and do not purport to contain all relevant information with respect to the financial products to which they relate. Although the Reports are based on information obtained from sources believed to be reliable, Market Matters does not make any representation or warranty that they are accurate, complete or up to date and Market Matters accepts no obligation to correct or update the information or opinions in the Reports. Market Matters may publish content sourced from external content providers.
If you rely on a Report, you do so at your own risk. Past performance is not an indication of future performance. Any projections are estimates only and may not be realised in the future. Except to the extent that liability under any law cannot be excluded, Market Matters disclaims liability for all loss or damage arising as a result of any opinion, advice, recommendation, representation or information expressly or impliedly published in or in relation to this report notwithstanding any error or omission including negligence.