Overseas Wednesday – International Equities & ETF Portfolios – (COH, APX, SYD, GDX AU, EVN, RDSA LN, BAC US, GOVT US)
**Please note the weekly Income Report will be provided on Thursday**
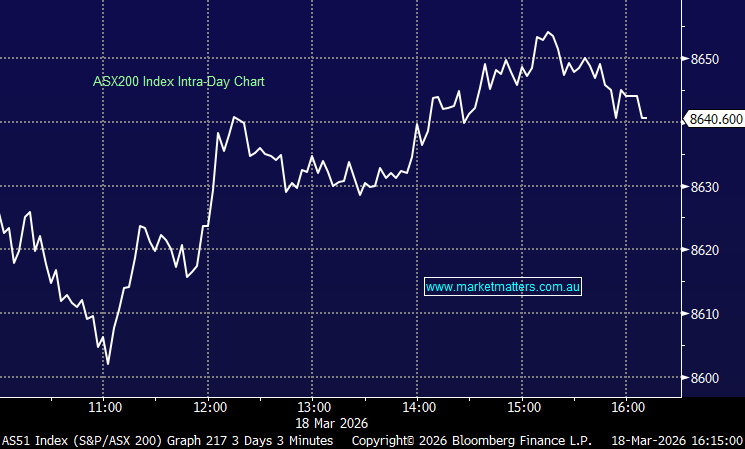
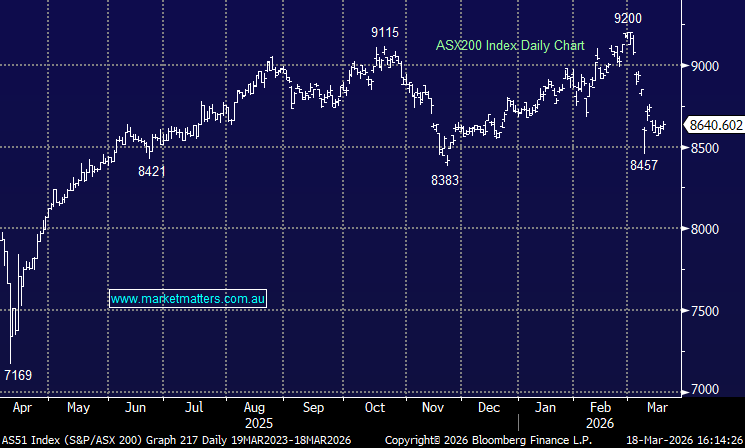
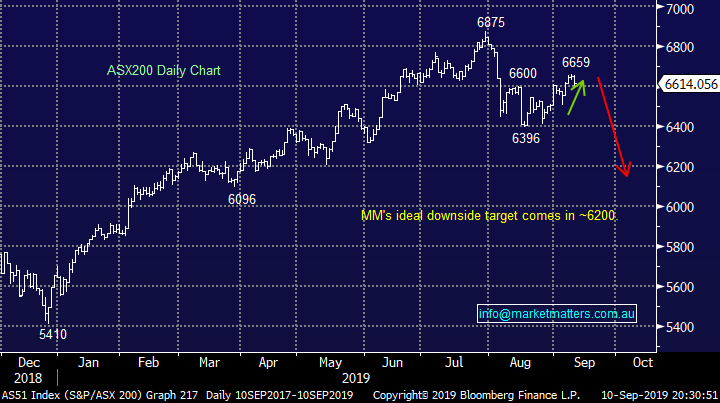
The ASX200 showed some definite signs of cracks appearing in some leading sectors yesterday as it fell 34-points / 0.5% with no obvious negative leads from overseas markets – a large fall considering major banks and resources were up on the day. The standout selling in the local market was focused in the Healthcare, “yield play”, Gold & IT sectors, some of the local markets top performing areas during 2019. If we are on the money and the ASX200 is poised to correct back towards the 6200 area then these stocks / sectors are likely to lead both the descent, and ultimately any recovery when it finally all unfolds. Importantly we are only looking for a 5-6% pullback from current levels, not a great deal more than common market noise.
It’s a nice feeling when the MM Portfolio (s) outperform, yesterday was a great example as local stocks retreated in the face of broad based selling the MM Growth Portfolio actually managed to close in the black as we continue to avoid all the sectors which came under the pump yesterday – of the aggressively sold-off stocks / sectors only the golds look likely to be on our buy radar in the relatively near future. It almost felt like some “big market players” had read our recent reports, including yesterday’s focus on the growth IT sector, as our short-term aversion to the best performing stocks in 2019 unfolded perfectly yesterday. While we are not yet convinced that the ultimate market rotation has begun we do believe investors should be very selective buying any of 2019’s “go to” stocks.
Conversely on a more positive note, what did catch our attention yesterday was the strength in many building stocks including CSR Ltd (CSR) +3.9%, Fletcher Building (FBU) +3.6%, Adelaide Brighton (ABC) +2.6% and Brickworks (BKW) +2.5% - we are open-minded that MM may have taken a recent hit on ABC too early and perhaps patience would have been a better course of action, we are watching the embattled building sector closely for a potential sustained recovery.
Technically the ASX200 is now flirting with its 6600 support, while our preference is for a pullback towards 6200 importantly no sell signals have yet been triggered.
MM currently remains comfortable holding higher cash levels than during the first 6-months of 2019.
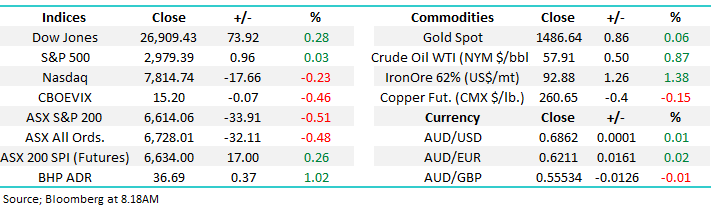
Overnight US stocks again closed mixed with the Dow rallying +0.3% while the tech based NASDAQ fell -0.2% although both managing a little rally into the close. The SPI futures are calling the ASX200 to open up around 15-points this morning, with BHP set to open up +0.5% looking set to support the index early in the day.
In today’s report we are as usual going to look at our Platinum, International and ETF Portfolio’s.
ASX200 Chart
How far does MM feel growth / high performing stocks might fall?
Yesterday potentially felt like the start of the decent unwind MM has been looking for a number of weeks with the likes of CSL Ltd (CSL) -$5.09, WiseTech (WTC) -6.9% and IDP Education (IEL) -4.9% weighing on the market from both a points and % perspective. I can imagine a number of subscribers want us to quantify how far we believe these “market darlings” can correct, today I have picked out 3 very different stocks which have performed strongly in 2019 to illustrate why we feel this may be just the beginning:
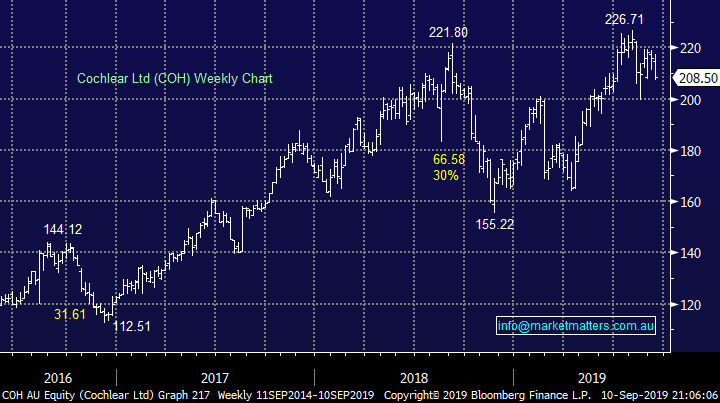
1 – Cochlear Ltd (COH) : Technically COH is looking like another false breakout above $220, a 10-15% pullback would not surprise but this would only be giving up half of its gains of 2019.
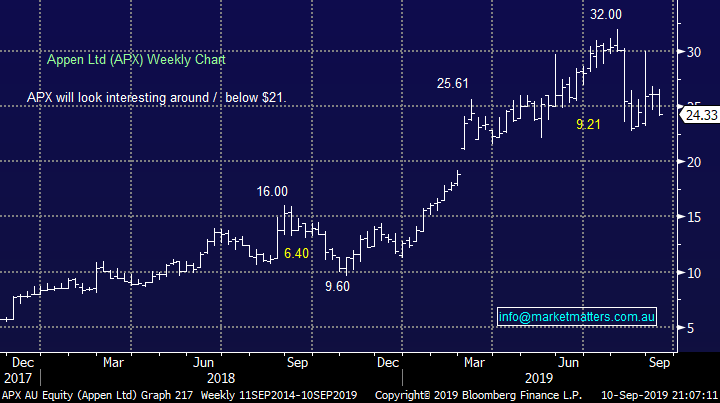
2 - Appen Ltd (APX) : No change to our opinion yesterday, even after yesterday’s -6.6% drop our target remains ~15% lower, or below $21.
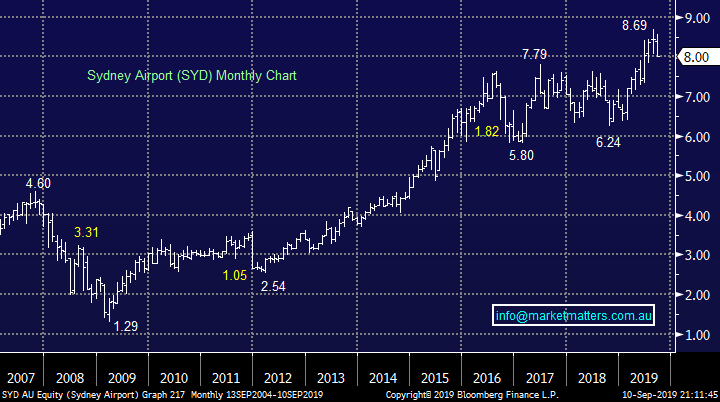
3 – Sydney Airports (SYD) : the classic Australian “yield play” stock fell over 3% yesterday but we can see another 20% downside when fund managers decide that bond yields have reached their nadir i.e. this feels an extremely “owned” stock NB not our preferred scenario just yet.
It’s important subscribers understand that MM feels this is probably just another warning shot to these stocks, similar to Q4 of 2018 but our current best guess is of lower magnitude this time around. Hence MM likes the idea of holding elevated cash levels and avoiding most of 2019’s best performing stocks for now but we can see ourselves looking for some bargains within this group if a sharp market pullback does unfold.
Cochlear Ltd (COH) Chart
Appen Ltd (APX) Chart
Sydney Airports (SYD) Chart
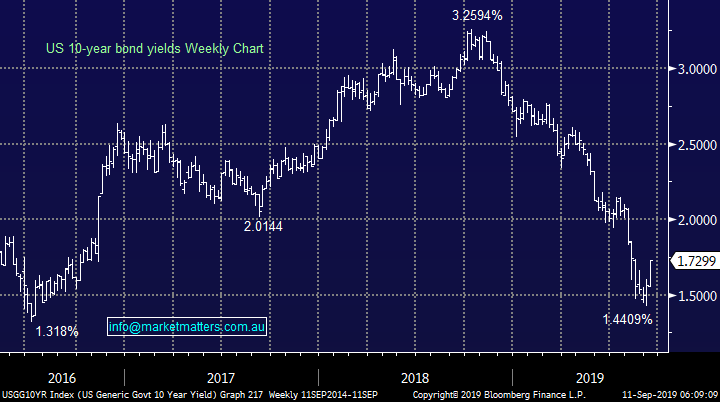
Arguably the main key to this group of stocks is bond yields and the US 10-year is the one Financial Markets undoubtedly watch the most closely. So far we have only seen a 2-week countertrend bounce, most definitely not a sign of a change in trend.
At this stage while we believe the US 10-years have started to look for a low ongoing choppy price action back towards 1.5% would not surprise. A correction in stocks would more than likely see the safety of bonds again enjoy an aggressive bid tone potentially sending yields back below 1.5%.
MM believes the bear market for bond yields is very mature but new lows would not surprise.
US 10-year bond yields Chart
Is it time to buy Golds?
Sorry for returning to the well but the gold sector is rapidly approaching our optimum buy zone and not surprisingly subscribers have been asking when do we plan to start accumulating the sector.
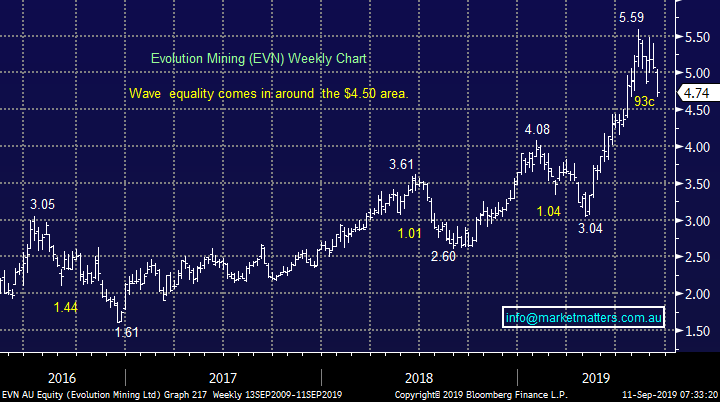
Our favourite 2 picks in the sector are still Newcrest Mining (NCM) and Evolution Mining (EVN), with both now very close to our optimum buy zones. We may dip our toe into the water very soon – *watch for alerts.
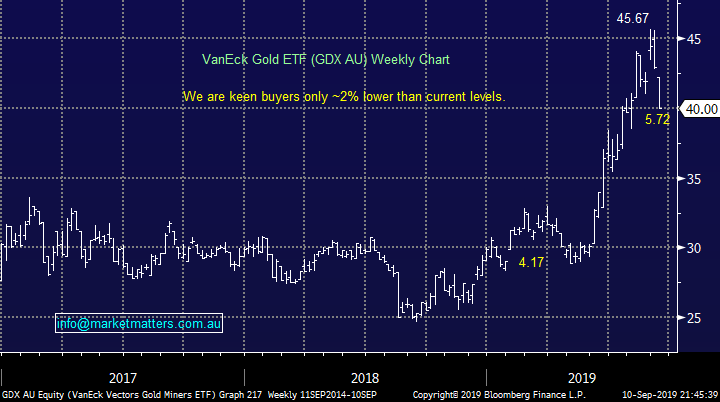
MM likes the VanEck Gold Miners ETF (GDX AU) ~2% lower.
VanEck Gold Miners ETF (GDX AU) Chart
Evolution Mining (EVN) Chart
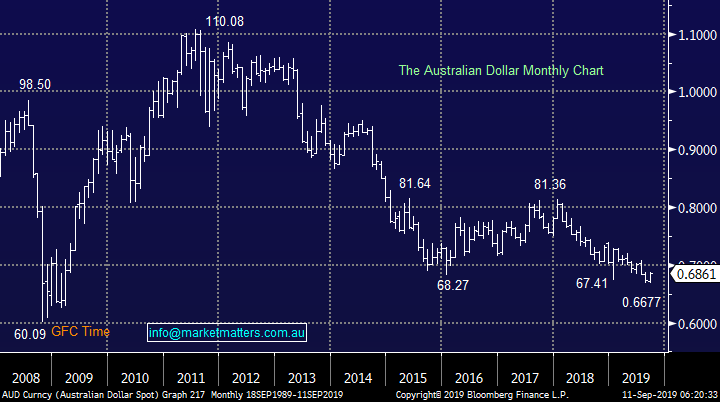
Lastly looking at the Aussie dollar which continues hold firm in the 67-69c region. Our medium-term bullish outlook for the $A is by default bullish the likes of copper and iron ore. Hence don’t be surprised to see us go long our preferred copper play in the weeks ahead if we see another pullback in risk / cyclicals i.e.MM likes Oz Minerals (OZL) in the months ahead.
MM believes the $A is looking for / has reached a major point of inflection.
Australian Dollar Chart
Growth Portfolio
Currently MM is comfortable with our MM Growth Portfolio which recently been outperforming the index nicely . Click here to view the MM Growth Portfolio
At this stage we only envisage buying back into the gold space into current weakness. The vast majority of our planned “shopping” will hopefully be implemented around the 6200 area basis the ASX200.
International Equites Portfolio
Our MM International Portfolio is performing solidly supporting our patient approach to this relatively new offering: Click here to view the MM Inernational Portfolio
Currently we are holding 72% cash looking to buy weakness over September / October, plus 8% in bearish S&P500 ProShares ETF (SH US) which will be closed / switched if our preferred pullback scenario unfolds.
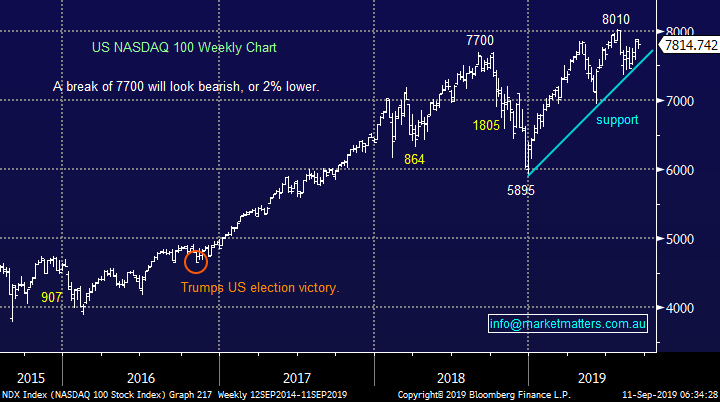
MM still believes the risk / reward for US stocks is on the downside for the next few months.
Our preferred scenario is the S&P500 will shortly test the 2750 area in 2019, or another 5% lower. A break of the trend line illustrated below for the NASDAQ below would be a major warning to the bulls.
US NASADAQ Index Chart
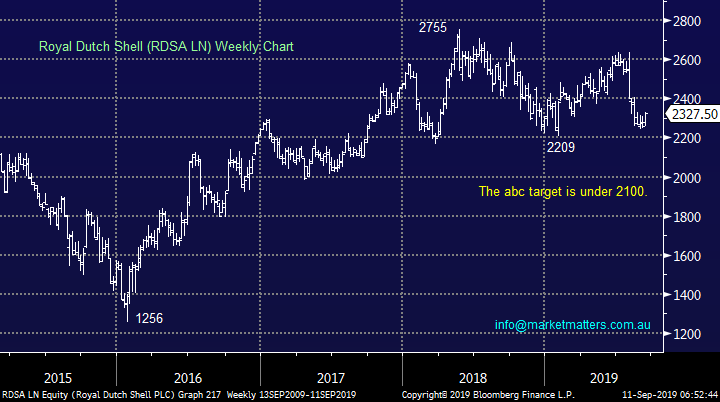
Over previous weeks we have shown a few stocks MM will consider buying into any pullback in the weeks ahead – common President Trump give us a tweet! On a more serious note one area we haven’t discussed is European Cyclicals like banks and resources which we feel are close to their nadir of underperformance, we might surprise some subscribers and venture into this scary fold if some decent risk / reward presents itself.
Royal Dutch Shell (RDSA LN) Chart
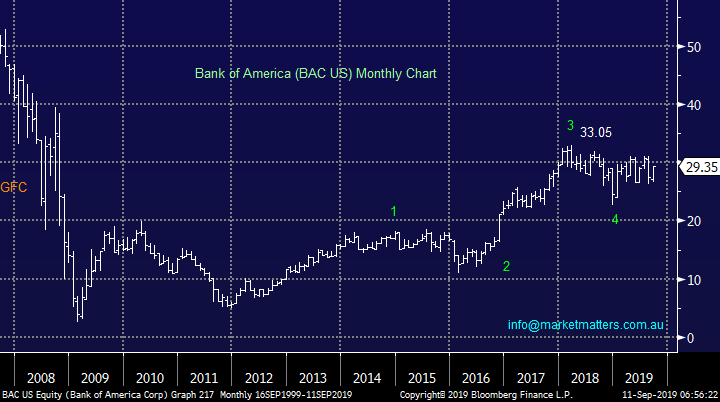
To maintain a degree of consistency after venturing into the European den of underperformance I have again mentioned one of our favourite stocks for the weeks ahead - Bank of America (BAC US), it’s hard to press the buy button when your bearish the index but this is definitely on our menu into any pullback.
MM is bullish the Bank of America (BAC US) targeting fresh post GFC highs.
Bank of America (BAC US) Chart
Conclusion (s)
No change, MM likes sitting on our hands at this stage but we are dusting off the buy button in tune with our targeted pullback by the S&P500 towards / below the 2750 area.
MM Global ETF Portfolio
MM has increased our portfolio slightly over the last week by buying into a silver ETF (a touch early in hindsight) and increasing our ProShares Short S&P500 ETF position, we now have 72% in cash, coincidentally the same as the International Portfolio : Click here to view the MM Global ETF Portfolio
We remain comfortable with our 4 positions but further tweaks feel may unfold over the weeks ahead:
1 – MM plans to average our long $A position following the local currencies fresh multi-year lows below the 67c area level, we are now looking for an optimal technical set-up as we believe the $A “looks for a low”. The next pullback in risk assets is likely to see us increase our position from 7.5% to 10%.
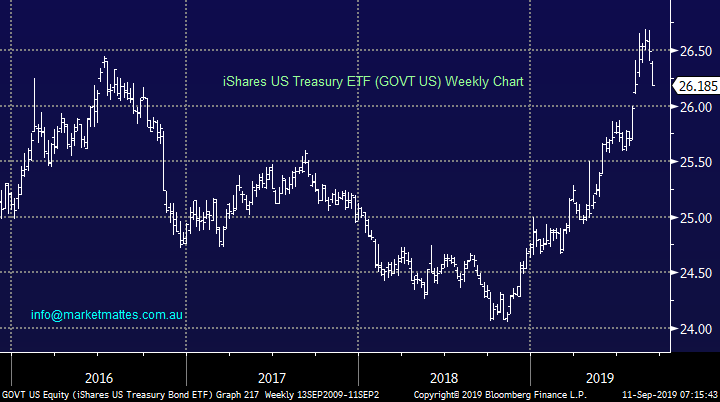
2 – Secondly the very topical bond market currently appears to be in the middle of a short-term pullback, we are buyers on a risk / reward basis less than 1% lower for the iShares US Treasury ETF (GOVT US), with stops below 25.60, solid risk / reward.
Details of this ETF are explained on this link.
iShares US Treasury ETF (GOVT US) Chart
Conclusion (s)
MM remains net bearish global stocks in the weeks ahead and will be looking for opportunities to invest accordingly.
Overnight Market Matters Wrap
• US equities recovered early losses to close mostly in the black following speculation China may offer to buy more US agricultural goods in the hope of striking a better trade deal.
• US 10 year bonds are now yielding 1.70%, up from 1.46% a week ago. Some are calling this a turning point in bonds, while others are just calling it profit taking. It’s likely that low global growth and trade uncertainty will necessitate the need for lower rates as per central bank commentary.
• BHP is expected to outperform the broader market after ending its US session up an equivalent of 1.02% from Australia’s previous close.
• The September SPI Futures is indicating the ASX 200 to open 25 points higher towards the 6640 level this morning.
Have a great day!
James & the Market Matters Team
Disclosure
Market Matters may hold stocks mentioned in this report. Subscribers can view a full list of holdings on the website by clicking here. Positions are updated each Friday, or after the session when positions are traded.
Disclaimer
All figures contained from sources believed to be accurate. All prices stated are based on the last close price at the time of writing unless otherwise noted. Market Matters does not make any representation of warranty as to the accuracy of the figures or prices and disclaims any liability resulting from any inaccuracy.
Reports and other documents published on this website and email (‘Reports’) are authored by Market Matters and the reports represent the views of Market Matters. The Market Matters Report is based on technical analysis of companies, commodities and the market in general. Technical analysis focuses on interpreting charts and other data to determine what the market sentiment about a particular financial product is, or will be. Unlike fundamental analysis, it does not involve a detailed review of the company’s financial position.
The Reports contain general, as opposed to personal, advice. That means they are prepared for multiple distributions without consideration of your investment objectives, financial situation and needs (‘Personal Circumstances’). Accordingly, any advice given is not a recommendation that a particular course of action is suitable for you and the advice is therefore not to be acted on as investment advice. You must assess whether or not any advice is appropriate for your Personal Circumstances before making any investment decisions. You can either make this assessment yourself, or if you require a personal recommendation, you can seek the assistance of a financial advisor. Market Matters or its author(s) accepts no responsibility for any losses or damages resulting from decisions made from or because of information within this publication. Investing and trading in financial products are always risky, so you should do your own research before buying or selling a financial product.
The Reports are published by Market Matters in good faith based on the facts known to it at the time of their preparation and do not purport to contain all relevant information with respect to the financial products to which they relate. Although the Reports are based on information obtained from sources believed to be reliable, Market Matters does not make any representation or warranty that they are accurate, complete or up to date and Market Matters accepts no obligation to correct or update the information or opinions in the Reports. Market Matters may publish content sourced from external content providers.
If you rely on a Report, you do so at your own risk. Past performance is not an indication of future performance. Any projections are estimates only and may not be realised in the future. Except to the extent that liability under any law cannot be excluded, Market Matters disclaims liability for all loss or damage arising as a result of any opinion, advice, recommendation, representation or information expressly or impliedly published in or in relation to this report notwithstanding any error or omission including negligence.