Overseas Wednesday – International Equities & ETF Portfolios (CBA, WBC, AAPL US, IWM US, IEM US, 700 HK)
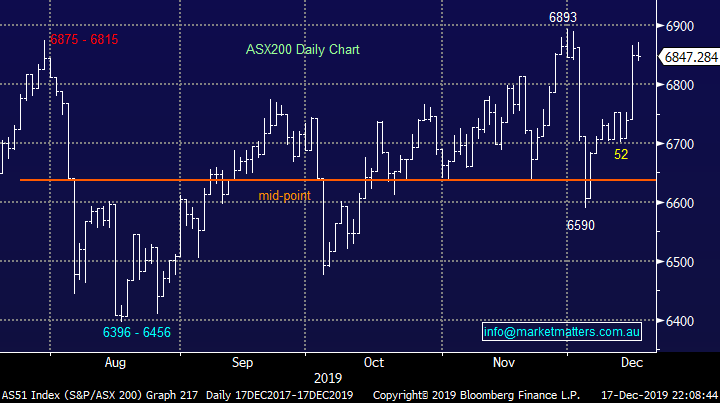
The ASX200 felt a touch-tired yesterday after its 110-point surge on Monday, it gave back some healthy early morning gains however the eventual close only 0.7% below its all-time high is hardly cause for concern. Overall it was a quiet day with winners & losers pretty evenly matched while only the Utilities Sector moved by more than 0.4% in either direction – this time the classic defensive group had a relatively poor day closing down -0.9%.
Conversely the likes of copper stock OZ Minerals (OZL) made fresh 7-year highs as the industrial metal continues its strong recovery, this is an ideal time for a quick snapshot of a few key MM views moving into Christmas:
1 – Reflation looks set to surprise many with base metals already rallying and the agricultural complex forming a base – rising inflation has huge ramifications for sector performance.
2 – MM remains committed to our view that it’s time for the deeper value stocks (e.g. Resources & Banks) to outperform high P/E growth & defensives (e.g. IT, Real Estate and Utilities).
3 – Bond yields are looking for a major low which may have already been achieved in August for the closely watched 10-years in both the US and Australia.
MM remains bullish stocks into 2020.
Overnight US stocks closed marginally higher, but the SPI is calling the ASX200 top open down around 15-points after ASIC has filed a suit against NAB over fee for no service and QBE is out with a downgrade.
Today we’ve focused on the bigger picture as we see the US Growth Index again make fresh all-time highs overnight.
ASX200 Chart
APRA / ASIC continue to put pressure on our Banking Sector, this morning the Australian Financial Review is leading with “Regulator drops bomb on NAB” with ASIC claiming the bank has broken the law 10,000 times which has a theoretical maximum penalty of $10 billion. Personally, I’m really getting over the bank bashing as I raise 2 fundamental issues that frustrate:
1 – As regulators fine our banks their share prices decline BUT most Australians have upwards of 20% of their Super in the “Big 4” banks, so it’s easy to extrapolate this to say the regulators are simply taking $$ from our Super – I could have written this far harsher.
2 – The bank employees / directors who have been largely responsible for the indiscretions maybe losing their jobs, but their payouts would certainly be keeping the wolf from most people’s door, the stockholders are being punished far more the actual culprits.
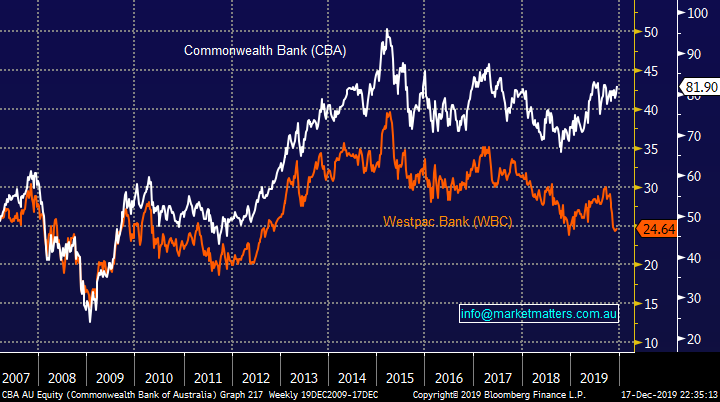
While I appreciate the serious issues that came out during the Royal Commission, accountability for individuals is the key, continuing to punish shareholders through huge fines is not. This year the US Banking Sector is up +36% to new all-time highs thanks largely to deregulation while the Australian Banking Sector is up only +5%, primarily supported by Commonwealth Bank (CBA) as regulators remain front and centre. Australia needs a strong and active Banking Sector to grow our economy, lending is the lifeblood of growth and at the moment who could blame the banks for backing into their shells for a year or 2, a trend that which will hurt the Australian economy.
The good news is we believe the negative news for our banks is reaching its peak and they can regain some of their “mojo” in 2020, I know we’ve had this view for a few months, but it still feels ok. The higher risk members of the “Big 4” like Westpac and NAB are starting to represent relative value against CBA, many analysts have become scarred around this view which means it’s probably almost time top push the button.
MM feels it’s almost time to switch from CBA to WBC.
Commonwealth Bank (CBA) v Westpac Bank (WBC) Chart
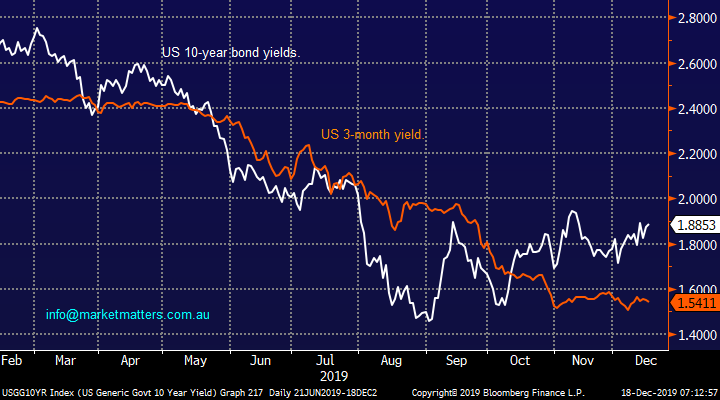
US yield curve providing some clues.
US 10-year bond yields are rising while their short-term peers are treading water at best implying that inflation is around the corner, but official interest rates won’t be rising anytime soon. From an equities perspective it says that things are improving for riskier recovery style companies while creating a headwind for the logic of continuing to chase growth / yield companies.
We should always remember that bond markets usually lead equities and, in this case, we believe 2020 / 21 will see a major rotation back towards value from growth.
US 10-year & 3-month Yields Chart
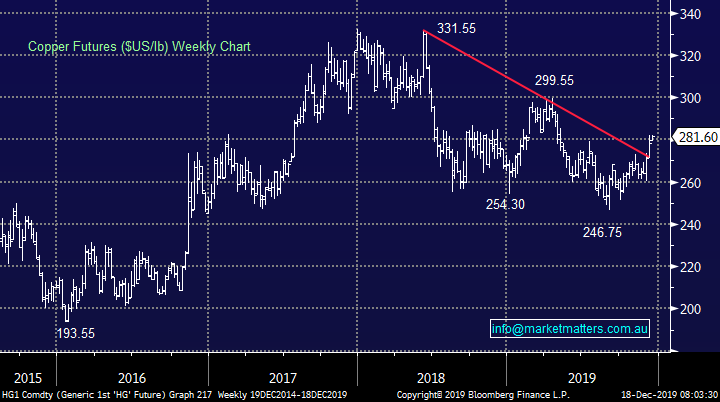
Copper suggests inflation is indeed looming.
We have been calling copper to break to the upside for months and the last 2-weeks has seen the move unfold with a bang as the industrial metal has rallied almost 8% which is about half of our initial targeted move. Assuming we are correct with this bullish copper view the reflation argument is likely to be alive and well.
MM remains bullish both copper and reflation.
Copper Futures ($US/lb) Chart
MM continues to prefer Value overgrowth into 2020.
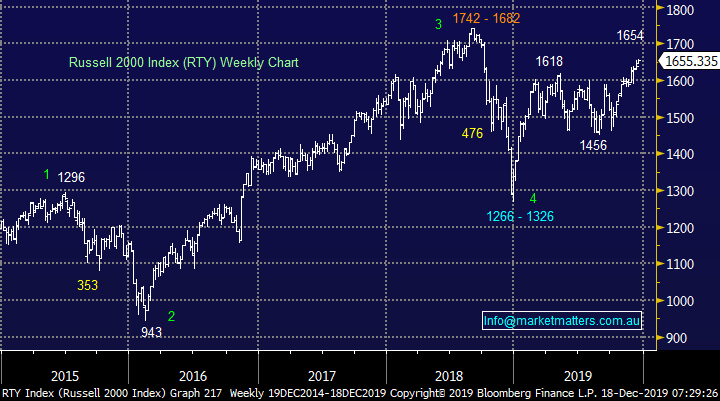
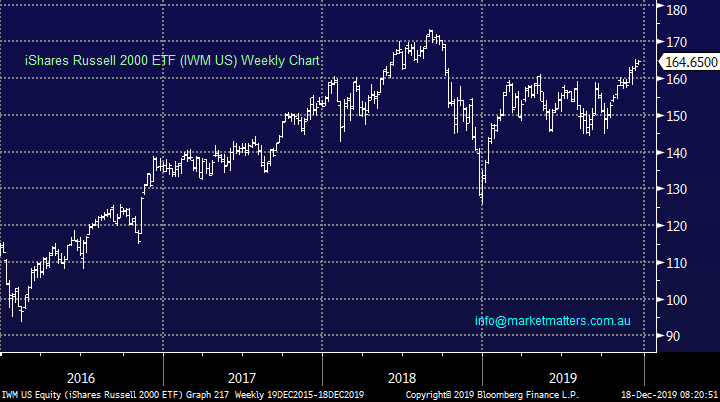
An excellent illustration of how investors continue to chase the growth / large end of town is when we see the S&P500 continually make fresh all-time highs in 2019 while the small cap Russell 2000 remains well below its 2018 high. Wall Street continues to chase defensive equities to unprecedented valuations while the riskier smaller stocks are largely being ignored, the valuation gap between these 2 indices is at a 10-year extreme. A similar picture is unfolding in Australia – we believe this elastic band is poised to snap back aggressively.
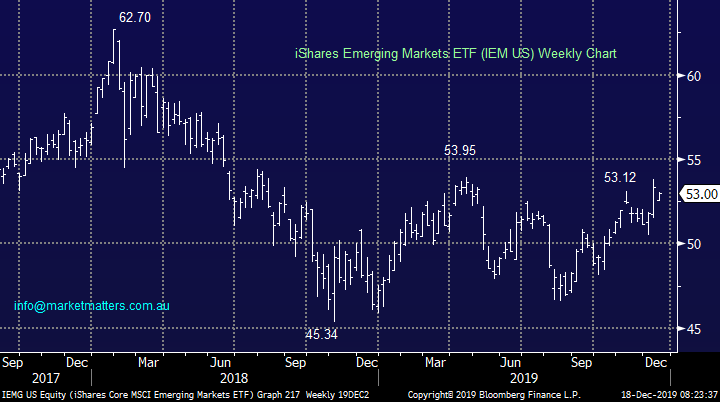
Similarly, the differential between developing markets and the US is close to a 16-year low as fund managers play this longest bull market in history in a very one-dimensional manner. The earnings expansion being enjoyed by the expensive growth companies cannot continue indefinitely while the neglected value names become cheaper by the month on a relative basis – MM believes fund managers will soon start chasing the cheaper value stocks.
MM is bullish the Russell 2000 initially targeting an advance of 8-9%.
Russell 2000 Index Chart
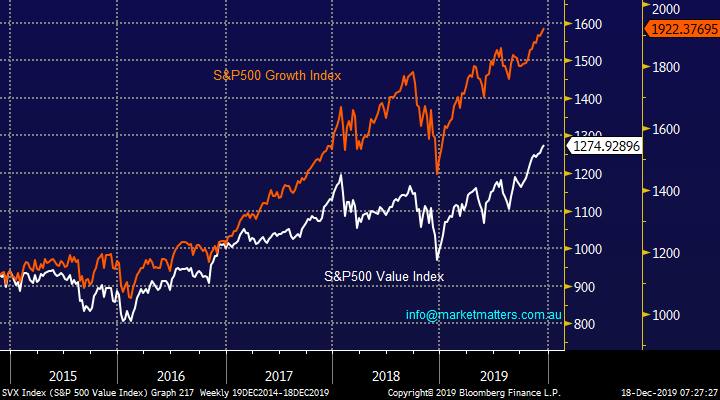
When we look at the Value and Growth Indices in the US both remain strong, especially after the Value gauge recently broke out to fresh all-time highs. If MM is correct and bond yields are close to an inflection point then the huge outperformance from the growth end of town is likely to be over i.e. the white and orange lines on the chart below should start to converge – as we said previously Value stocks include Banks & Resources while Growth includes the IT stocks, healthcare and the like.
MM prefers Value overgrowth into 2020.
US Value & Growth Indices Chart
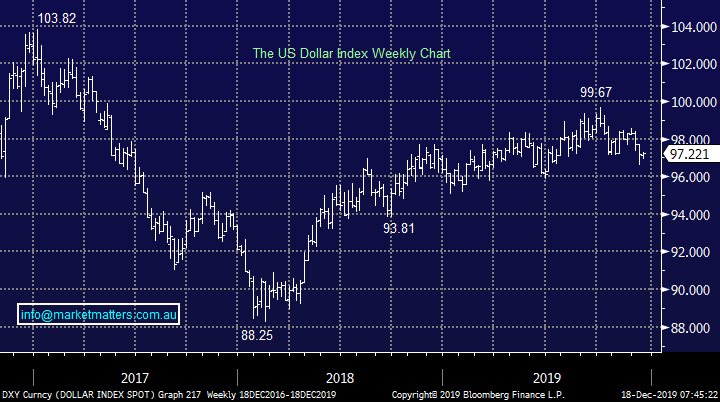
The $US remains vulnerable to MM.
The $US continues to drift lower allowing the $A to knock on the 69c door. In the short-term we expect a 2-3% move lower towards the 94-5c for the US Dollar Index (DXY) with the risks of a much deeper move into 2020 mounting in our opinion. Interestingly this is another major trend reversion we are looking for in 2020, like a jigsaw the pieces usually all come together at once i.e. if bond yields bottom and the $US is topping then the likelihood is value will start to close the huge outperformance by growth over the last few years.
MM is bearish the $US which is by definition bullish the metals / miners & $A.
The $US Index Chart
The MM International Equites Portfolio
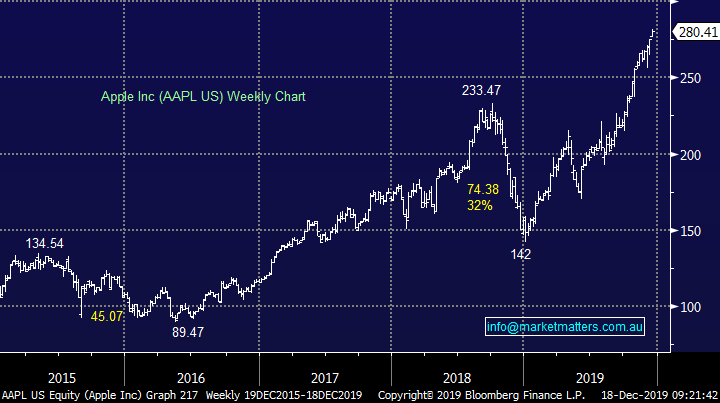
The portfolio is currently enjoying a strong move in Apple (APPL US) which is trading at all-time highs, now up more than 40% from initial entry. The technology goliath is trading an estimated P/E for FY20 of 20.8x which is well above its 5 years average of 14x. Optimism here is building of new product roll outs expected to generate annual earnings growth of around 10%.
MM remains bullish Apple (APPL US) while it holds above $US250 however valuations are now becoming stretched.
Apple Inc (AAPL US) Chart
Cash remains at 37% in this portfolio plus we have 8% exposure to a negative facing ETF. : https://www.marketmatters.com.au/new-international-portfolio/
There have been a number of stocks / sectors which we have been considering for the MM International Portfolio but the possibility of a move lower by bond yields has left us patiently on the sidelines, so far December has delivered a strong Christmas Rally in risk assets leaving decent risk / reward entry levels a tougher call.
As we discussed MM believes the Russell 2000 index is bullish and will outperform the S&P500 through 2020, this makes it an ideal purchase for the International Portfolio. Our preferred vehicle to play this view is the Blackrock ETF which currently is valued at almost $US48bn: https://www.etf.com/IWM
MM is bullish the Russell 2000 ETF (IWM US)
iShares Russell 2000 Chart
Emerging Markets
No Change, MM continues to like the Emerging Markets moving into 2020, a view strongly supported by our bearish $US view but one that previously came under some pressure due to ongoing trade war concerns and social unrest in Hong Kong.
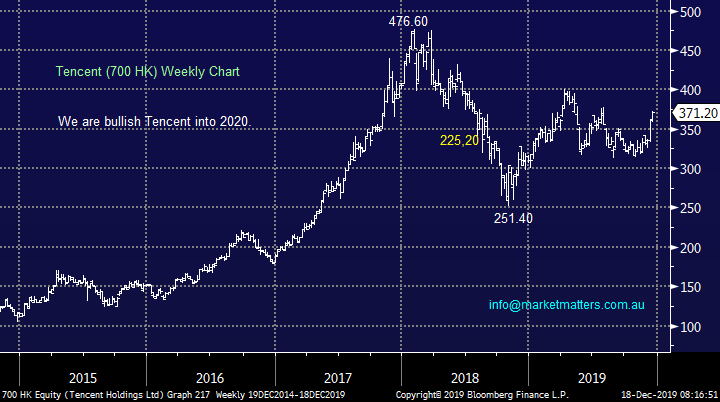
Our preferred ways to play this view are still adding to our Samsung (005930 KS) and Ping An (2318 HK) positions plus internet and e-commerce goliath Tencent (700 HK).
Emerging Markets ETF (IEM US) Chart
On-line goliath Tencent struggled in 2018 / 19 but we like the way its holding current levels even as shares in the region remain choppy. After spending the last 6-months basically trading sideways a significant move higher now feels underway.
MM is bullish Tencent (700 HK).
Tencent (700 HK) Chart
Conclusion (s)
MM likes the Value Sector and Emerging Markets into 2020, we plan to significantly increase our exposure to both of these areas moving forward.
The MM Global Macro ETF Portfolio
Last week we didn’t change our MM Global Macro Portfolio leaving our cash level at 51.5% as we continue to watch bond yields closely. : https://www.marketmatters.com.au/new-global-portfolio/
So far bond yields are not following our ideal path down to fresh lows and we have to be open-minded that they have already bottomed. Hence the logical 2 purchases for this Macro ETF Portfolio are the same as the International Portfolio i.e. add to the IEM ETF and buy the IWM ETF.
Conclusion (s)
We are likely to implement these 2 ideas / plans moving forward.
Overnight Market Matters Wrap
- The US equity markets hit an all-time high overnight following November US manufacturing data reported ahead of analyst expectations. US housing data also rose more than anticipated, which led to rallies in home improvement companies such as Home Depot and Lowes.
- Metals on the LME were generally weaker, with nickel falling 1.8%. Iron ore and gold both with little change, while crude oil continues to rally, up another 1.1% to $US60.87/bbl.
- BHP is expected to outperform the broader market after ending its US session up and equivalent of 0.35% from Australia’s previous close.
- The December SPI Futures is indicating the ASX 200 to open 17 points lower, towards the 6830 level this morning.
Have a great day!
James & the Market Matters Team
Disclosure
Market Matters may hold stocks mentioned in this report. Subscribers can view a full list of holdings on the website by clicking here. Positions are updated each Friday, or after the session when positions are traded.
Disclaimer
All figures contained from sources believed to be accurate. All prices stated are based on the last close price at the time of writing unless otherwise noted. Market Matters does not make any representation of warranty as to the accuracy of the figures or prices and disclaims any liability resulting from any inaccuracy.
Reports and other documents published on this website and email (‘Reports’) are authored by Market Matters and the reports represent the views of Market Matters. The Market Matters Report is based on technical analysis of companies, commodities and the market in general. Technical analysis focuses on interpreting charts and other data to determine what the market sentiment about a particular financial product is or will be. Unlike fundamental analysis, it does not involve a detailed review of the company’s financial position.
The Reports contain general, as opposed to personal, advice. That means they are prepared for multiple distributions without consideration of your investment objectives, financial situation and needs (‘Personal Circumstances’). Accordingly, any advice given is not a recommendation that a particular course of action is suitable for you and the advice is therefore not to be acted on as investment advice. You must assess whether or not any advice is appropriate for your Personal Circumstances before making any investment decisions. You can either make this assessment yourself, or if you require a personal recommendation, you can seek the assistance of a financial advisor. Market Matters or its author(s) accepts no responsibility for any losses or damages resulting from decisions made from or because of information within this publication. Investing and trading in financial products are always risky, so you should do your own research before buying or selling a financial product.
The Reports are published by Market Matters in good faith based on the facts known to it at the time of their preparation and do not purport to contain all relevant information with respect to the financial products to which they relate. Although the Reports are based on information obtained from sources believed to be reliable, Market Matters does not make any representation or warranty that they are accurate, complete or up to date and Market Matters accepts no obligation to correct or update the information or opinions in the Reports. Market Matters may publish content sourced from external content providers.
If you rely on a Report, you do so at your own risk. Past performance is not an indication of future performance. Any projections are estimates only and may not be realised in the future. Except to the extent that liability under any law cannot be excluded, Market Matters disclaims liability for all loss or damage arising as a result of any opinion, advice, recommendation, representation or information expressly or impliedly published in or in relation to this report notwithstanding any error or omission including negligence.


