Overseas Wednesday as the G20 approaches
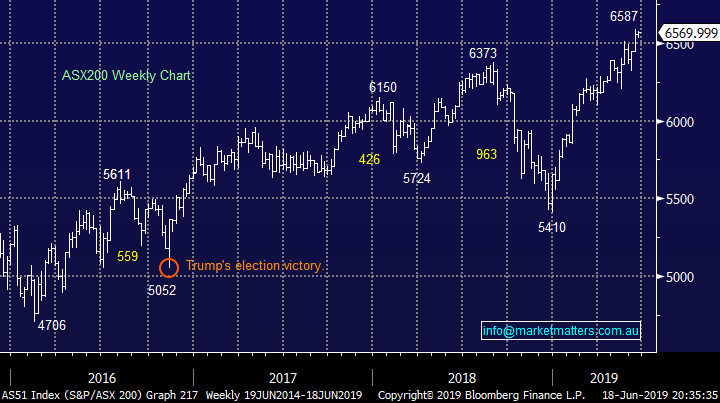
The ASX200 enjoyed a strong Tuesday rallying almost 40-points following more dovish inference from the RBA minutes, the crux of the statement being that rates were more likely to go down than up from here, remember we’re already at 1.25%, the lowest level in history. At the moment the market is only focusing on the low rates side of the equation, not the cause, and that’s a clear positive for asset prices. Interest markets are almost fully pricing in 2 more cuts in 2019, which targets 0.75% hence as we keep saying don’t fight the tape because the momentum and trend is bullish i.e. yesterdays close was the highest since late 2007 and the ASX200’s all-time high is now only 4.3% away.
The broad strength of the market yesterday was illustrated by none of the indexes 11 sectors closing in the red and twice as many stocks were up than down. The Healthcare sector narrowly was the best on ground led by heavyweight CSL Ltd (CSL) which closed up +1.8%. As you would expect beneficiaries of lower interest rates outperformed on the day with Real Estate, Retail & the classic “yield play” stocks pushing higher. Overall the ASX200 strength is being assisted by market heavyweight CBA which is now a huge 7.6% of our index and while it continues to rally, fresh all-time highs by the underlying index is a real possibility.
Overnight Europe added further fuel to investors’ hopes of yet lower rates / easier monetary policy when ECB President Mario Draghi said additional stimulus may be required if the economic landscape doesn’t improve. Definitely not what President Trump wants to hear as it sends the $US higher making them less competitive in the process. At 10pm last night most European indices were up ~1.5% close to making fresh 2019 highs, sounds like the familiar tune of interest rates down pushes stocks higher.
However our slowly increasing fears are coming from 2 angles:
1 – The room for disappointment on the interest rate front now appears to be we get only one or no rate cuts in 2019 i.e. two are already built into our market.
2 – Equities start focusing on the weakening global economy and potential looming recession, the reason for the cuts in the first place.
Our investment thesis remains to slowly increase our cash levels into the current market strength but the only one sale in recent weeks illustrates our belief that the market feels like it has the capability to squeeze higher, especially as we like the US S&P500 very short-term.
MM is now in “sell mode” but we are remaining patient due to our short-term bullish stance on global equities, for now.
Overnight the US indices boomed on the back of comments from the ECB and from President Trump that he will have extended talks with Chinese President Xi at the G20 – equities are definitely trading in a “glass half full mood”. The Dow rallied over 350-points / 1.35% closing less than 2% below its all-time high. The local ASX200 SPI futures are calling the local market to open up another ~40-points with BHP rallying to $41 overseas as iron ore surged.
Today we going to look at 5 major global stocks for any signs / signals that its time to take profits on this almost rampant bull market.
ASX200 Chart
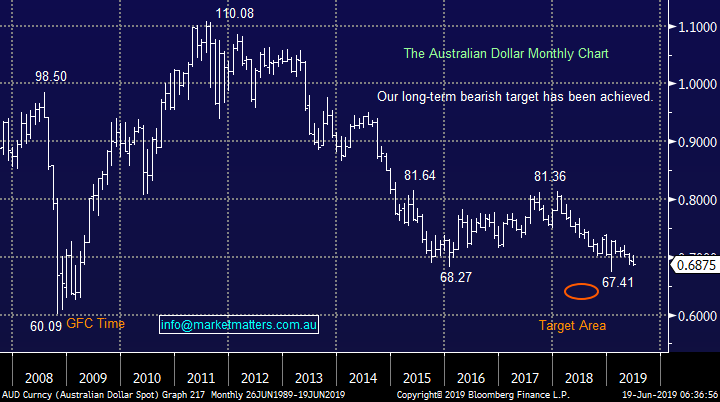
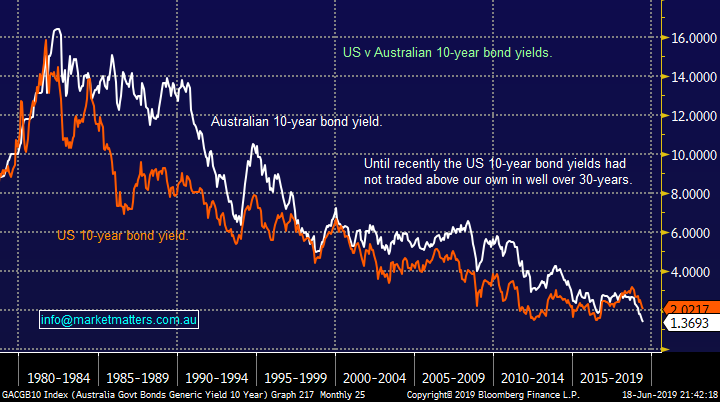
Talking about bond yields is almost becoming boring but when it’s the fuel driving the current equities bull market they cannot be ignored, neither can their flow on impact across other markets. The interest rate differential between Australia and the US is driving down the “little Aussie battler” which now looks destined to make fresh post GFC lows. The race to the bottom by the respective 10-year bond yields is being won by our own which are yielding 1.37% compared to the US equivalent who are still over 2% - investors are being rewarded to hold $US for one of the few times in decades.
At MM we remain keen buyers of the $A into fresh post GFC lows – a VERY contrarian opinion.
Australian Dollar ($A) Chart
Australian & US 10-year bond yields Chart
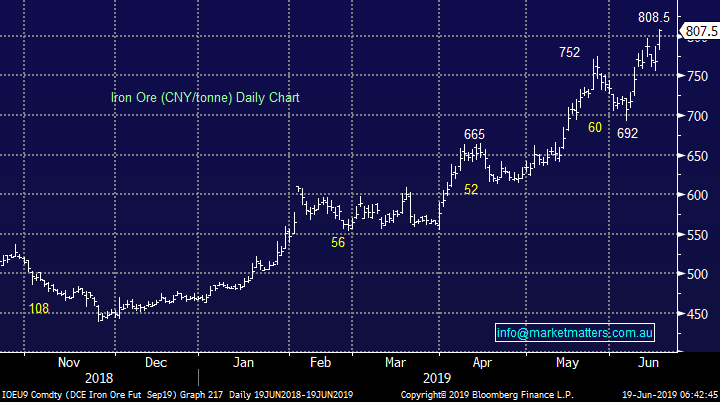
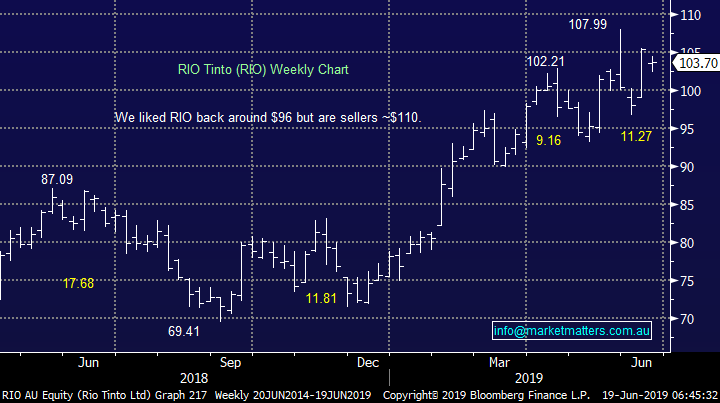
When you look at the chart below of iron ore it’s easy to comprehend why it’s been the point of much discussion in 2019 and the last 24-hours 5% surge to fresh highs has obviously caught our attention. However the markets starting be get that “panic buying” feel about it and we have no interest chasing the sector at current levels, especially with heavyweight RIO now only ~6% from our target area.
MM believes the iron ore sector is one to sell into ongoing strength
Iron Ore (CNY/tonne) Chart
RIO Tinto (RIO) Chart
Evaluating 5 major overseas stocks
Today we have simply evaluated 5 major global stocks for when / if it’s time to start locking in some profits. As we touched on last week the current rally is being fuelled by the “big end” of town and today we’ve maintained that theme while making a point of looking at some different regions of the globe.
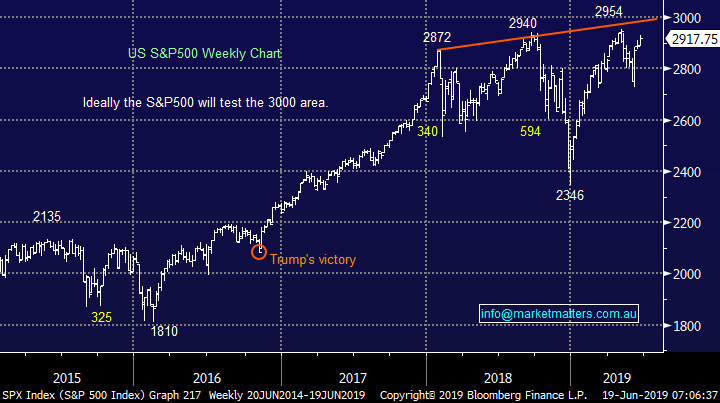
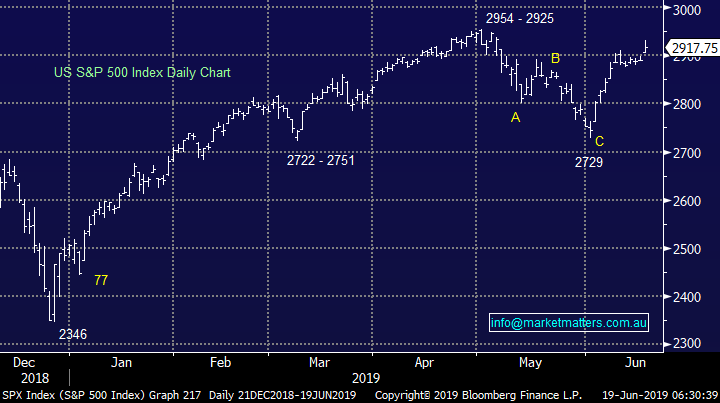
Our feeling remains that the “cashed up” fund managers need to be squeezed a little further before the market will become primed for a potential correction i.e. markets don’t fall when investors aren’t long. However we have maintained this view for a while targeting the 3000 area for the US S&P5000 hence we are mindful that we are now within 3%of this milestone.
Overall MM remains bullish US stocks short-term targeting the psychological 3000 area, less than 3% higher.
US S&P500 Index Chart
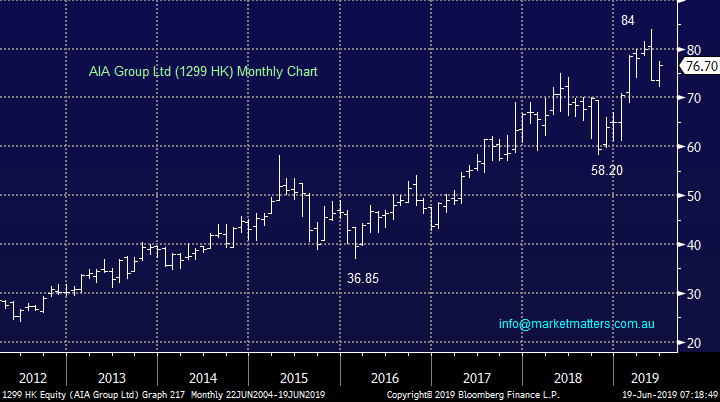
1 AIA Group (1299 HK) HK76.70
Hong Kong based insurance and financial services company AIA Group has rallied strongly over recent years but like many Asian equities it has struggled recently under pressure from fears around US – China trade. Last month the company announced 18% growth in the value of its new business to $US1,169m while margins also increased by over 4%, undoubtedly a great set of numbers and the company’s current Est P/E of 18.3x for 2019 is not lofty by any means.
However the stock makes up a large part of Asian / Emerging market ETF’s putting its shares at the mercy of the day to day views of the region by traders and investors alike. One of the biggest issues for Emerging Markets over the last 18-months has been the strong $US which causes issues for both the countries and companies who have borrowed money denominated in the greenback i.e. repayments go up in terms of the local currency. If we are correct at MM this trend is mature and the region may be set for a period of outperformance which should be relatively good news for AIA.
Technically AIA looks vulnerable to a further ~10% downside fall which is obviously a concern.
MM has no interest in AIA at current levels but we like the business.
AIA Group (1299 HK) Chart
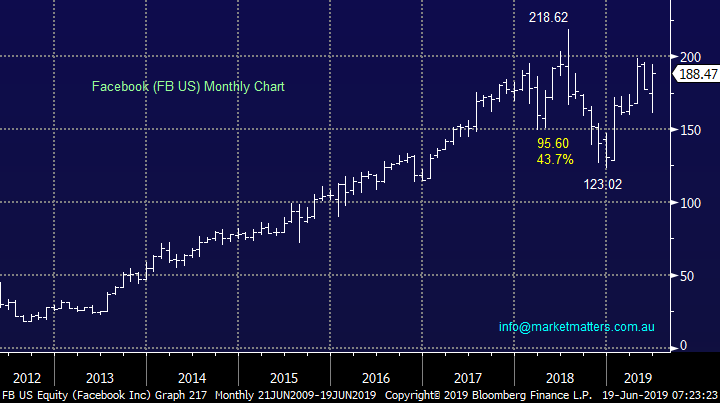
2 Facebook (FB US) $US188.47.
Facebook has rallied an impressive 8% over the last 5 trading days but overnight it was actually down while the market boomed around it. The company basically knows everything about anybody and they’re using that information to generate advertising dollars. While the power of their platform is undeniable there is almost certainly going to be ongoing concerns around privacy and that remains a worry to us.
Technically we can still see fresh all-time highs by FB but the risk / reward is not too exciting at this point in time.
Interestingly overnight they announced a plan to compete with global banks by creating a cryptocurrency called Libra – a payments system powered by blockchain and a digital wallet, as a stepping stone before moving into lending. We are unsure if FB will be successful in this big picture idea but we do believe somebody will with Apple and Google other goliaths that come to mind.
MM is mildly bullish FB targeting fresh 2019 highs.
Facebook (FB US) Chart
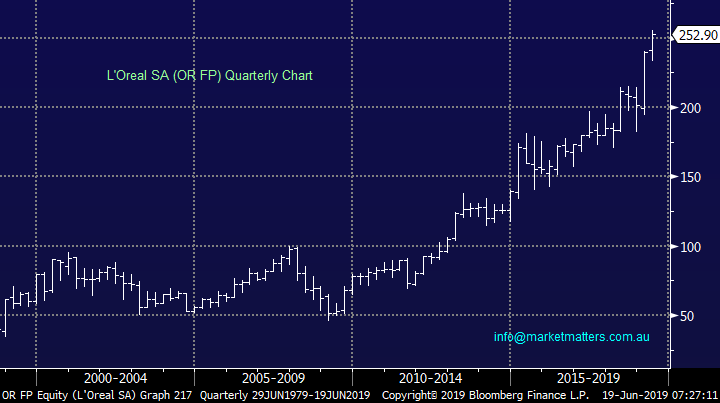
3 L’Oréal (OR FP) Eur252.90
Cosmetics giant L’Oréal has been rallying in an almost uninterrupted fashion since the GFC making it hard to currently identify a good risk / reward entry opportunity. In April the company’s sales again beat forecasts coming in up 11.4% at Euro7.6bn with Asia the driver of growth.
Technically the stock obviously looks good but we feel patience is warranted at present – when you see this stocks appreciation it’s easier, only just, to comprehend how Kylie Jenner (Kardashian clan) became the world’s youngest billionaire courtesy of a successful make up line.
MM is mildly bullish L’Oréal but need a correction to establish value & risk / reward.
L’Oréal SA (OR FP) Chart
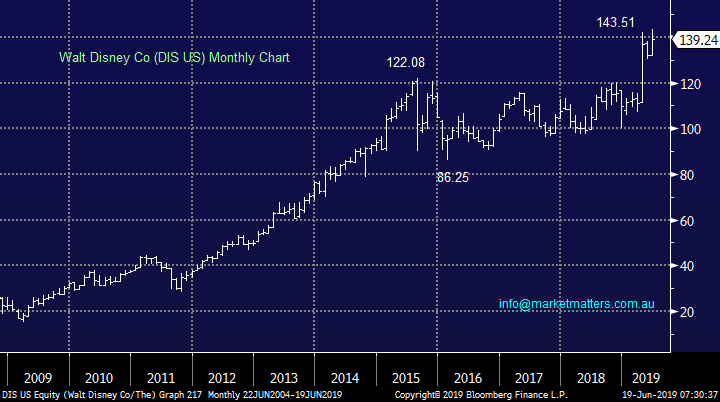
4 Walt Disney Co (DIS US) $US139.24
Walt Disney has popped higher in 2019 but the stock actually received a downgrade this week from Imperial Capital arguing the stock had run ahead of itself. The company has rallied more than 30% over the last 12-months clearly outperforming the S&P500 but its in a hot sector which always helps.
The stock is now trading on projected 21x earnings leaving room for disappointment, or just a period of consolidation. This year will see DIS look to integrate its major entertainment acquisitions from FOX and gain traction from its new Star Wars attractions, investors need to watch out for what’s next to keep the momentum rolling.
Technically the market looks ok but a close under $US120 would clearly be a major concern.
MM is neutral but wary DIS at current levels.
Walt Disney Co (DIS US) Chart
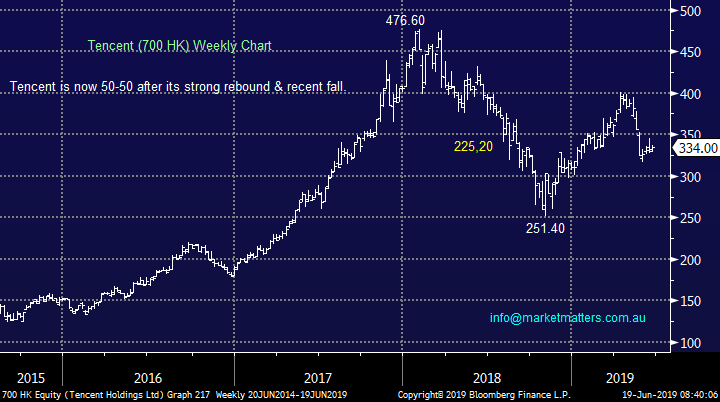
5 Tencent (700 KH) HK334
In 2018 almost $US130bn was wiped off Tencent’s value because of a clampdown from Chinese regulators on the approvals of new computer games. Following a decent recovery Tencent has again suffered badly in recent weeks as concerns have risen around US – China trade. Another major member of Asian / Emerging markets ETF’s which often moves in step with AIA Group.
The company has announced a buyback of a whopping 10% of its stock although no timeframe has been announced. However its first quarter report for 2019 showed the slowest revenue growth since the business listed but it did still grow revenue 16% to $US12.7bn, a figure most companies would dream of. The worries around trade and slowing growth feel likely to push the stock around in the quarters to come.
We like the business but a P/E of 30x is not cheap, we now prefer the thought of accumulating into weakness leaving ammunition for any panic spikes to the downside.
MM is neutral Tencent at current levels.
Tencent (700 HK) Chart
Conclusion
Of the 5 stocks we looked at today none gave us strong reason to buy or sell.
However we do believe there’s a macro play looming in 2019 where emerging markets will outperform the US but it’s not time just yet.
Global Indices
US stocks enjoyed a strong night and we still anticipate the market will be higher over the next few weeks.
We still see fresh all-time highs by US stocks in 2019.
US S&P500 Index Chart
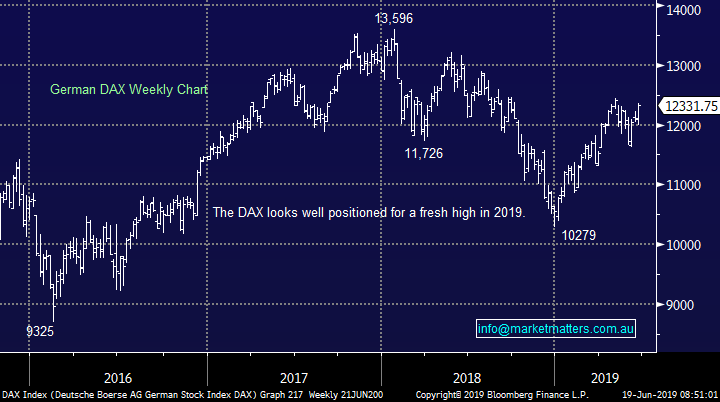
No change with European indices, we remain cautious in this region although we are slowly becoming more optimistic.
German DAX Chart
Overnight Market Matters Wrap
· Risk is back on across the globe, as investors reweight their portfolios after the ECB pledged more stimulus in the European region while we expect a rate cut in both the US and Australia in the near future.
· All metals on the LME rallied, while iron ore soared. Crude oil jumped as OPEC settles on a date for their next meeting and US inventories fell.
· BHP is expected to outperform the broader market after ending its US session up an equivalent of 2.03% from Australia’s previous close.
· The June SPI Futures is indicating the ASX 200 to open 44 points higher, testing the 6615 level this morning.
Have a great day!
James & the Market Matters Team
Disclosure
Market Matters may hold stocks mentioned in this report. Subscribers can view a full list of holdings on the website by clicking here. Positions are updated each Friday, or after the session when positions are traded.
Disclaimer
All figures contained from sources believed to be accurate. Market Matters does not make any representation of warranty as to the accuracy of the figures and disclaims any liability resulting from any inaccuracy. Prices as at 19/06/2019
Reports and other documents published on this website and email (‘Reports’) are authored by Market Matters and the reports represent the views of Market Matters. The MarketMatters Report is based on technical analysis of companies, commodities and the market in general. Technical analysis focuses on interpreting charts and other data to determine what the market sentiment about a particular financial product is, or will be. Unlike fundamental analysis, it does not involve a detailed review of the company’s financial position.
The Reports contain general, as opposed to personal, advice. That means they are prepared for multiple distributions without consideration of your investment objectives, financial situation and needs (‘Personal Circumstances’). Accordingly, any advice given is not a recommendation that a particular course of action is suitable for you and the advice is therefore not to be acted on as investment advice. You must assess whether or not any advice is appropriate for your Personal Circumstances before making any investment decisions. You can either make this assessment yourself, or if you require a personal recommendation, you can seek the assistance of a financial advisor. Market Matters or its author(s) accepts no responsibility for any losses or damages resulting from decisions made from or because of information within this publication. Investing and trading in financial products are always risky, so you should do your own research before buying or selling a financial product.
The Reports are published by Market Matters in good faith based on the facts known to it at the time of their preparation and do not purport to contain all relevant information with respect to the financial products to which they relate. Although the Reports are based on information obtained from sources believed to be reliable, Market Matters does not make any representation or warranty that they are accurate, complete or up to date and Market Matters accepts no obligation to correct or update the information or opinions in the Reports. Market Matters may publish content sourced from external content providers.
If you rely on a Report, you do so at your own risk. Past performance is not an indication of future performance. Any projections are estimates only and may not be realised in the future. Except to the extent that liability under any law cannot be excluded, Market Matters disclaims liability for all loss or damage arising as a result of any opinion, advice, recommendation, representation or information expressly or impliedly published in or in relation to this report notwithstanding any error or omission including negligence.