Our second look at international fast food stocks (TLS, WBC, YUMC US, DPZ US, DNKN US, WEN US, SHAK US)
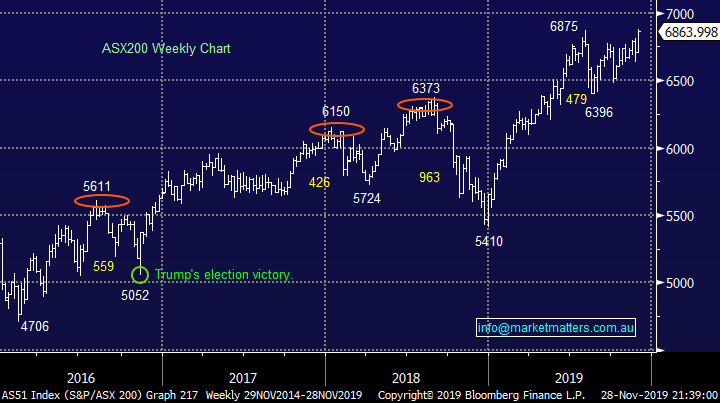
The ASX200 made fresh all-time highs yesterday in an almost stealth like manner, the index finally closed up just 13-points at 6864. A very strong performance in our opinion when we consider the US futures dipped aggressively during our day session as President Trump stirred the “trade war” pot by signing a bill supporting the Hong Kong protestors, not a particularly conciliatory move towards China at this important period in the ongoing trade negotiations.
The anticipated interest rate cuts for 2020 by the RBA continue to fuel the longest bull market in history, stocks feel very comfortable climbing their wall of worry and we believe the “worry” is rapidly being transferred to 2 very different groups of investors:
1 – Stock market players who moved to cash way too early in 2019 who continue to “hope / expect” a major pullback to buy back into equities at cheaper levels.
2 – Investors who rely on the income from fixed interest to live day to day, very scary considering term deposits look set to fall below 1% next year.
MM can still see a test of the psychological 7000 area in 2019, hardly a big call now it’s less than 2% away. Unfortunately too many people keep asking when the market will crash / fail etc but in our experience tops are usually formed during periods of optimism / euphoria, not when lots of people are expecting them. Perhaps when / if we soar to fresh all-time highs ~7000 the risks will increase on the downside i.e. People need to be long for a market to meaningfully correct.
Following yesterday’s fresh all-time high by the ASX200 the market remains a buy technically with stops under 6800 – less than 1% risk.
Overnight US markets were closed for Thanksgiving and Friday will be a half day, however the SPI futures are calling the local market to open up ~30-points, probably enjoying the US futures not following through on the downside after Trumps actions around Hong Kong.
This morning MM has followed on from Wednesdays look at the largest 5 fast food businesses with our promised look at the players occupying spots 5-10.
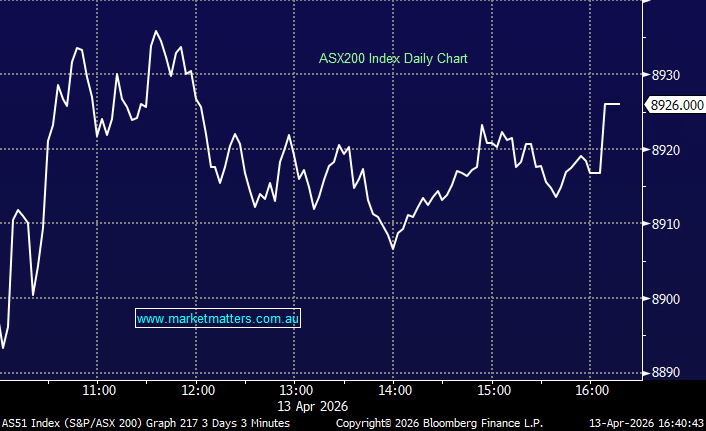
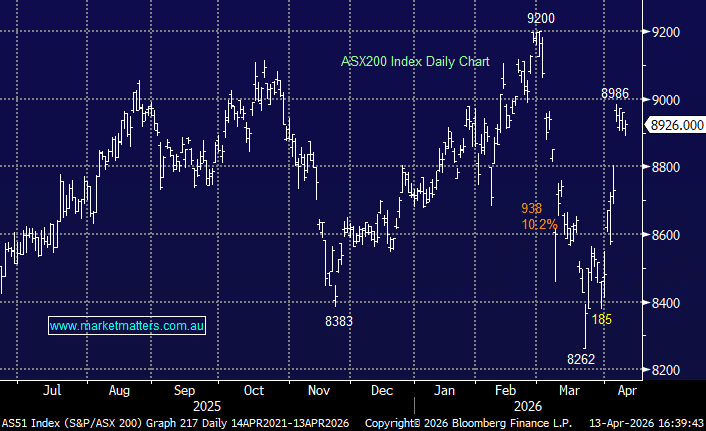
ASX200 Chart
Has Telstra (TLS) turned the corner?
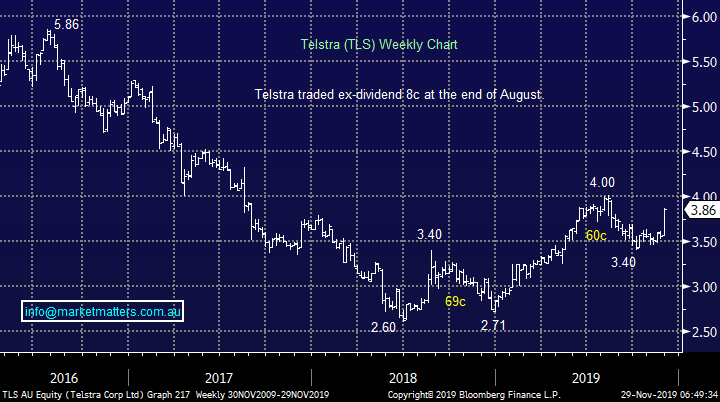
Telstra (TLS) has enjoyed a strong week rallying 30c, or + 8.4% as it embraces a number of broker upgrades courtesy of a reduction in long-term capex estimates however with targets now around the $4 only ~4% away this particular tailwind is likely to diminish. Overall the lack of any bad news for Australia’s largest Telco and comments this week citing potential NBN concessions for the company is good news, plus of course they are well positioned with their 5G expansion since TPG Telecom pulled out of the area.
Lastly the market has been re-rating equity valuations higher for solid / reliable dividend paying stocks and TLS has been left behind, it simply feels like time for some catch up. TLS is trading on an Est. P/E for 2020 of 18.7x while its forecast to yield 4.14% fully franked. To give some context here, over the past 5 years TLS has oscillated between a pessimistic P/E of just 8.9x while the market’s optimistic multiple has been 19.1 times, clearly at 18.7x there is now some decent optimism baked into the TLS cake. The last time Telstra demanded such a high multiple was in March of 2015 when the stock was trading ~$6.50 before tracking down to a $2.60 low. Importantly, in March of 2015 the RBA cash rate was 2.25% versus 0.75% today – if there’s a time that TLS can handle an elevated multiple, it's now!
The stock looks good technically with stops below $3.60 – not exciting risk / reward after this week’s move.
MM is now bullish TLS, initially targeting another ~8% upside.
Telstra (TLS) Chart
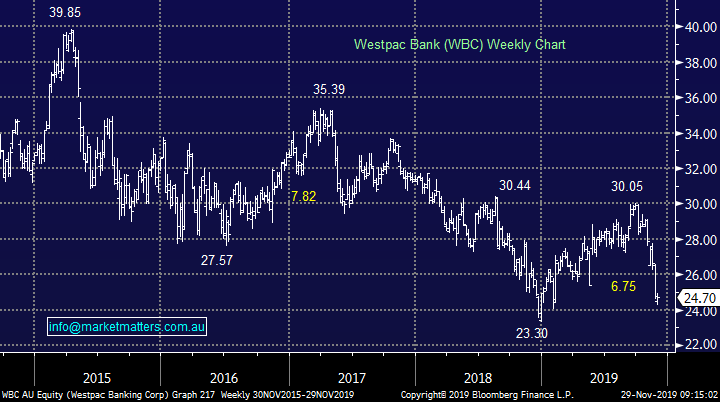
Westpac (WBC) $24.70 – Share Purchase Plan (SPP)
The WBC SPP pricing period closes on Monday afternoon with stock being issued at a 2% discount to the volume weighted average price (VWAP) during the pricing period, which opened on the 26th November & will close on the 2nd December. Obviously two questions to ask here. What’s the price going to be and should we participate?
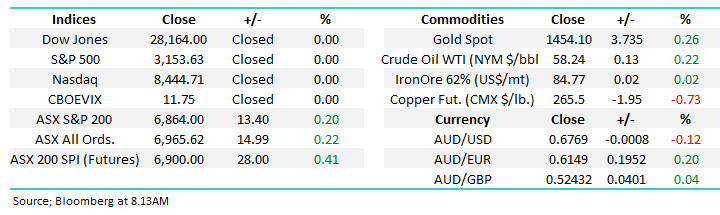
1. Price: Current VWAP is $24.75 as per below from 26th – 28th Nov. If the SPP was priced today, shares would be allotted at $24.25 however that will change between now and Monday’s close. We will provide this number on Monday morning & again in the afternoon.

Source: Bloomberg
2. Should we add more Westpac? This comes down to position size and risk. If we held 5%, we’d certainly increase our weighting, given we have 9% in the Growth Portfolio we are not going to participate in the SPP.
Westpac (WBC) Chart
Reviewing 5 more US Food Distribution Businesses
On Wednesday MM looked at the world’s 5 largest fast-food stocks, today as promised we have looked at numbers 5 to 10 and wow what a difference in size. These 5 companies have a combined market cap of under $US40bn, compared to Macca’s which sits on top on the pile with a market cap over 400% larger!
Todays 5 stocks are again mostly household names but their growth profiles, while largely impressive are not on the same scale as the likes of McDonalds and Starbuck’s - but with smaller size comes potential opportunity to grow if the mix is correct.
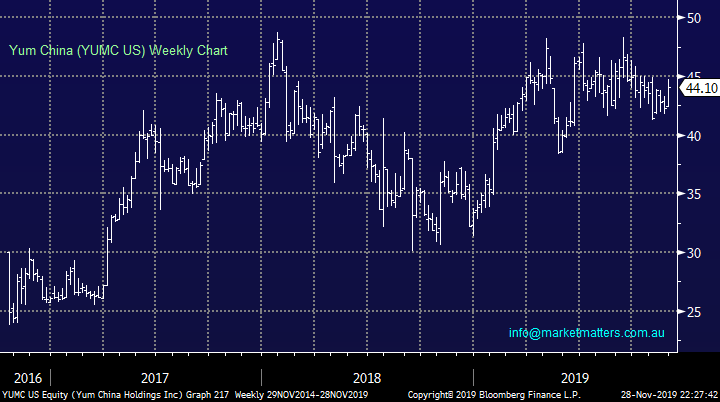
6 Yum China (YUMC US) $US44.10
Yum China is the fresh listed face in the sector following its spin-off from Yum! Brands (YUM US). YUMC is the largest restaurant business in China with well over 8000 locations already operational with clearly plenty of room for expansion, although they did commence over 40-years ago so don’t get confused that it’s a new operation– while they run the same names as the parent business like KFC and Taco Bell they also have some region specific businesses like Little Sheep and East Dawning.
Pure economies of scale as China’s middle class grows at a phenomenal rate is good news for YUMC and we believe the outlook is rosy assuming management maintains its finger on the pulse of the Chinese consumer.
MM likes YUMC after its 15% correction.
Yum China (YUMC US) Chart
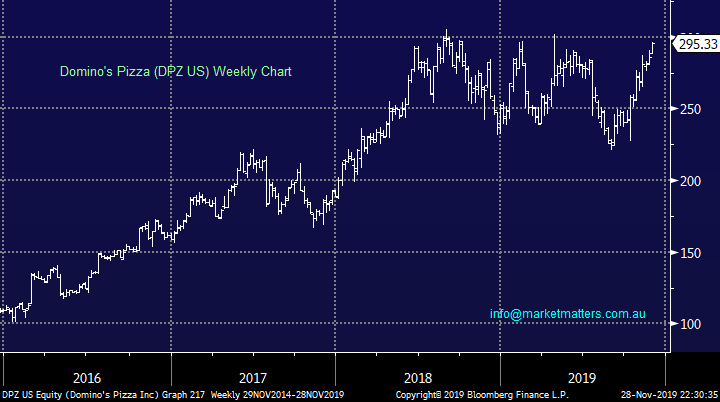
7 Domino’s Pizza (DPZ US) $US295.33
Domino’s has been a huge success on a global scale with annual sales now ~$5bn, that’s a lot of pizza! This is a phenomenal example of a extremely well run business considering the number of small pizza operators on many street corners i.e. there is low cost of entry to compete.
DPZ is simply an ultra-efficient business which employs pinpoint marketing and innovation like its “hot-spot” program to keep ahead of the pack, especially as we said on the delivery front to numerous destinations. Our main concern is what next as the competition learn and copy from the best, keeping ahead of the field by a decent margin is rarely easy but Dominos have proved to be experts to-date.
MM is bullish DPZ targeting fresh all-time highs short-term.
Domino’s Pizza (DPZ US) Chart
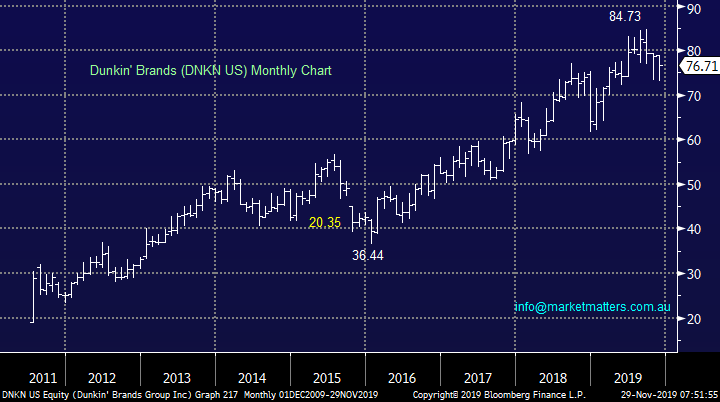
8 Dunkin’ Brands (DNKN US) $US76.71
For someone that’s not a fan of the product I’m impressed that DNKN have a store footprint of well over 20,000 venues, a $US7bn business proves my taste buds are in the minority! Approximately half of the venues are in the US showing the Dunkin’ and Baskin-Robbins brands have made a solid footprint globally. However we believe it’s well behind Starbucks on a number of levels making further rapid expansion a tricky business.
Technically a pullback of ~10% is our preferred scenario.
MM is neutral / bearish DNKN.
Dunkin’ Brands (DNKN US) Chart
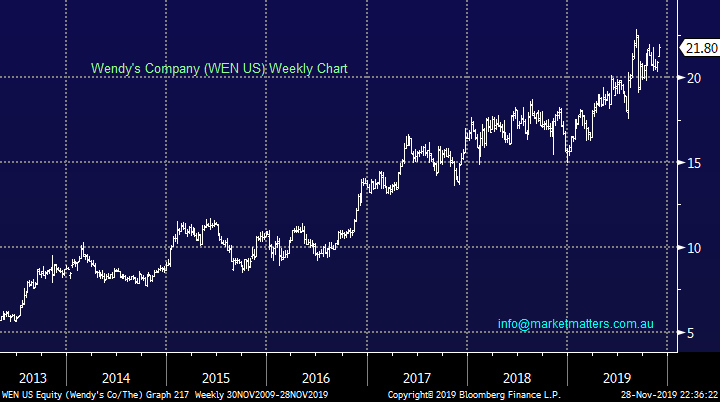
9 The Wendy’s Company (WEN US) $US21.80
WEN is the 3rd largest of the burger chain restaurants with 7,000 venues compared to McDonalds which has over 36,000, WEN is all about convenience like its rivals with close to 70% of its sales made at the drive through window.
At this stage we can see no clear plan / strategy by the board to take some of the market share from its competitors.
MM is neutral to slightly positive WEN.
The Wendy’s Company (WEN US) Chart
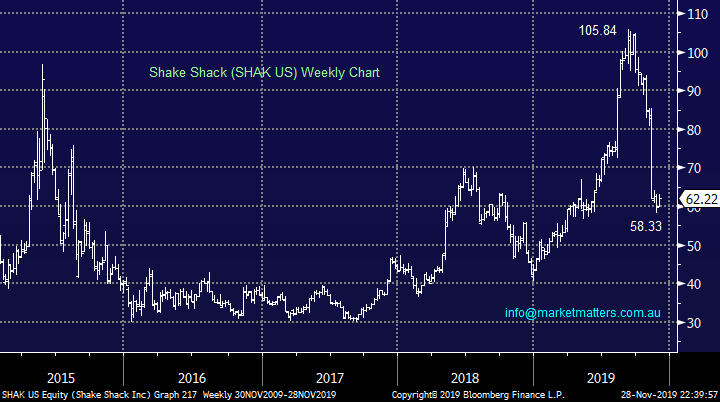
10 Shake Shack (SHAK US) $US62.22
SHAK is the new kid on the burger block pushing “quality burgers” but with just over 70 locations its clearly extremely early days to know if the stock will succeed, or fail.
At this stage there are a number of concerns for the businesses including slow growth for its existing restaurants and margins which are likely to slip as second tier venues come on stream – the share prices recent plunge illustrates the market shares our concerns.
MM is neutral / negative SHAK.
Shake Shack (SHAK US) Chart
Conclusion (s)
Of the 5 stocks looked at today MM likes YUMC and DPZ.
Global Indices
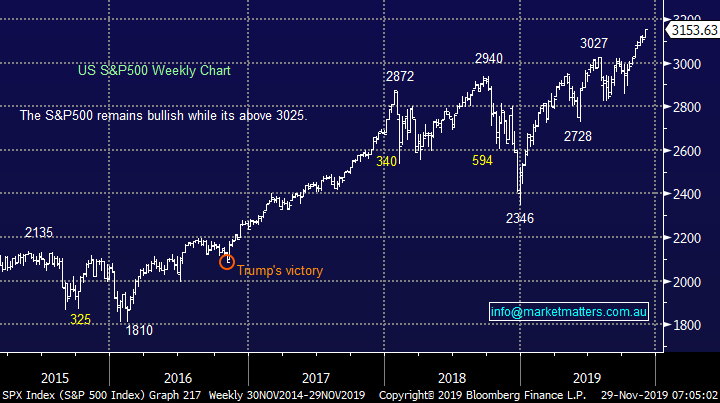
No change, we had given the benefit of the doubt to the post GFC bull market and fresh all-time highs have been achieved as anticipated, a close well under 3025 is required for the S&P500 to switch us to a bearish short-term stance.
MM remains now neutral / positive US stocks.
US S&P500 Index Chart
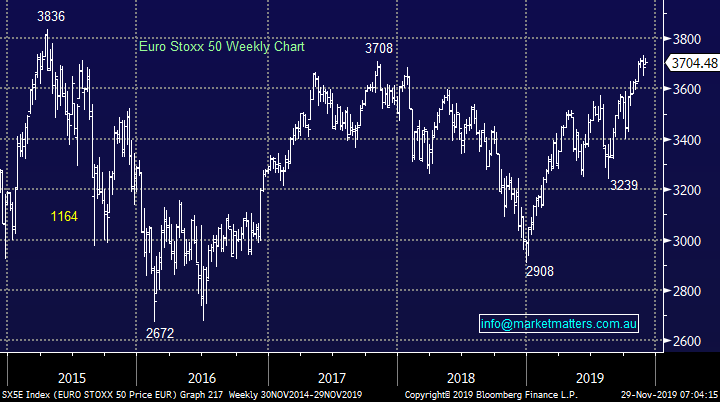
European indices continue to “climb a wall of worry” at this point in time MM is neutral but we maintain our slight positive bias with a target ~5% higher looking realistic.
EuroStoxx50 Chart
Overnight Market Matters Wrap
- With US markets closed for the Thanksgiving holiday, European equities drifted lower and bonds rose overnight after President Trump signed legislation backing the Hong Kong protestors, a move which has upset the Chinese authorities and fuelled concerns it could undermine the current US-China trade negotiations.
- The three key European equity markets, the UK FTSE, the German DAX and the French CAC all fell between 0.2% and 0.3% as investors digested the implications of the Bill for the US-China trade dispute. Asian markets also fell yesterday following the signing of the bill, with the Chinese market down nearly 0.5%.
- Euro zone economic sentiment rebounded in November with a slightly better than expected read of 101.3. And in the UK, polls indicate that Prime Minister Boris Johnson is set to win a majority of 68 seats in the upcoming December 12th election.
- The commodity markets were mixed with iron ore rising back above US$88/tonne, gold slightly firmer but oil and base metals weaker.
- The December SPI Futures is indicating the ASX 200 to end the month on fresh all-time highs, opening around the 6900 level this morning.
Have a great day!
James & the Market Matters Team
Disclosure
Market Matters may hold stocks mentioned in this report. Subscribers can view a full list of holdings on the website by clicking here. Positions are updated each Friday, or after the session when positions are traded.
Disclaimer
All figures contained from sources believed to be accurate. All prices stated are based on the last close price at the time of writing unless otherwise noted. Market Matters does not make any representation of warranty as to the accuracy of the figures or prices and disclaims any liability resulting from any inaccuracy.
Reports and other documents published on this website and email (‘Reports’) are authored by Market Matters and the reports represent the views of Market Matters. The Market Matters Report is based on technical analysis of companies, commodities and the market in general. Technical analysis focuses on interpreting charts and other data to determine what the market sentiment about a particular financial product is, or will be. Unlike fundamental analysis, it does not involve a detailed review of the company’s financial position.
The Reports contain general, as opposed to personal, advice. That means they are prepared for multiple distributions without consideration of your investment objectives, financial situation and needs (‘Personal Circumstances’). Accordingly, any advice given is not a recommendation that a particular course of action is suitable for you and the advice is therefore not to be acted on as investment advice. You must assess whether or not any advice is appropriate for your Personal Circumstances before making any investment decisions. You can either make this assessment yourself, or if you require a personal recommendation, you can seek the assistance of a financial advisor. Market Matters or its author(s) accepts no responsibility for any losses or damages resulting from decisions made from or because of information within this publication. Investing and trading in financial products are always risky, so you should do your own research before buying or selling a financial product.
The Reports are published by Market Matters in good faith based on the facts known to it at the time of their preparation and do not purport to contain all relevant information with respect to the financial products to which they relate. Although the Reports are based on information obtained from sources believed to be reliable, Market Matters does not make any representation or warranty that they are accurate, complete or up to date and Market Matters accepts no obligation to correct or update the information or opinions in the Reports. Market Matters may publish content sourced from external content providers.
If you rely on a Report, you do so at your own risk. Past performance is not an indication of future performance. Any projections are estimates only and may not be realised in the future. Except to the extent that liability under any law cannot be excluded, Market Matters disclaims liability for all loss or damage arising as a result of any opinion, advice, recommendation, representation or information expressly or impliedly published in or in relation to this report notwithstanding any error or omission including negligence.