More reporting season curve balls to evaluate! (BOQ, ALU, IFL, AOG, BKL, EHL, SAR)
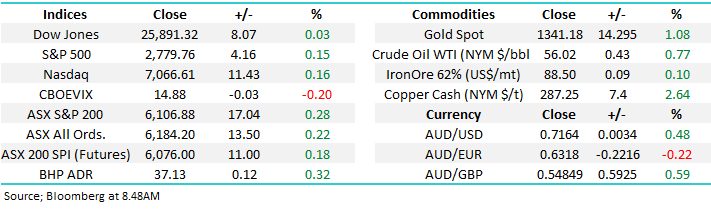
The ASX200 enjoyed another solid day courtesy of big banks with the “big 4” closing up an average of +1.6% while regional Bank of Queensland (BOQ) again experienced a tough day at the office falling another -3.2% - more on this later. The volatility is continuing to be huge this reporting season with 3 stocks in the ASX200 closing up / down over 20% and 12 others moving by over 4% with the losers dominating the numerical scorecard but not exerting the same impact on the index as the banks – remember the big 4 make up over 20% of the ASX200 by market cap. & index influence.
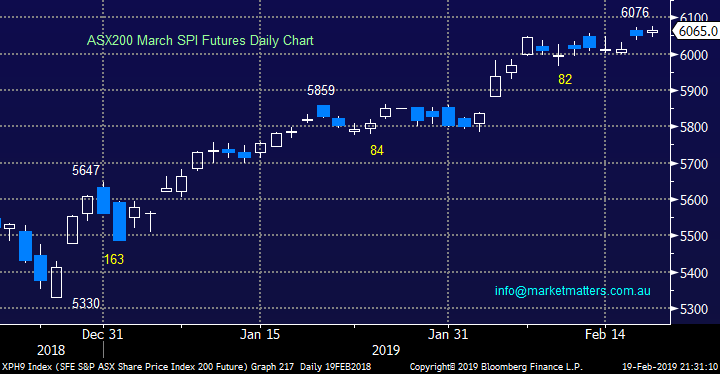
On the day there were actually ~10% more stocks that closed in the red implying a market with diminishing strength but you cannot ignore another fresh high for 2019. The ASX200 futures have so far rallied 292-points this February compared to 375-points in both the previous 2-months implying there could still be some more gas in the tank for the index but it’s a little stretched and frankly boring compared to the action we’re witnessing on the stock level.
MM’s ideal scenario remains a pullback of around 150-points relatively soon but we will be looking to buy this move at least short-term.
MM remains in a patient “buy mode” with relatively elevated cash levels.
Overnight US markets were largely unchanged after giving up most of the day’s gains in the last hours trade - the SPI futures are calling the ASX200 to rally about 10-points early on however results will be the key driver here.
Today we are again going to evaluate 3 of the best and worst stocks from yesterday as this is an environment where we can see ourselves continuing to press both the buy and sell buttons a few times in the coming weeks – on Tuesday we bought Bingo Industries (BIN) and NIB Holdings (NHF) while we sold Cochlear (COH) on Monday.
ASX200 March SPI Futures Chart
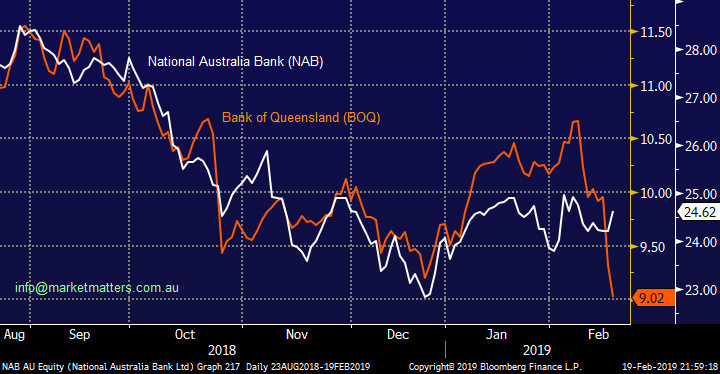
Over the last 5-trading days the Bank of Queensland (BOQ) is now down -9.4% while both NAB and Westpac (WBC) are up over +1.6% - the elastic band is stretching.
Over the last ~10-days the NAB share price is basically unchanged while BOQ has tumbled over 16% yet over the last few years the shares have tracked each other very closely, just as we’ve shown below for the last 6-months.
MM is considering seriously switching part of our NAB position into BOQ.
NB BOQ is now yielding 8.43% fully franked and hence is being considered for the Income Portfolio.
National Australia Bank (ASX: NAB) v Bank of Queensland (ASX: BOQ) Chart
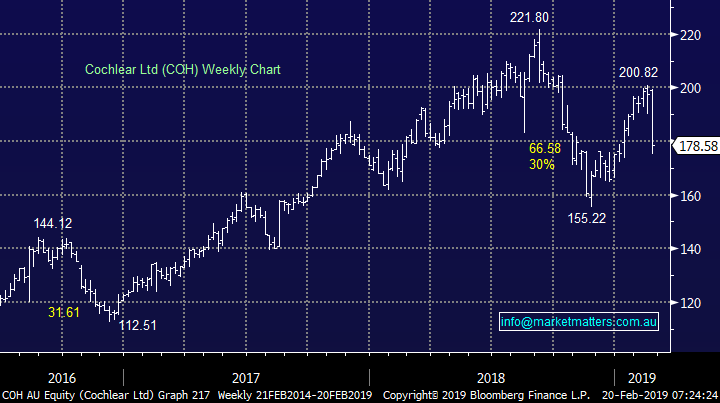
Yesterday Cochlear (COH), which we sold on Monday, disappointed the market when it reported leading to a steep decline of over 8%, very reminiscent of CSL following g its results.
Cochlear has showed significant growth for the first half to meet consensus numbers, but fell short on guidance for the year which has led to the stock falling. Profit for the half was up 16% to $128.6m, just edging out the consensus at $127m, while revenue landed just shy at $711.9m vs $713.5m from the analysts. For the full year, Cochlear maintained guidance of $265m-$275m profit being 8-12% growth on FY18. The market has run ahead of these numbers, with consensus sitting at the top end of the range at $272m.
Part of the issue with guidance wasn’t just the numbers given. One key consideration from the company is “a lower rate of cochlear implant growth across the developed markets for FY19.” Although the company clearly has a large untapped market, competitors are encroaching in on the space and the low hanging fruit seems to be have taken. COH is a growth company that is still growing, but markets get too excited sometimes considering the 5-year average PE of around 31.5x which would price COH at around $162.
At this stage MM will only consider COH below $150 i.e. cheaper than its long term average because of our concern that the $A will rally creating an earnings headwind.
Cochlear (ASX: COH) Chart
Overseas indices
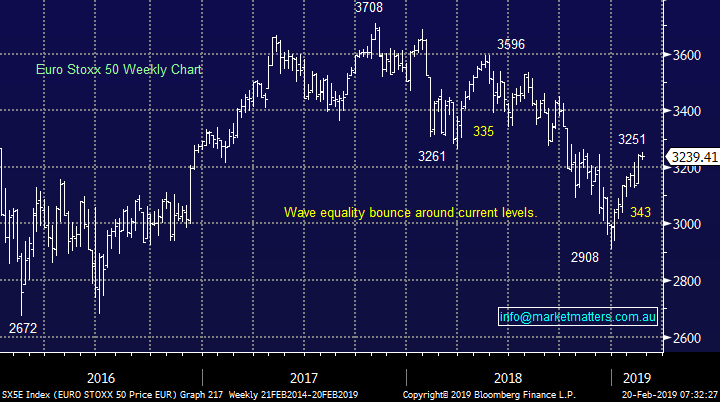
No change after a quiet night overseas, the local market has been far more correlated with European indices than the US post the GFC and importantly following the markets 11% recovery we are now neutral / bearish from a risk / reward basis.
This reaffirms our believe that patience is likely to be rewarded with buying of the market in general – obviously not necessarily on a stock by stock basis.
Euro Stoxx 50 Chart
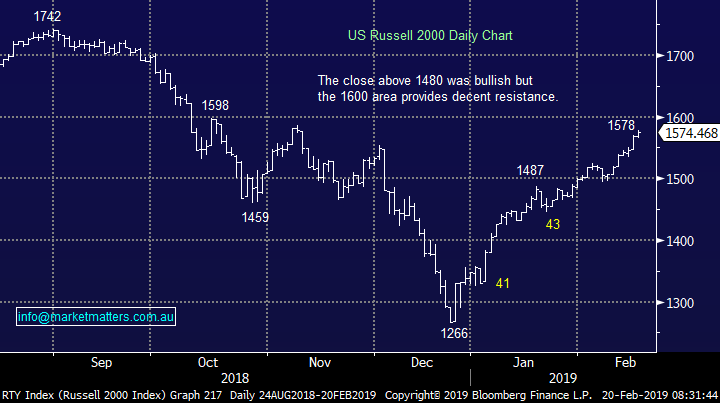
No change, with US markets, we still believe they have a strong risk to the downside with our target ~5-6% lower. The upside momentum appears to be wanning and a lot of good news has been baked into the recent index appreciation.
US Russell 2000 Chart
3 of the best performing stocks.
Yesterday while we saw the market gain 17-points only, four stocks in the ASX200 advanced by over 4% with two of those exploding over 15% - that’s reporting season!
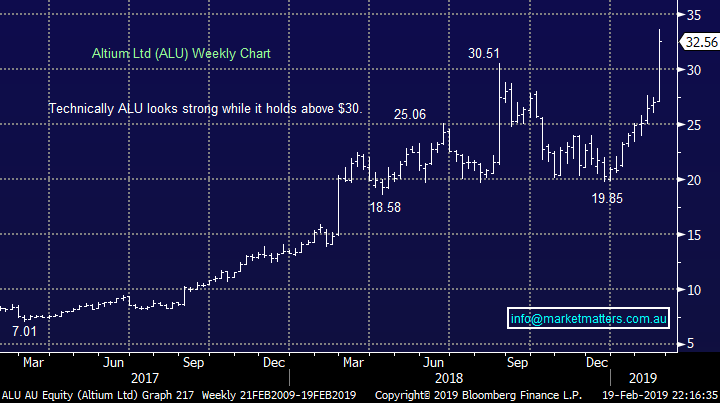
1 Altium (ALU) $32.56
Yesterday ALU rallied over 20% yesterday rubbing salt in our wounds for taking profits too early in both ALU and our other growth plays which we purchased well when the market panicked lower. The electronics PCB software business reported revenue up over 24% to $78.1m versus $77m expected while EBITDA came in at $28.3m versus expectations for $27m (they report in USD).
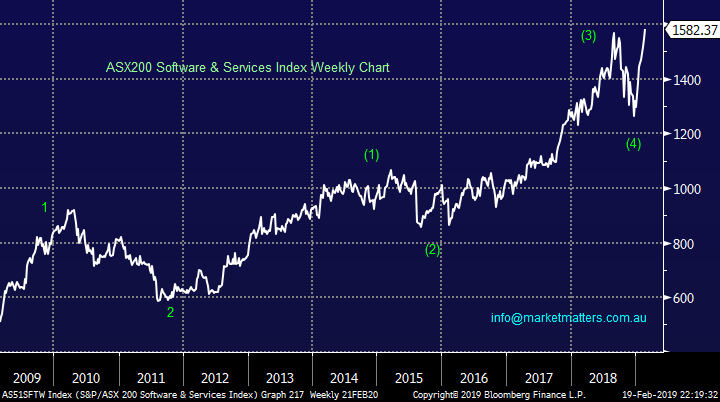
This company is simply shooting the lights out with the board confident of reaching $200m revenue in 2020 helped by Chinese growth which saw revenue up just shy of 50% (the market currently expects $212m by 2020). However, remember our discussion in the Weekend Report around the Software & Services Index, we were anticipating fresh all-time highs but the break looked to have a high risk of failure (see 2nd chart) hence we are not chasing these stocks into their current strength.
MM likes ALU but will be patient
Altium (ASX: ALU) Chart
ASX200 Software & Services Index Chart
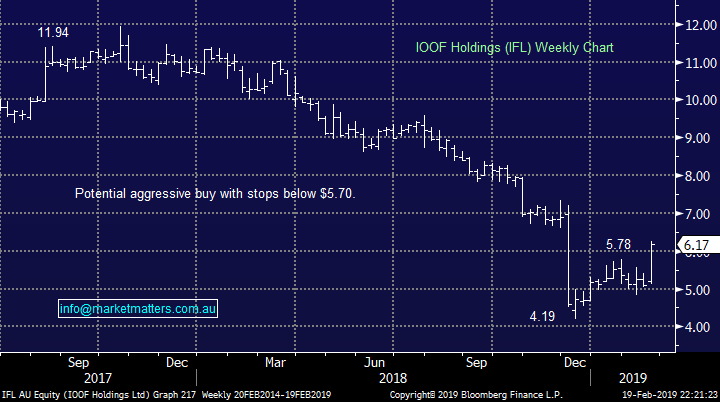
2 IOOF Holdings (IFL) $6.17
Yesterday IFL rallied well over 16% as they relieved the market with some ‘not too bad’ numbers after having been hammered by the Royal Commission and concerns around their ANZ wealth acquisition which underpinned a significant short position of over 8% - its sitting at the 18th most shorted stock, and that would have helped the performance on the day.
One of the dogs of 2018, the wealth management conglomerate saw underlying profit climb 6% to over $100m while funds under management, administration & advice (FUMA) rose 15% to $137.8b. The result wasn’t better than the market, but the negativity surrounding IFL has certainly helped an average result look much better.
The road ahead for IFL is still rocky - there is still the ANZ super business which is due to be taken over by IFL in June, but faces a vote from the current custodians to determine if the transfer of ownership is in the members best interests – tough to determine when a number of the company’s previous executives are facing criminal charges for their handling of the business. A low quality result to us in a business that has a lot of work ahead of it to both be and stay compliant, but also integrate the ANZ acquisitions.
MM will not be chasing this short squeeze.
IOOF Holdings (ASX: IFL) Chart
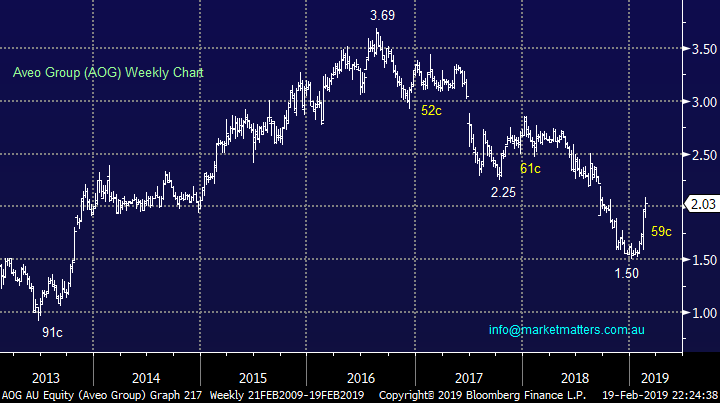
3 Aveo Group (AOG) $25.21
Yesterday Aveo Group (AOG) rallied well over 5% on no apparent news, in fact Morningstar downgraded them to hold from a buy – which shows the clout of their research! However, there have been rumblings of a bid for the property business above $2.50 in the next few months which has clearly got the buyers out and about.
We mentioned AOG a few weeks ago believing a squeeze above $2 was a strong possibility but now its unfolded the risk / reward to us is no longer exciting, unless of course the rumblings prove correct with a sniff of a potential takeover.
MM is neutral AOG at current levels.
Aveo Group (ASX: AOG) Chart
3 of the worst performing stocks.
The losers dominated on the company specific level with 11 stocks falling by over 4%, almost three time more than the winners with some big casualties amongst the declines.
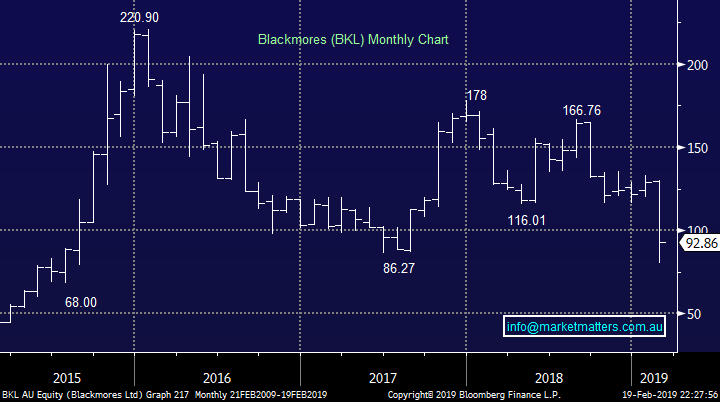
1 Blackmores (BKL) $92.86
Yesterday BKL plummeted by almost 25% with the stock making fresh lows since mid-2015 no doubt pleasing the relatively large short position of ~6.6%.
As suggested yesterday afternoon, I on the tele when BKL’s report was released yesterday and straight off the bat, guidance for flat earnings HoH was a red flag for a stock on a high valuation of 26x. They printed $34m profit in 1H and said 2H would be similar, this equates to $68m for the year v mkt expectations of $80m = SELL. Weak trends here are relevant for other China facing businesses, COH also struggled in China and developing markets. That said, A2 has knocked it out of the park this morning and is trading +8% higher in New Zealand.
MM still has no interest in BKL.
Blackmores (ASX: BKL) Chart
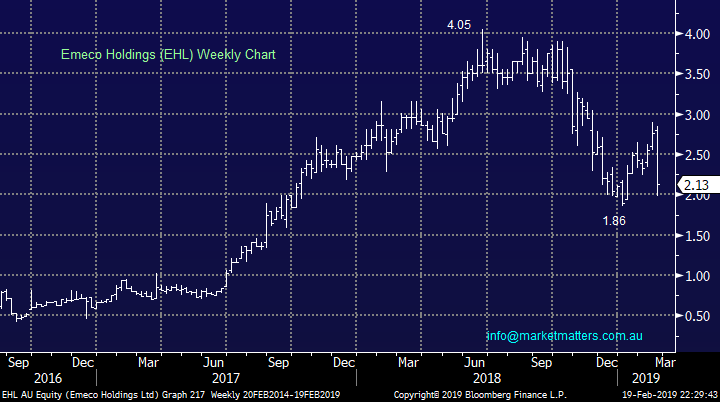
2 Emeco Holdings (EHL) $2.13
Yesterday earth moving equipment hire company Emeco Holdings (EHL) was clobbered over -24% and as I wrote in the afternoon, I wasn’t sure why such a significant hit occurred. After digging into the result which was a complicated one it seems to me the market saw a miss on pretty much every metric and sold first before digging deeper.
As is usual with many mining services companies, the standard litany of one-offs that makes performance of the underlying (core) business really hard to decipher – in this case, asset impairments, redundancy and restructuring costs, acquisition accounting, currency impact and the like had an impact. Dumbing it down, revenue was a 3% miss, adjusted EPS was a 3% miss, they had poor operating cash flow and total debt didn’t drop as much as the market had hoped for.
That said, top line growth was good, margins are expanding and they have better utilisation of their fleet, all things that look good for the future.
MM believes EHL is starting to present value and we will be watching carefully – potentially another 2% “dog” for the Growth Portfolio.
Emeco Holdings (ASX: EHL) Chart
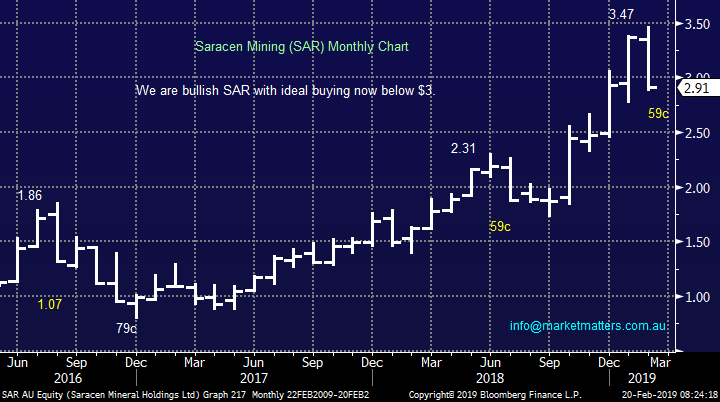
3 Saracen Minerals (SAR) $2.91
Yesterday SAR fell -9.4%, usually huge but overshadowed on the day by the 2 stocks above. The decline was the company’s largest drop since 2016 and can be attributed to first half earnings coming in softer than expected – the recent strong rally in the stock looks to have caught a few investors too long.
The reported net income of $43.7m was down 6% on the year while costs were higher, c not a great combination.
However we identified an ideal entry into SAR below $3 and this was not going to eventuate on a good result.
MM likes this gold explorer / producer around the $2.90 area.
Saracen Minerals (ASX: SAR)) Chart
Conclusion
A few points of interest today:
1 – We are considering BOQ for the Income Portfolio
2 – We like SAR into current weakness.
3 – We are looking more at EHL here with the view to buy
Overnight Market Matters Wrap
· Wall St also continued its recent rally, following reports that President Trump was prepared to extend the US-China tariff deadline beyond March 1st as trade talks continued to go well. All three major US indices closed marginally firmer with Walmart in particular leading the Dow higher, after reporting stronger than expected quarterly numbers.
· The resource sector is expected to outperform the broader market on the back of the expected extension of the US-China tariff deadline, with BHP ending its US session up an equivalent of 0.32% from Australia’s previous close.
· The March SPI Futures is indicating the ASX 200 to open 13 points higher towards the 6120 level this morning on as earnings season kicks up another gear today, being the busiest day of the February reporting calendar with results from leading companies including Woolworths (WOW), APA, Dominos (DMP), Fortescue (FMG), Scentre Group (SCG), Stockland (SGP), Western Areas (WSA) and Worley Parsons (WOR).
Have a great day!
James & the Market Matters Team
Disclosure
Market Matters may hold stocks mentioned in this report. Subscribers can view a full list of holdings on the website by clicking here. Positions are updated each Friday, or after the session when positions are traded.
Disclaimer
All figures contained from sources believed to be accurate. Market Matters does not make any representation of warranty as to the accuracy of the figures and disclaims any liability resulting from any inaccuracy. Prices as at 20/02/2019
Reports and other documents published on this website and email (‘Reports’) are authored by Market Matters and the reports represent the views of Market Matters. The MarketMatters Report is based on technical analysis of companies, commodities and the market in general. Technical analysis focuses on interpreting charts and other data to determine what the market sentiment about a particular financial product is, or will be. Unlike fundamental analysis, it does not involve a detailed review of the company’s financial position.
The Reports contain general, as opposed to personal, advice. That means they are prepared for multiple distributions without consideration of your investment objectives, financial situation and needs (‘Personal Circumstances’). Accordingly, any advice given is not a recommendation that a particular course of action is suitable for you and the advice is therefore not to be acted on as investment advice. You must assess whether or not any advice is appropriate for your Personal Circumstances before making any investment decisions. You can either make this assessment yourself, or if you require a personal recommendation, you can seek the assistance of a financial advisor. Market Matters or its author(s) accepts no responsibility for any losses or damages resulting from decisions made from or because of information within this publication. Investing and trading in financial products are always risky, so you should do your own research before buying or selling a financial product.
The Reports are published by Market Matters in good faith based on the facts known to it at the time of their preparation and do not purport to contain all relevant information with respect to the financial products to which they relate. Although the Reports are based on information obtained from sources believed to be reliable, Market Matters does not make any representation or warranty that they are accurate, complete or up to date and Market Matters accepts no obligation to correct or update the information or opinions in the Reports. Market Matters may publish content sourced from external content providers.
If you rely on a Report, you do so at your own risk. Past performance is not an indication of future performance. Any projections are estimates only and may not be realised in the future. Except to the extent that liability under any law cannot be excluded, Market Matters disclaims liability for all loss or damage arising as a result of any opinion, advice, recommendation, representation or information expressly or impliedly published in or in relation to this report notwithstanding any error or omission including negligence.


