MM’s roadmap as Italian concern’s fade – don’t panic yet! (CBA, ORG, TLS, BHP)
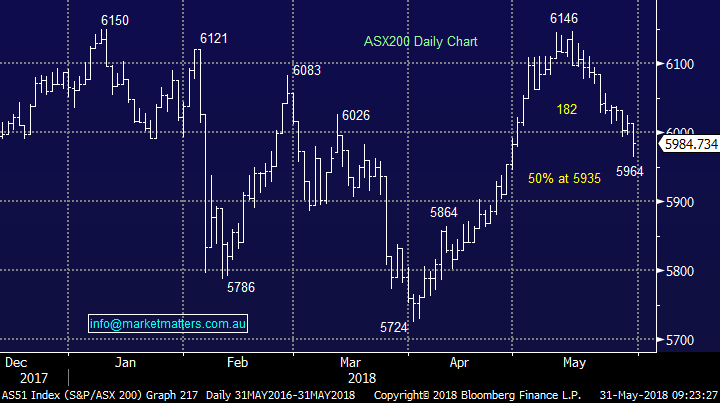
Although the ASX200 touched a fresh month low yesterday it put in a pretty solid / resilient performance closing down less than -0.5% compared to other major global indices which virtually all tumbled around three times more e.g. Dow -1.6%, Japans Nikkei -1.5%, Hong Kong’s Hang Seng -1.4%, China -2.5% and German DAX -1.5%.
While financial stocks received the brunt of the selling, just like they did internationally, what caught our eye was the strong buying that returned to the China facing stocks e.g. Bellamy’s (BAL) +5.6% and A2 Milk (A2M) +3.43%, we question whether this is MSCI buying into months end, or a return to favour for the recently very volatile sector.
The local market has now taken 12-days to correct 182-points / 3%, at an average of only 15-points per session, overall this still feels like a correction of the 421-point / 7.3% rally from the start of April, as opposed to an impulsive change in trend - an optimistic call I know going into June but the market still feels ok to us. That said, we are far from complacent.
The average return for the All Ords during May over the last 10-years is -2.2% but with only today left in 2018 its set to close in the black, time will tell if it can also shrug off the average return for June over the same period which is -2.5%. We also note that the resources usually struggle in June as opposed to the banks e.g. again over the last 10-years CBA has averaged +1.3% while BHP has fallen -2.9%.
· MM remains mildly bullish ideally targeting ~6250 for the ASX200 BUT we remain in “sell mode”.
Overnight markets have performed an almost perfect back-flip to the previous Italian induced panic selling as the 3rd largest European economy found strong appetite for its debt issue putting the Eurozone’s existence onto the back burner for now, to us it feels like another potential catalyst for a stock market correction moving forward but the upside momentum remains intact as does the trend of increasing volatility in 2018.
Today’s report is going to update our general market thoughts as volatility spikes are challenging the nerves of many investors / subscribers – we’ve quickly looked at a few specific sectors and stocks to give subscribers a clear understanding of our views today.
ASX200 Chart
How we see stocks & sectors through 2018/9
Local Index
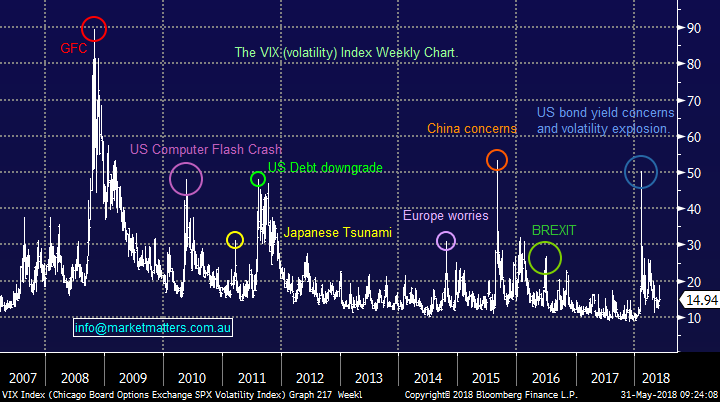
I think I’m correct when I say that volatility feels very elevated so far in 2018 but really it is only when you compare it to the calm markets enjoyed in the second half of 2016 and through 2017.
Since the peak of the GFC panic in late 2008 we’ve had 7 standout, event driven, spikes in volatility noted on the following chart. As would be expected they clump together in 2010-11 and 2015-16, just when global stocks experienced decent corrections influenced by the said macro events.
At MM we believe the next major volatility spike will be the catalyst that heralds the start of a ~20% correction for global stocks – for the first time in a while it will NOT be an event to “fade”.
Volatility / Fear Index (VIX) Chart
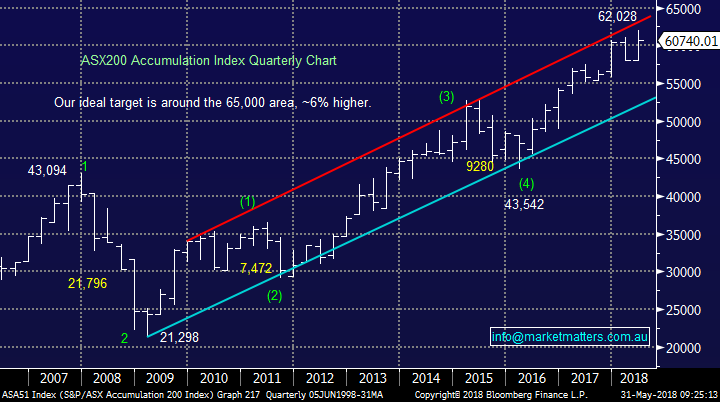
The local market has been enjoying an impressive uptrend since early 2009 with the ASX200 Accumulation Index up almost 200% from its post GFC low.
However even during this impressive rally the index has remained in a very clear long-term uptrend channel which is illustrated nicely by the following chart.
· At MM we believe the market will again fail, relatively soon, at the resistance line it’s been challenging in 2018, hence our “sell mode”.
ASX200 Accumulation Index Chart
Banks
The Australian Banking Sector has been the topic of many a conversation due to the Hayne Royal Commission and the underlying poor performance of the sector e.g. over the last year Commonwealth Bank (CBA) is down -12.6% while the ASX200 is up +4.5%. Rather than again go into the past poor practices of our banks let’s consider what comes next for the sector.
There are 2 reasons to own stocks - capital gain and yield and in the Australian market the “old world stocks” still provide the yield while it’s been the “new world, especially IT sector” that’s provided the capital gain. At MM we believe there is a place for both groups in a portfolio as long as they are recognised for what they actually represent.
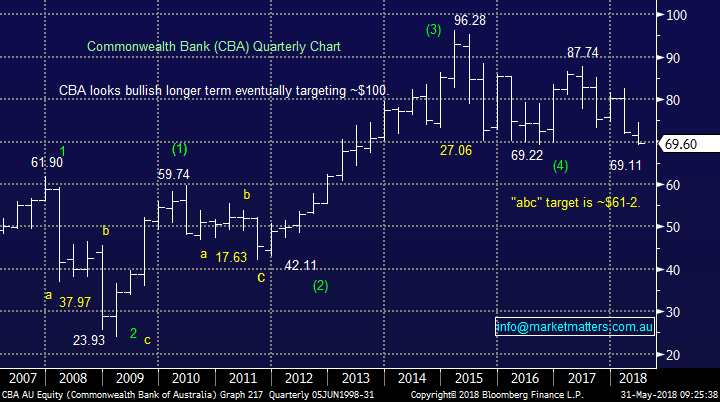
Let’s take sector / market heavyweight CBA for today’s banking roadmap, in our opinion it’s an “old world stock” but we still believe it has a place in a local portfolio:
CBA is currently paying a 6.2% fully franked yield which we feel is sustainable however investors should not be suckered in by yield alone – the performance of Telstra is perfect testament to that. If we are correct and a ~20% correction is looming for the ASX200 we can see CBA trading below $65 where it would be yielding above 6.5% p.a. Remember if CBA hits $62 in September 2019 investors will have received close to $7 in fully franked dividends.
· MM likes CBA below $70 and is a happy buyer into weakness but believes ammunition must be maintained for a test below $65.
Our feeling at this stage is if the market does correct ~20% the banks will fall but much of the price damage has already been done to the sector and we can see them outperforming. Hence, we feel the banks will offer a reasonable alternative to cash during any correction.
Commonwealth Bank (CBA) Quarterly Chart
Resources
The influential resources sector has enjoyed a phenomenal few years with the like of BHP doubling in price however as we have stated previously MM believes this rally is mature although probably not yet over.
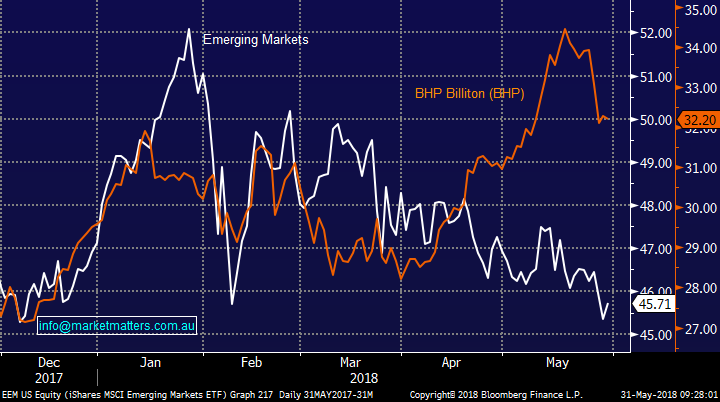
Historically BHP has tracked the Emerging Markets closely but since April it’s been a very different story and BHP has been a major outperformer, probably assisted by a weaker $A and likely capital management in the relatively near future. We now have 2 thoughts around Emerging Markets / BHP:
1. We believe it’s now 50-50 that the Emerging Markets will correct another 4%, if this unfolds in June and BHP follows we will buy BHP / resources into weakness as a short-term play.
2. If both, or just BHP, rally from here and ignore the usual weak June seasonal factors we will not chase strength.
Emerging Markets v BHP Billiton (BHP) Chart
Energy
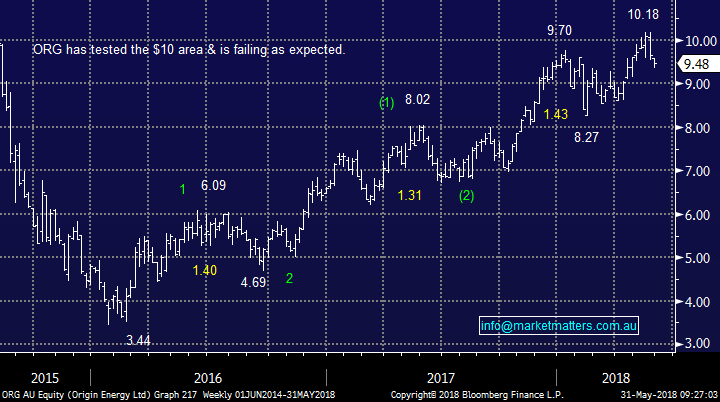
No change here, we are bearish the sector short-term targeting sub $9 for Origin Energy (ORG) – over 6% lower.
Origin Energy (ORG) Chart
Diversified Financials
This the sector where we have most concern. While its cheap its already struggling and will likely be worse if / when the market does experience a decent correction.
· We are looking for places to exit are holdings in Janus Henderson (JHG), IOOF Holdings (IFL) and Perpetual (PPT) for the least damage – preferably into strength
Telco’s
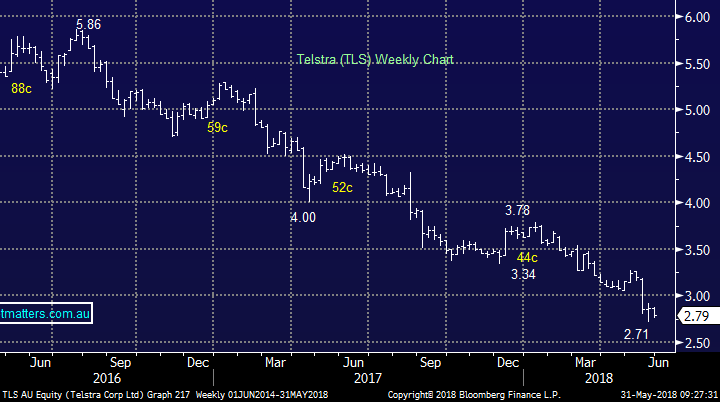
No change, our “out there” call is we like Telstra into current weakness.
Telstra (TLS) Chart
There are numerous other stocks which we haven’t mentioned but the last few weeks have shown us that high valuation stocks are more vulnerable now than they have for some time with A2 Milk (A2M) and Treasury Wine (TWE) both falling over 12% in the last month.
At MM we will be avoiding these perceived “safe stocks” moving forward which puts a line through many healthcare plays, at least for now plus, we may consider exiting A2M if a decent opportunity presents itself.
Active Investing
We’ve been fairly inactive over recent weeks and in hindsight I believe this was not ideal, some more opportune buying / selling would have added more value / “alpha” to our portfolio’s.
· At MM we are not traders but “active investors” which we firmly believe is how this mature bull market should be approached – it’s not buy & hold time.
I anticipate a few more alerts into EOFY.
Global indices
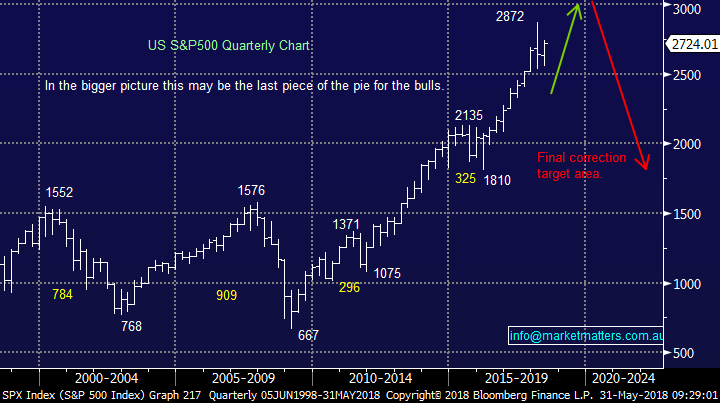
Overnight markets were strong as Italy concerns were apparently as quickly to disappear as they were to arrive, our short-term bullish view towards US stocks remains intact.
We remain short-term bullish US stocks targeting ~6% upside for the S&P500.
US S&P500 Chart
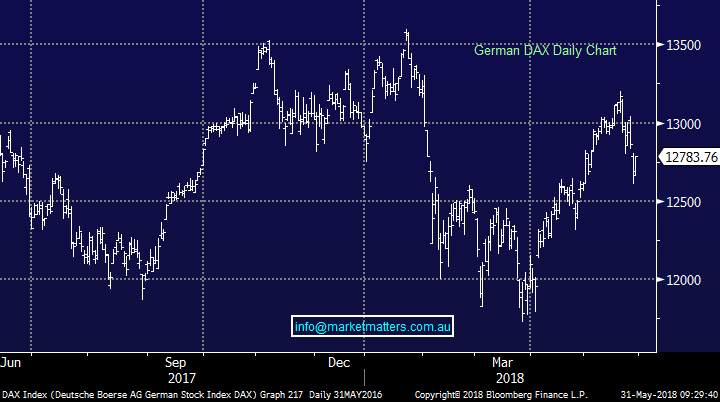
European stocks remain solid considering the recent Italian issues, a favourable vote in Spain on Friday and European markets are likely to surge towards fresh 2018 highs.
Technically the German DAX is saying just that, if it can close another 0.5% higher it will look great but it may need an obliging Spain to achieve that result.
German DAX Chart
Conclusion (s)
No change, we remain short-term positive stocks but sellers into strength as we believe a ~20% correction for stocks is looming on the horizon.
Overnight Market Matters Wrap
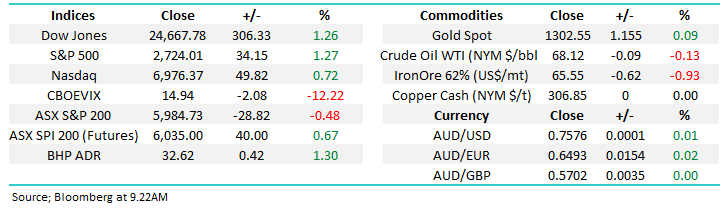
· The SPI is up 40 points as the US markets bounced back. The DJIA and S&P 500 rallied 1.25%, while the NASDAQ closed +0.9%.
· Equities were better after concerns over the Euro subsided. Italian leaders backed away from insisting that a Euroskeptic be named finance minister. In short, Italy is unlikely to leave the Euro, as feared.
· US 10 year bond yields rose to 2.85% as market participants took another look at the turmoil in Italy. Oil rallied nearly 3% for its first gains in a week as OPEC signaled that they will curb production until the end of the year.
· Copper fell to a 3 week low while nickel and zinc made small gains. Iron ore closed up 3%.
Have a great day!
James & the Market Matters Team
Disclosure
Market Matters may hold stocks mentioned in this report. Subscribers can view a full list of holdings on the website by clicking here. Positions are updated each Friday, or after the session when positions are traded.
Disclaimer
All figures contained from sources believed to be accurate. Market Matters does not make any representation of warranty as to the accuracy of the figures and disclaims any liability resulting from any inaccuracy. Prices as at 31/05/2018. 8.00AM.
Reports and other documents published on this website and email (‘Reports’) are authored by Market Matters and the reports represent the views of Market Matters. The MarketMatters Report is based on technical analysis of companies, commodities and the market in general. Technical analysis focuses on interpreting charts and other data to determine what the market sentiment about a particular financial product is, or will be. Unlike fundamental analysis, it does not involve a detailed review of the company’s financial position.
The Reports contain general, as opposed to personal, advice. That means they are prepared for multiple distributions without consideration of your investment objectives, financial situation and needs (‘Personal Circumstances’). Accordingly, any advice given is not a recommendation that a particular course of action is suitable for you and the advice is therefore not to be acted on as investment advice. You must assess whether or not any advice is appropriate for your Personal Circumstances before making any investment decisions. You can either make this assessment yourself, or if you require a personal recommendation, you can seek the assistance of a financial advisor. Market Matters or its author(s) accepts no responsibility for any losses or damages resulting from decisions made from or because of information within this publication. Investing and trading in financial products are always risky, so you should do your own research before buying or selling a financial product.
The Reports are published by Market Matters in good faith based on the facts known to it at the time of their preparation and do not purport to contain all relevant information with respect to the financial products to which they relate. Although the Reports are based on information obtained from sources believed to be reliable, Market Matters does not make any representation or warranty that they are accurate, complete or up to date and Market Matters accepts no obligation to correct or update the information or opinions in the Reports.
If you rely on a Report, you do so at your own risk. Any projections are estimates only and may not be realised in the future. Except to the extent that liability under any law cannot be excluded, Market Matters disclaims liability for all loss or damage arising as a result of any opinion, advice, recommendation, representation or information expressly or impliedly published in or in relation to this report notwithstanding any error or omission including negligence.
To unsubscribe. Click Here


